Dogecoin parabolic pump signs are appearing: the token has defended key support, shows a rising RSI and accumulation, and registers about $3 billion in futures open interest — indicators that increase the likelihood of a breakout toward the $0.29 resistance level.
-
Defended support and higher lows suggest base-building for a potential parabolic pump.
-
Rising RSI and steady volume on dips point to growing buying pressure and momentum.
-
On-chain indicators and approximately $3B futures open interest indicate institutional and retail accumulation.
Dogecoin parabolic pump signs build as RSI, $3B futures open interest and accumulation point to a possible breakout; read analysis and key levels.
What is driving Dogecoin’s parabolic pump outlook?
Dogecoin parabolic pump momentum appears to be driven by defended support levels, rising RSI, and concentrated accumulation across on-chain metrics and futures markets. These combined technical and on-chain signals are supporting a base that could allow the token to test the $0.29 resistance in the near term.
How does futures open interest and accumulation affect Dogecoin’s breakout probability?
Futures open interest near $3 billion signals heightened leveraged positioning, which can amplify moves when directional conviction increases. Combined with on-chain accumulation, rising hash rate, and stable network stress metrics, this creates a foundation where a sustained inflow could trigger a sharp, momentum-driven advance.
Dogecoin holds key support as analysts see rising RSI, $3B futures interest, and accumulation signaling a possible parabolic breakout.
- Dogecoin defends key support as charts show a second parabolic pump forming in 2025.
- Analysts see accumulation, rising RSI, and volume signaling momentum toward $0.29 resistance.
- On-chain data and $3B futures open interest suggest strong base-building for a breakout.
Dogecoin is showing signs of preparing for a second parabolic pump after an extended consolidation phase. The token has defended key support levels while forming higher lows, and chart patterns repeated from prior cycles suggest a potential expansion. At the time of reporting, Dogecoin price observations centered around $0.2108.
What chart structure indicates a parabolic pattern for Dogecoin?
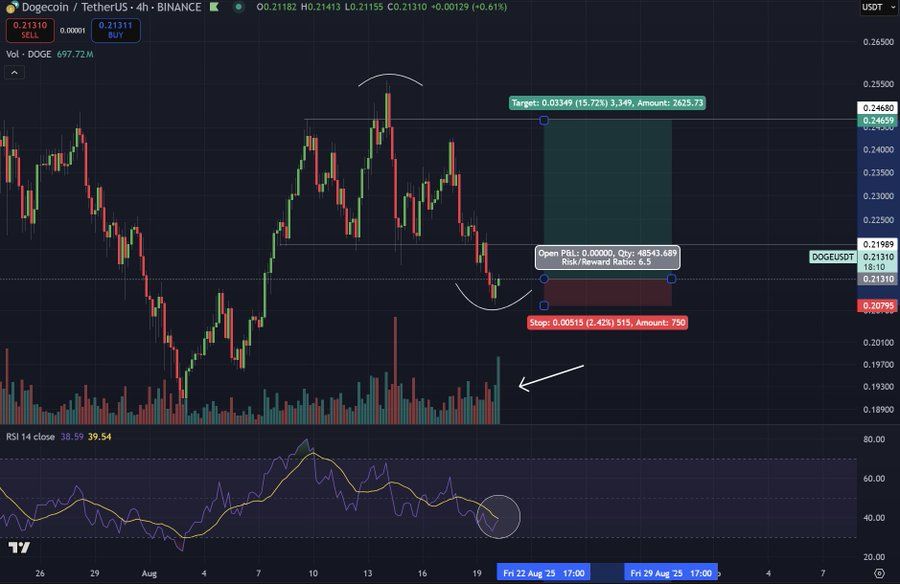
The visible structure shows a curved, accelerating ascent consistent with parabolic formations, with the second parabolic pattern beginning to develop in 2025. Price curved upward from around $0.15, indicating that momentum is building toward higher resistances and that market participants are rotating into long positions on dips.
$Doge/day is ready for Parabolic Pump 2 🔥 pic.twitter.com/zGOOEU2KlF
— Trader Tardigrade (@TATrader_Alan) August 21, 2025
This mirrors the mid-2024 move that preceded a steep rally before correction. An analyst observation from Cryptoinsightuk noted that Dogecoin has cleared recent highs and lows, a technical action that often signals an increased probability of reversal when combined with supportive volume trends.
 Source: Cryptoinsightuk (X)
Analyst commentary referenced a risk-to-reward ratio near 6.5, and noted that rising RSI together with steady turnover increases the chance of another test of $0.29. Volume metrics show buying strength on pullbacks, a common characteristic of base-building prior to sharp advances.
Why do on-chain metrics and network health matter for Dogecoin’s outlook?
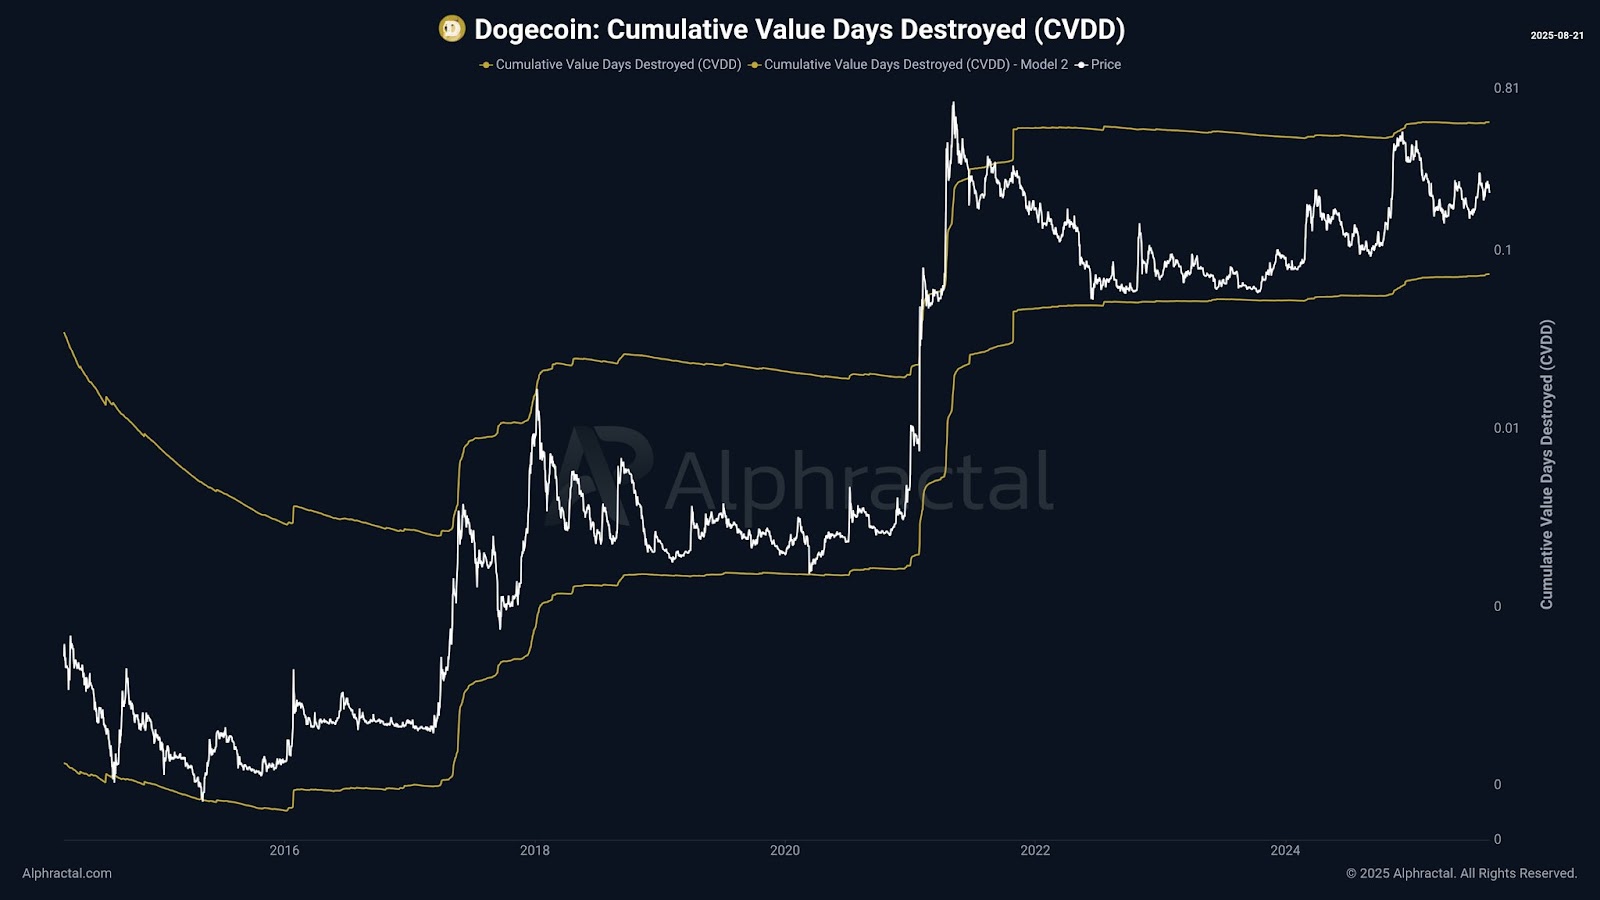
On-chain metrics such as accumulation patterns, hash rate trends, and network stress indexes provide objective evidence of participation and resilience. A rising hash rate since 2023 and a stable Network Stress Index indicate improved network health, supporting sustainable activity if price momentum returns.
 Source: CasAbbe (X)
Commenting on the pattern, analyst Cas Abbe said, “Dogecoin looks ready for a breakout,” citing repeated defense of support and rising trading volumes as evidence of base-building. Futures open interest near $3 billion suggests both institutional and retail participants are establishing positions.
Market capitalization measures show Dogecoin near $33 billion, with 24-hour trading volume around $3.4 billion. Historical comparisons indicate previous consolidation periods sometimes preceded rapid vertical moves; current conditions align with that pattern, though outcomes depend on broader market liquidity and risk-on flows.
Frequently Asked Questions
What price level should traders watch for a breakout?
Traders are watching the $0.29 resistance level as a key target for a breakout. A decisive close above $0.29 with rising volume would strengthen the breakout thesis and likely attract further momentum-driven buying.
How can retail investors assess risk during a potential parabolic move?
Retail investors should monitor support levels, position sizing, and use stop-losses to manage capital. Watch RSI divergence and volume spikes as early signs of exhaustion during parabolic advances.
Key Takeaways
- Base-building: Dogecoin has defended key support and formed higher lows, indicating consolidation strength.
- Technical momentum: Rising RSI and consistent buying on dips point to growing upward pressure.
- Market participation: Approximately $3B in futures open interest and on-chain accumulation suggest both retail and institutional engagement; monitor $0.29 resistance.
Conclusion
Dogecoin exhibits multiple signals consistent with a potential Dogecoin parabolic pump, including defended support, rising RSI, and significant futures open interest. While historical patterns favor strong moves after consolidation, outcomes will depend on market liquidity and macro sentiment. Readers should monitor price behavior at $0.29 and on-chain flow metrics for confirmation. COINOTAG will continue to report updates as conditions evolve.