AI16Z price is trading near a critical support at $0.10 after a 10% intraday drop; on-chain whale accumulation and buyer-dominant volume delta suggest a possible short-term rebound for AI coins, but liquidity clusters below current levels raise the risk of further downside if support fails.
-
AI coins market cap fell to $30.70B, down 3% — trading volume plunged 15%.
-
AI16Z dropped ~10% but is near an accumulation zone with rising whale buy orders.
-
Liquidation heatmap shows heavy liquidity below $0.10 and a cluster at $0.116 — watch breakout direction.
Meta description: AI16Z price update — AI coins slip 3%, AI16Z near $0.10 support; watch whale accumulation and liquidation heatmaps for reversal signals. Read now.
What is the AI16Z price outlook?
AI16Z price is trading in a tightening triangle near $0.10, a level that has attracted whale buys and on-chain accumulation. Short-term outlook is mixed: buyer-dominant CVD and volume delta hint at a rebound, while liquidity below recent action increases downside risk if $0.10 fails.
How does the liquidation heatmap affect AI16Z risk?
Liquidation heatmaps show deeper liquidity clustered below $0.10 and a dominant pocket near $0.99. This suggests price could follow liquidity toward those clusters. If many longs are liquidated, the sell-off could accelerate; conversely, long squeezes near $0.10 may trigger sharp rebounds.
Key Takeaways
AI coin struggle in the last 24 hours with AI16Z in the lead. Liquidity below recent price action could force another drop but buyers were stepping up.
The broader cryptocurrency market declined, with AI-focused tokens hit hardest as sector rotation intensified.
Hype around Solana-based AI projects faded, accelerating bearish pressure on related tokens.
At press time, the total market capitalization of AI coins stood at $30.70 billion, down 3% on the day.
Trading volume fell roughly 15%, per market aggregators (CoinMarketCap data referenced as plain text).
ai16Z (AI16Z) recorded a ~10% intraday decline but traded near a potential support zone that previously underpinned a 300% surge in one month.
AI16Z price has formed a triangle pattern since early April, repeatedly unable to clear a descending slanting resistance since the May 12 high.
Price sits below the SuperTrend indicator; the pattern’s approaching apex could lead to a breakout or a breakdown. A decisive break below $0.10 would likely trigger further selling.
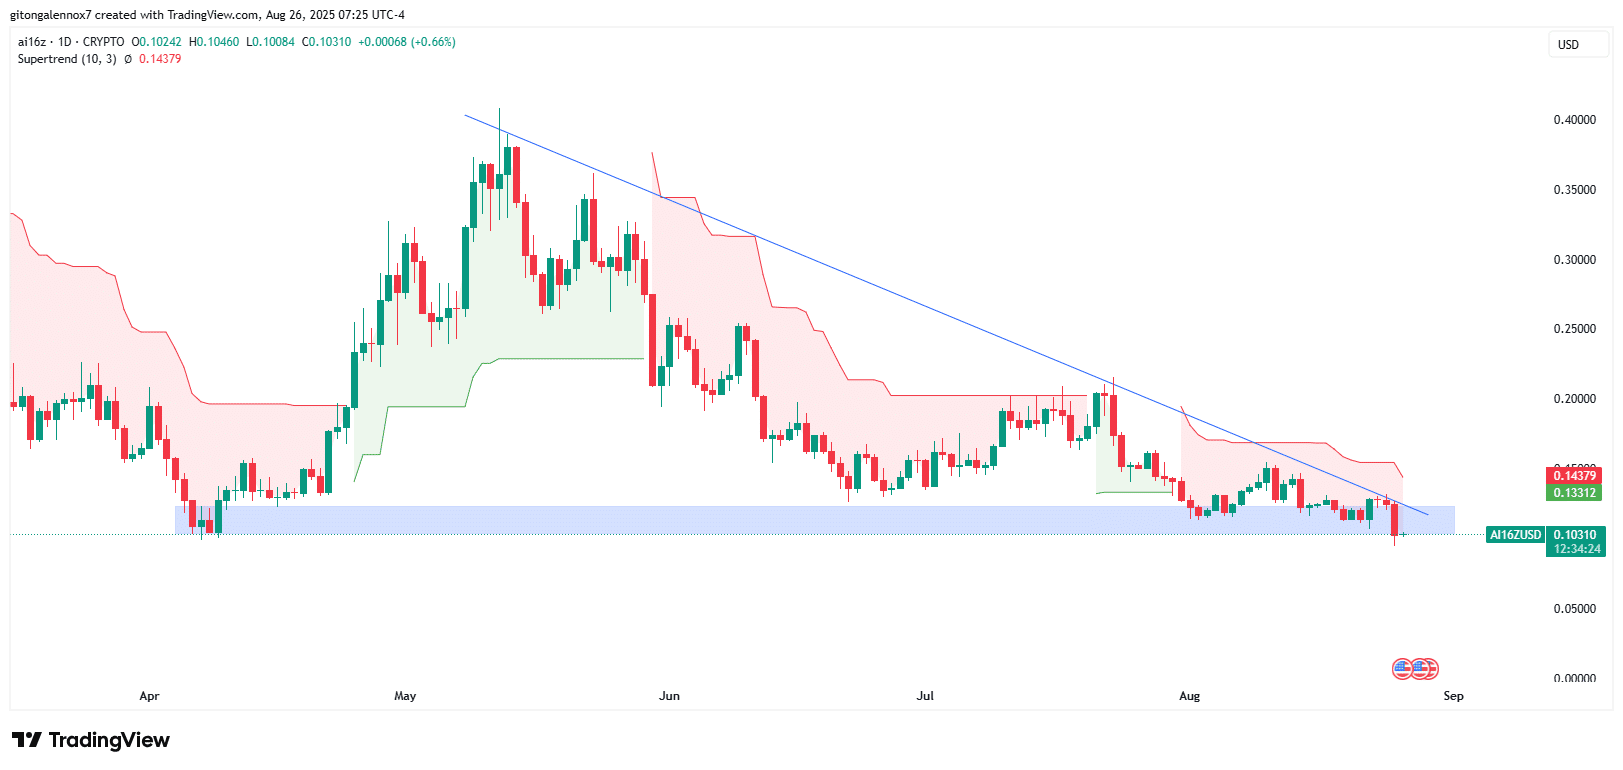
Source: TradingView (source name provided as plain text)
Liquidation analysis indicates deeper liquidity below $0.10, with the most dominant pocket near $0.99. Price tends to gravitate toward liquidity; traders should watch order flow when price approaches those clusters.
Some market participants may place longs just below $0.10 to catch a rebound, while others may close shorts; either dynamic could produce quick directional moves.
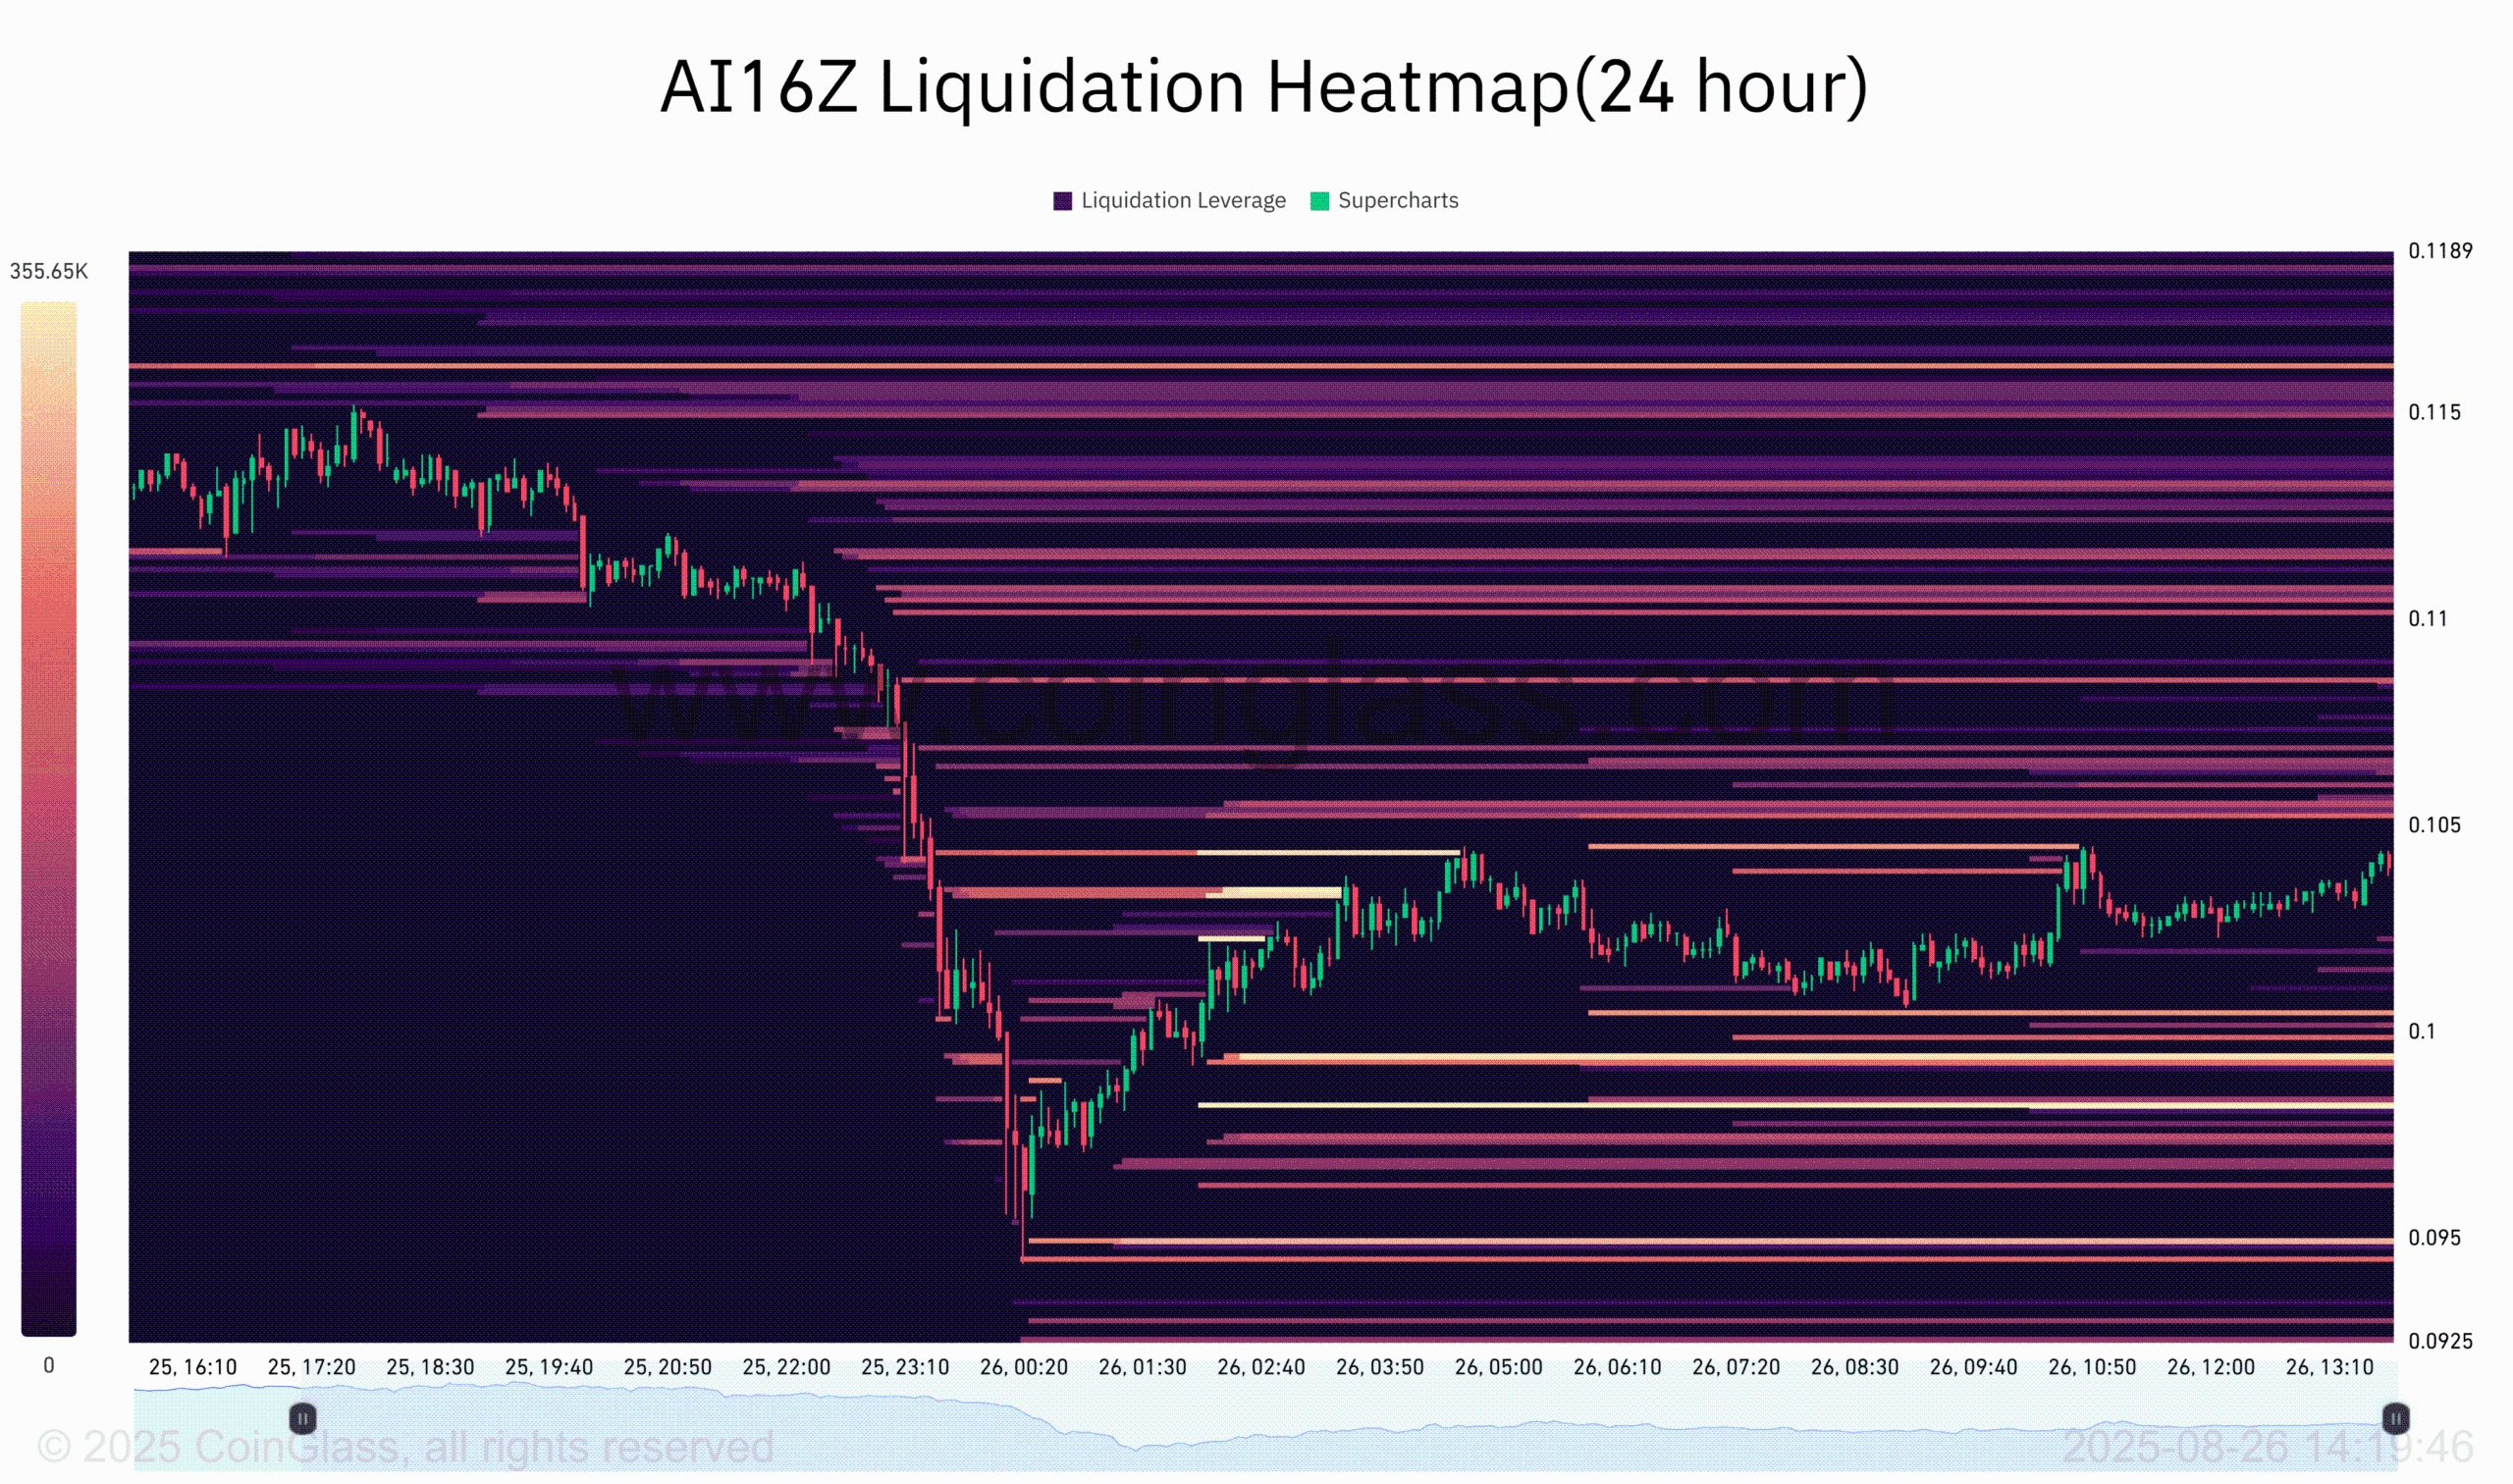
Source: CoinGlass (source name provided as plain text)
Whale orders surge as buyers step up
On-chain Spot and Futures taker CVD has been buyer-dominant since late June, indicating accumulation despite recent volatility.
The 90-day Volume Delta shows bias shifting toward buyers. CryptoQuant data (referenced as plain text) also highlights whale spikes at or below $0.10, strengthening the case for this level as an accumulation zone.
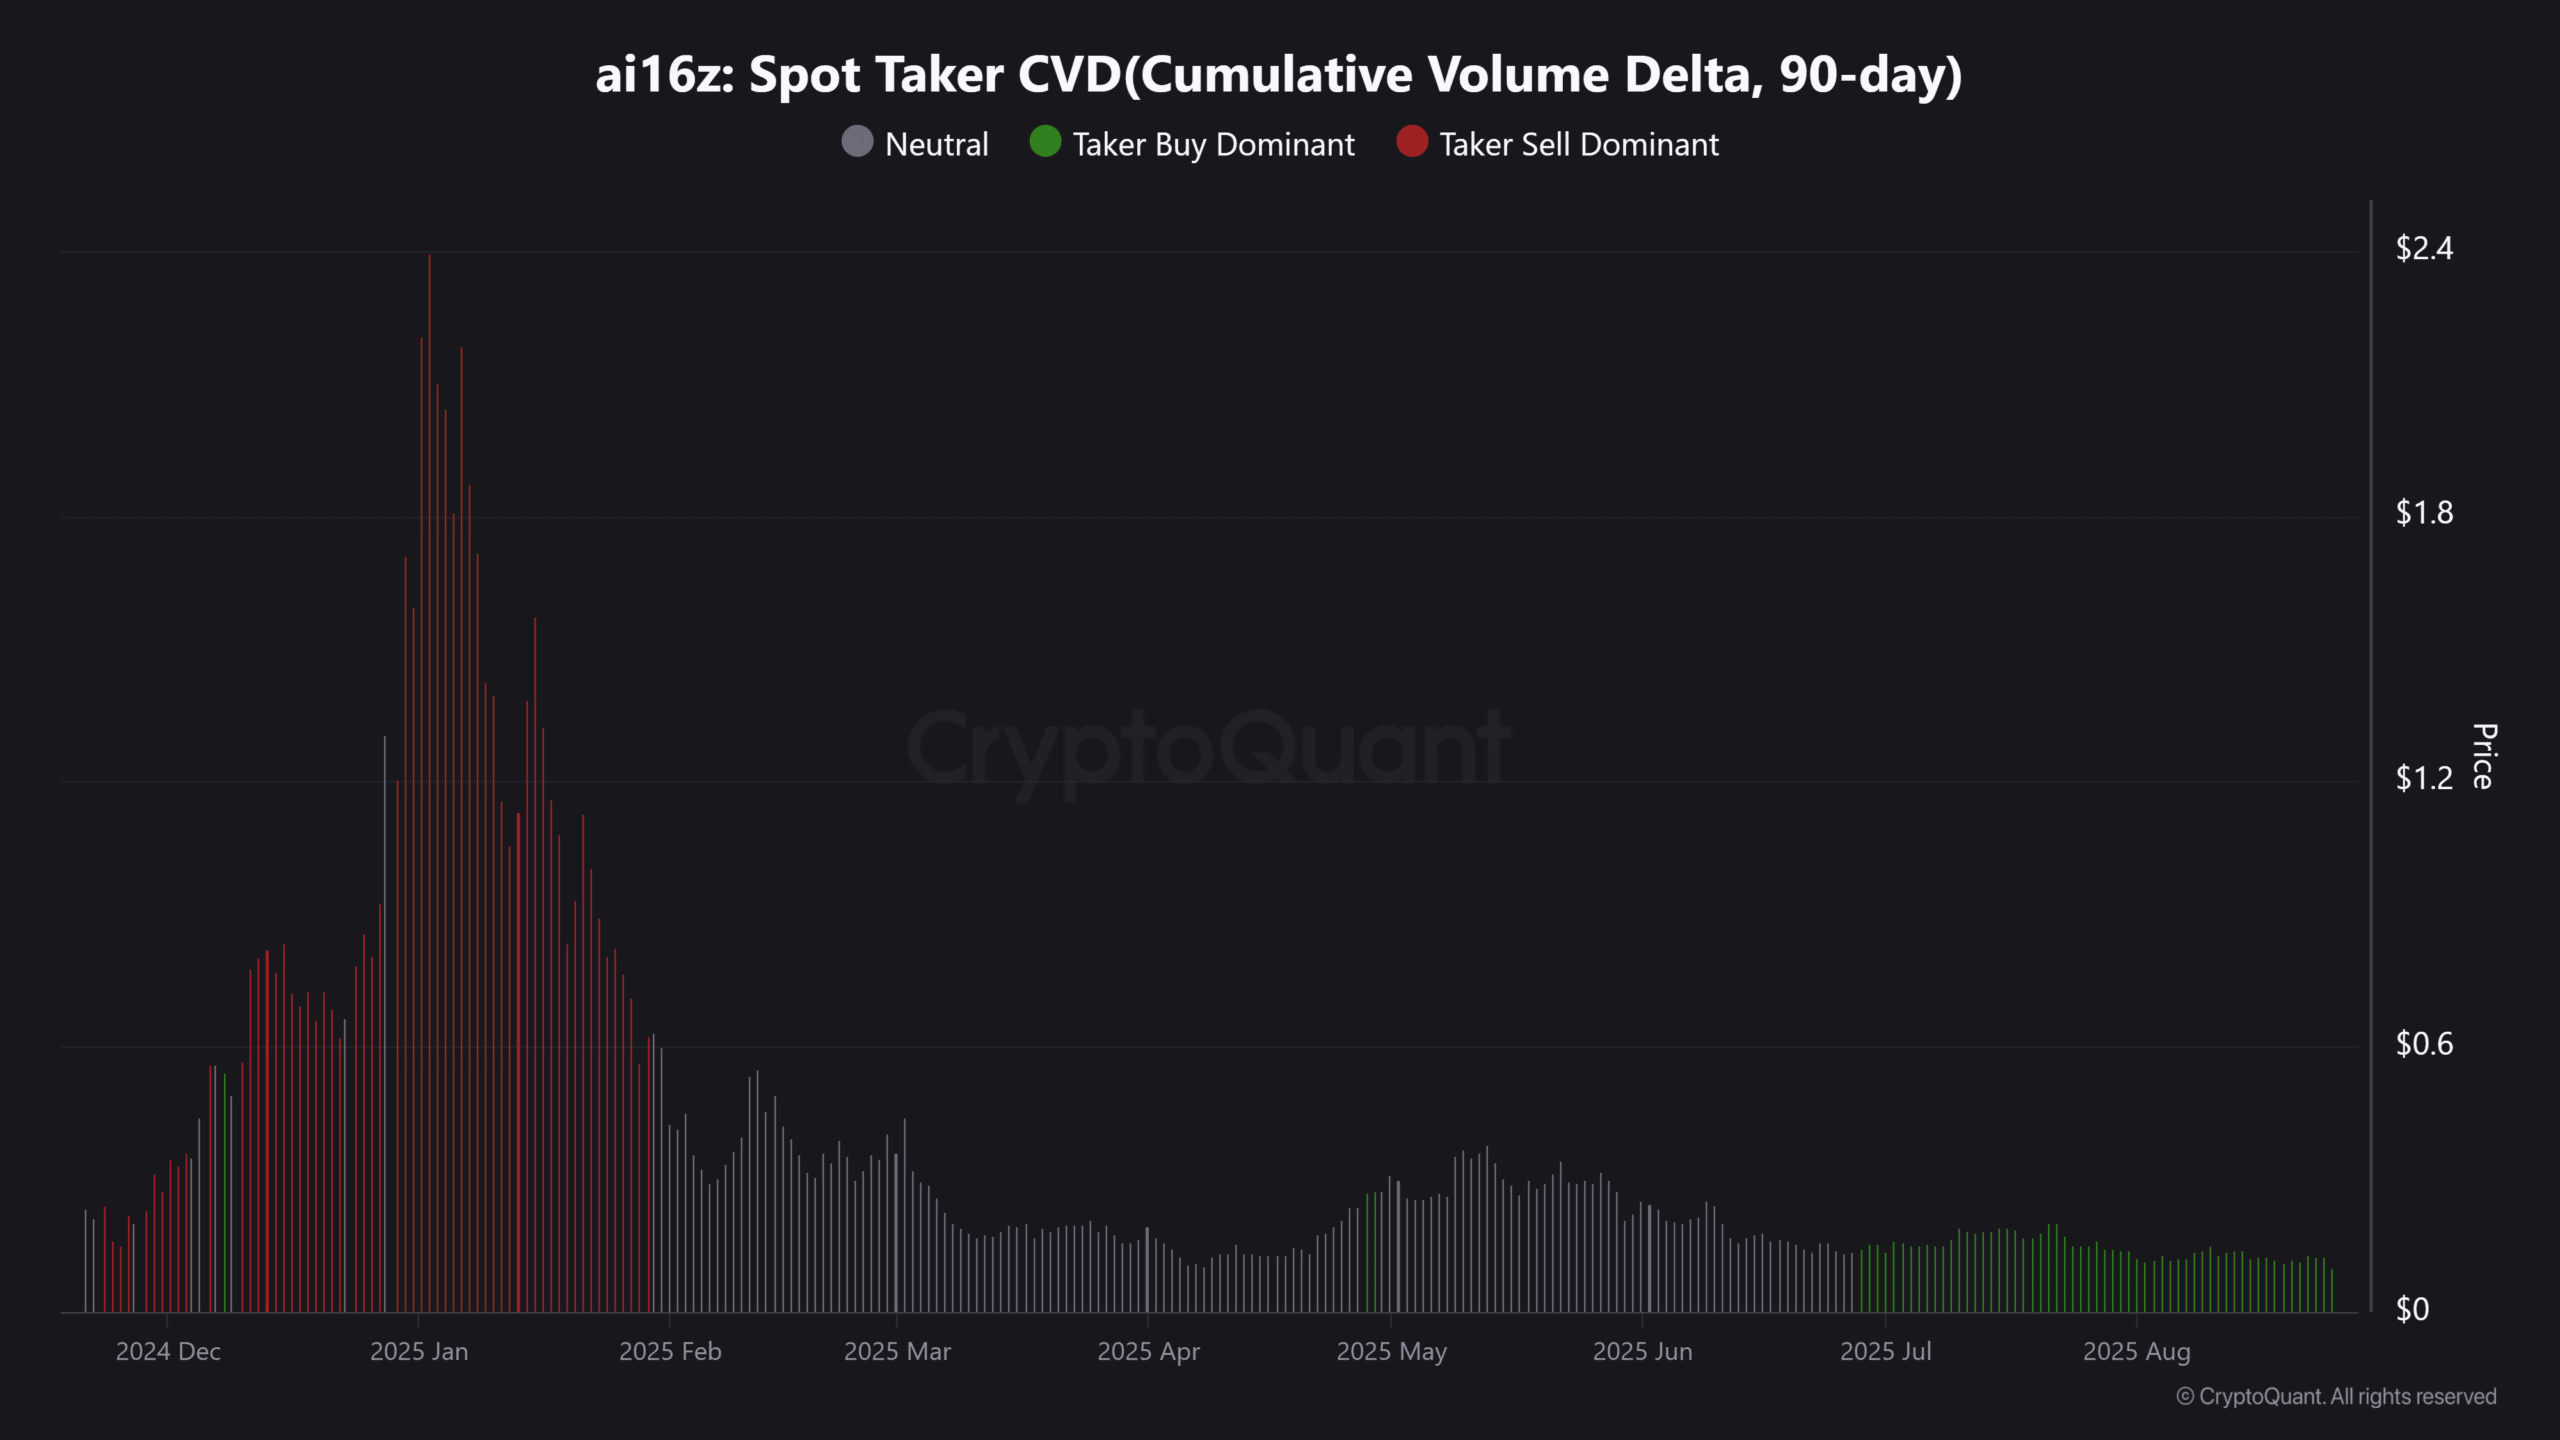
Source: CryptoQuant (source name provided as plain text)
Retail activity has been subdued; historical patterns show retail entrants often lag whale accumulation. Traders should therefore monitor on-chain order flow and liquidation clusters to time entries and exits.
Frequently Asked Questions
What level should traders watch for AI16Z support and resistance?
Traders should monitor $0.10 as the critical support zone and the triangle resistance formed since April. A decisive break below $0.10 suggests extended downside; a clean breakout above the slanting resistance signals a trend resumption.
How can on-chain metrics confirm a reversal for AI16Z?
Look for sustained buyer-dominant CVD, rising spot taker volume, and repeated whale accumulation at $0.10. Confirmation comes from tightening spreads on liquidations and a breakout with increasing volume.
Summary table: key metrics
| Total AI market cap | $30.70B (-3%) |
| 24h Volume | -15% |
| AI16Z move (24h) | -10% |
| Critical support | $0.10 |
| Key liquidity cluster | $0.116 / below $0.10 |
Conclusion
AI16Z price action reflects a sector-wide retracement in AI coins, with both risk and opportunity concentrated around $0.10. On-chain signals (buyer-dominant CVD, whale orders) point to potential accumulation, but traders must watch liquidity clusters and the triangle breakout direction. Follow structured on-chain and price triggers before entering positions.