Key Notes
- Bitcoin price dropped sharply to a daily low of $109,427 after losing $114K EMA support.
- The $107K support zone has emerged as a critical lifeline for a potential rebound.
- Over $411 million liquidated in 24 hours, with longs taking the biggest hit.
Bitcoin BTC $108 597 24h volatility: 3.8% Market cap: $2.16 T Vol. 24h: $49.28 B witnessed a sharp decline in the past 24 hours, dropping below the crucial $110,000 level.
After briefly touching a daily high of $113,000 , the cryptocurrency slid to $111,000 before plunging further to a low of $109,427.28.
The 3% drop resulted in Bitcoin losing support at both the 20-day and 50-day Exponential Moving Averages (EMAs), which had been positioned around $114,000.
The sudden decline has left traders questioning whether the current downtrend would be followed by a rebound.
Key Technical Outlook for Bitcoin
Technical analyst Captain Faibik noted that Bitcoin is still moving within a descending channel on the 4-hour chart.
According to him, the $107,000 support zone will be key to watch in the short term. If this level holds, he expects a reversal that could push Bitcoin back toward the $116,000 area over the weekend.
$BTC is still respecting the Descending Channel on the 4H TF Chart..!!
Currently eyeing the 107k support zone for a Potential bounce.
If this level holds, we could see a strong Reversal targeting the 116k area on Weekend.. 🚀 #Crypto #Bitcoin #BTCUSD pic.twitter.com/i4s6CuvUHr
— Captain Faibik 🐺 (@CryptoFaibik) August 29, 2025
The chart shared by Faibik highlights the lower boundary of the channel near $107,000, while the upper boundary aligns with the $116,000 region, making it a natural upside target should a bounce occur.
Liquidations Add Pressure
The selloff has been accompanied by heavy liquidations across the crypto market. Data from CoinGlass shows that over $411.46 million worth of positions were wiped out in the past 24 hours, with $351.65 million coming from long positions.
The past hour alone saw $63.46 million liquidated, of which $60 million were long positions. This suggests that the sudden dip caught many bullish traders off guard, adding to the price drop.
Institutional Confidence Remains Strong
Crypto asset management firm Bitwise released a report projecting that Bitcoin could reach $1.3 million by 2035, citing a 28.3% compound annual growth rate (CAGR).
The report emphasized that Bitcoin’s future growth will be driven by institutional demand rather than retail speculation, indicating that BTC could very well be the next crypto to explode .
In a bullish scenario, Bitwise estimates Bitcoin could approach $2.97 million, while a bearish outlook sees it bottoming at $88,005 by 2035.
Bitcoin Price Analysis: Wedge Pattern Signals Tension
The weekly chart highlights that Bitcoin is trading within a rising wedge pattern, a structure that often signals potential trend reversals.
The upper resistance line near $114,000 has acted as a ceiling, while the rising support trendline continues to hold prices from dropping too far. Currently, Bitcoin sits near the mid-range of this wedge, testing investor confidence.
Momentum indicators show mixed signals, with the RSI at 55, suggesting neutrality, while the MACD histogram shows fading bullish momentum.
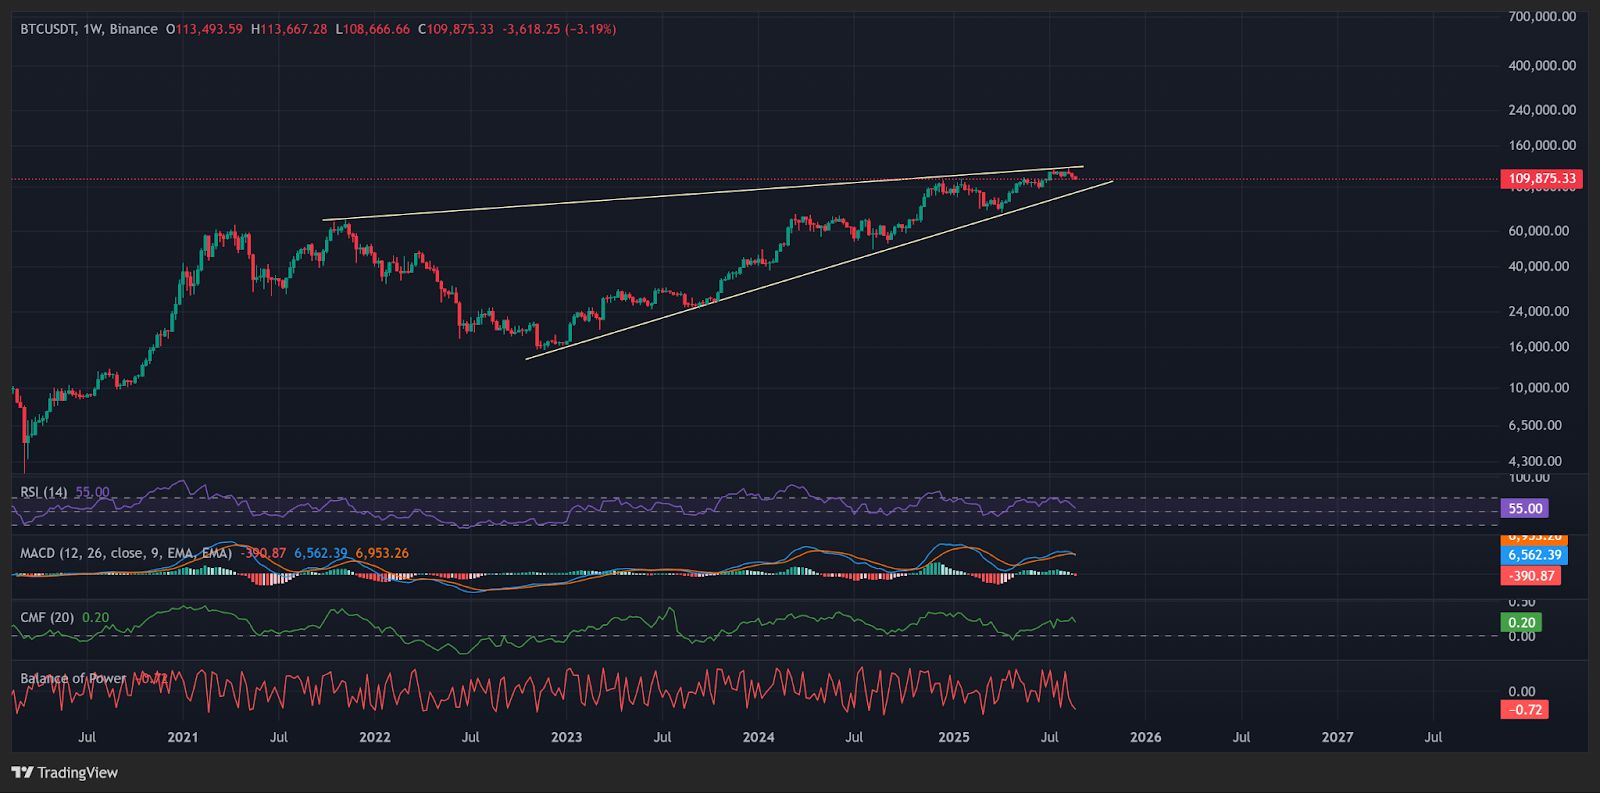
Bitcoin rising wedge pattern on the weekly chart. | Source: TradingView
The Chaikin Money Flow (CMF) remains positive at 0.20, pointing to ongoing capital inflows, but the Balance of Power indicates sellers are beginning to gain strength .
If Bitcoin fails to hold the wedge support, downside toward $107,000 becomes more likely, while a breakout above the resistance trendline could result in a rally toward $116,000 and beyond.
next