Bitget App
Trade smarter
Buy cryptoMarketsTradeFuturesEarnWeb3SquareMore
Trade
Spot
Buy and sell crypto with ease
Margin
Amplify your capital and maximize fund efficiency
Onchain
Going Onchain, without going Onchain!
Convert & block trade
Convert crypto with one click and zero fees
Explore
Launchhub
Gain the edge early and start winning
Copy
Copy elite trader with one click
Bots
Simple, fast, and reliable AI trading bot
Trade
USDT-M Futures
Futures settled in USDT
USDC-M Futures
Futures settled in USDC
Coin-M Futures
Futures settled in cryptocurrencies
Explore
Futures guide
A beginner-to-advanced journey in futures trading
Futures promotions
Generous rewards await
Overview
A variety of products to grow your assets
Simple Earn
Deposit and withdraw anytime to earn flexible returns with zero risk
On-chain Earn
Earn profits daily without risking principal
Structured Earn
Robust financial innovation to navigate market swings
VIP and Wealth Management
Premium services for smart wealth management
Loans
Flexible borrowing with high fund security
Near Protocol (NEAR) To Dip Further Before Bounce Back? Key Emerging Harmonic Pattern Saying Yes!

Near Protocol (NEAR) To Dip Further Before Bounce Back? Key Emerging Harmonic Pattern Saying Yes!

CoinsProbeCoinsProbe2025/09/01 18:25
By:Nilesh Hembade

Date: Mon, Sept 01, 2025 | 07:20 AM GMT

The cryptocurrency market continues to navigate choppy waters as Ethereum (ETH) hovers near $4,400, down from its recent peak of $4,954, marking a 5% weekly decline. This weakness has spilled over into major altcoins , including Near Protocol (NEAR).

Currently, NEAR is trading 4% lower on the day, extending its weekly losses to 8%. But beneath the surface, the chart is highlighting a potential harmonic setup, suggesting the token could face a bit more downside before staging a meaningful rebound.

Near Protocol (NEAR) To Dip Further Before Bounce Back? Key Emerging Harmonic Pattern Saying Yes! image 0 
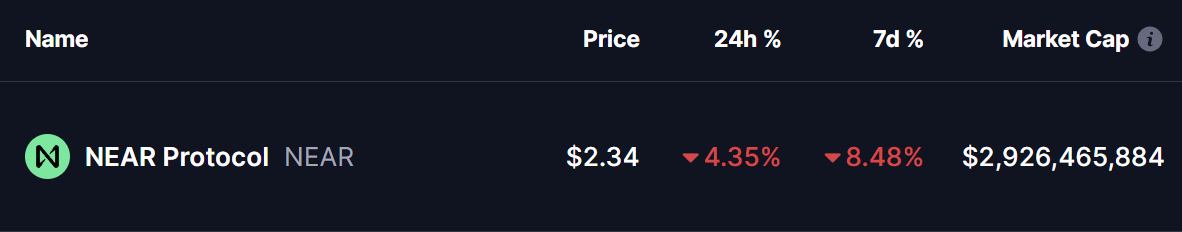
Source: Coinmarketcap

Bullish Gartley Harmonic Pattern in Play?

On the daily chart, NEAR appears to be forming a bullish Gartley harmonic pattern. The recent decline has brought the price into the final leg of the structure (CD), moving closer to the Potential Reversal Zone (PRZ).

This PRZ is sitting near the 0.786 Fibonacci retracement of the XA leg, aligning almost perfectly with the $2.07 level. Historically, this zone often acts as a launchpad for bullish reversals, provided buyers step in with enough momentum.

Near Protocol (NEAR) To Dip Further Before Bounce Back? Key Emerging Harmonic Pattern Saying Yes! image 1 Near Protocol (NEAR) Daily Chart/Coinsprobe (Source: Tradingview)

What’s Next for NEAR?

If NEAR confirms a bounce at the $2.07 PRZ, the Gartley pattern suggests a recovery move toward higher Fibonacci levels. The first key resistance lies near the 0.618 retracement at $2.70, followed by a potential full extension target around $3.09.

On the flip side, caution remains essential. Should NEAR fail to hold above $2.07, the bullish harmonic setup would be invalidated, exposing the token to further downside risk.

0

Disclaimer: The content of this article solely reflects the author's opinion and does not represent the platform in any capacity. This article is not intended to serve as a reference for making investment decisions.

PoolX: Earn new token airdrops
Lock your assets and earn 10%+ APR
Lock now!

You may also like

New spot margin trading pair — HOLO/USDT!

Bitget Announcement2025/09/12 07:46

FUN drops by 32.34% within 24 hours as it faces a steep short-term downturn

- FUN plunged 32.34% in 24 hours to $0.008938, marking a 541.8% monthly loss amid prolonged bearish trends. - Technical breakdowns, elevated selling pressure, and forced liquidations highlight deteriorating market sentiment and risk-off behavior. - Analysts identify key support below $0.0080 as critical, with bearish momentum confirmed by RSI (<30) and MACD indicators. - A trend-following backtest strategy proposes short positions based on technical signals to capitalize on extended downward trajectories.

Bitget-RWA2025/09/12 06:14
FUN drops by 32.34% within 24 hours as it faces a steep short-term downturn

OPEN has dropped by 189.51% within 24 hours during a significant market pullback

- OPEN's price plummeted 189.51% in 24 hours to $0.8907, marking its largest intraday decline in history. - The token fell 3793.63% over 7 days, matching identical monthly and yearly declines, signaling severe bearish momentum. - Technical analysts cite broken support levels and lack of bullish catalysts as key drivers of the sustained sell-off. - Absence of stabilizing volume or reversal patterns leaves the market vulnerable to further downward pressure.

Bitget-RWA2025/09/12 06:14
OPEN has dropped by 189.51% within 24 hours during a significant market pullback

New spot margin trading pair — LINEA/USDT!

Bitget Announcement2025/09/11 10:04