

Ethereum price is trading near $4,377 with short-term bullish momentum after a bounce from $4,257; a clean daily close above $4,377 could push ETH toward $4,500 while failure to hold $4,257 risks a deeper pullback.
-
ETH shows short-term bullish momentum after support at $4,257
-
Watch $4,377 as immediate resistance and $4,500 as the next upside target
-
Short-term stability confirmed by hourly charts; macro direction still range-bound
Ethereum price update: ETH price near $4,377 after a bounce from $4,257 — follow live market levels and technical targets on Coinotag.
Most of the coins are back in the green zone today, according to CoinStats.
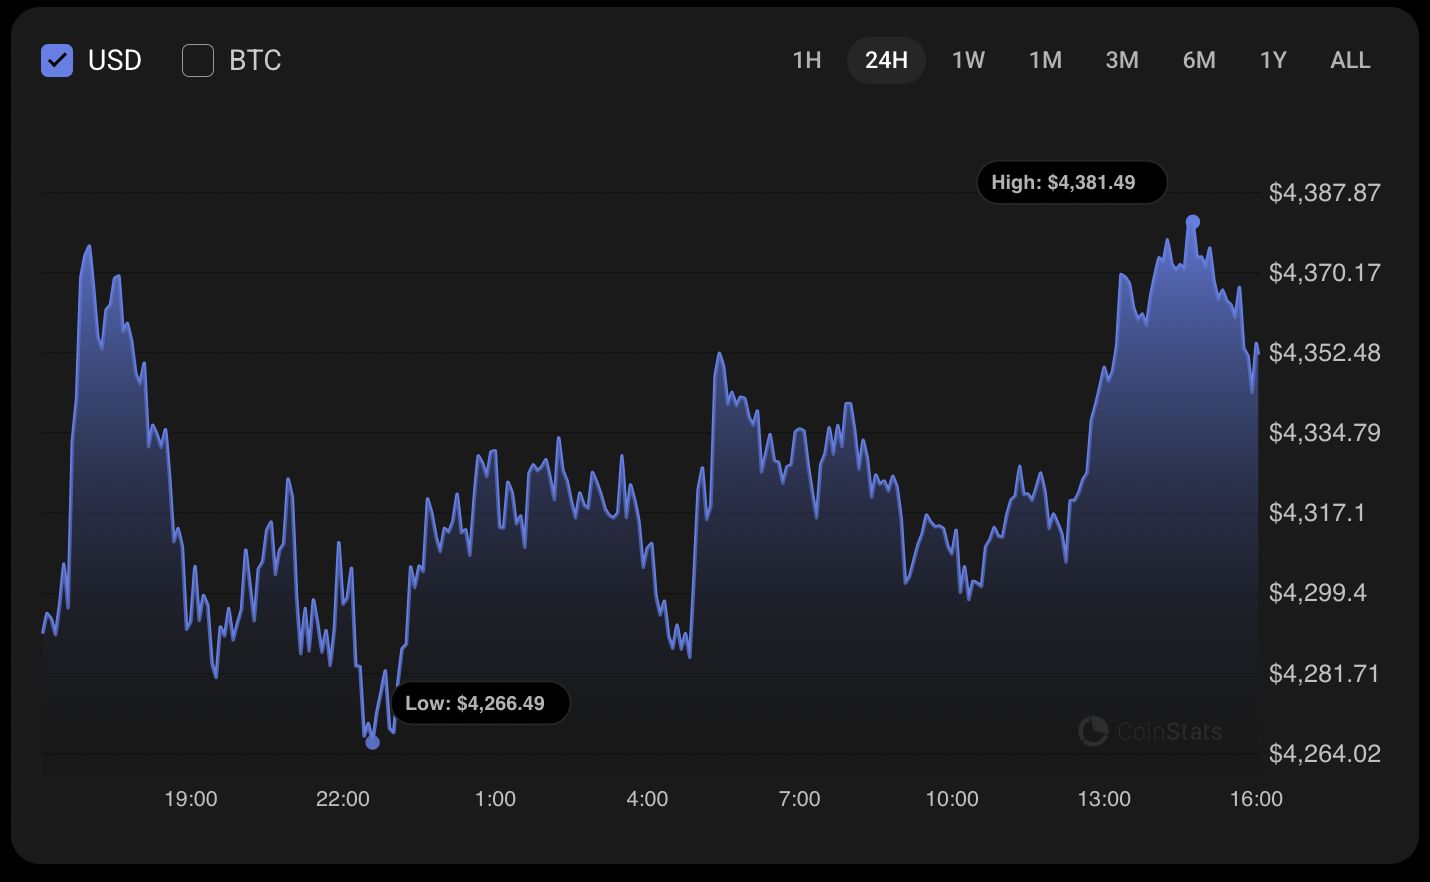
Image by TradingView
What is the current ETH/USD price trend?
Ethereum price is trading at approximately $4,377 and has risen 1.80% since yesterday. The hourly chart shows bullish momentum, with immediate resistance near $4,377; a confirmed break could open a move toward $4,400–$4,500. Short-term support sits at $4,257.
How is the hourly chart shaping ETH price action?
On the hourly timeframe, ETH has formed higher lows after the bounce from $4,257. If the hourly close is clean above $4,377, traders may see continuation toward $4,400. Volume and candle structure suggest momentum is building but not yet extended.
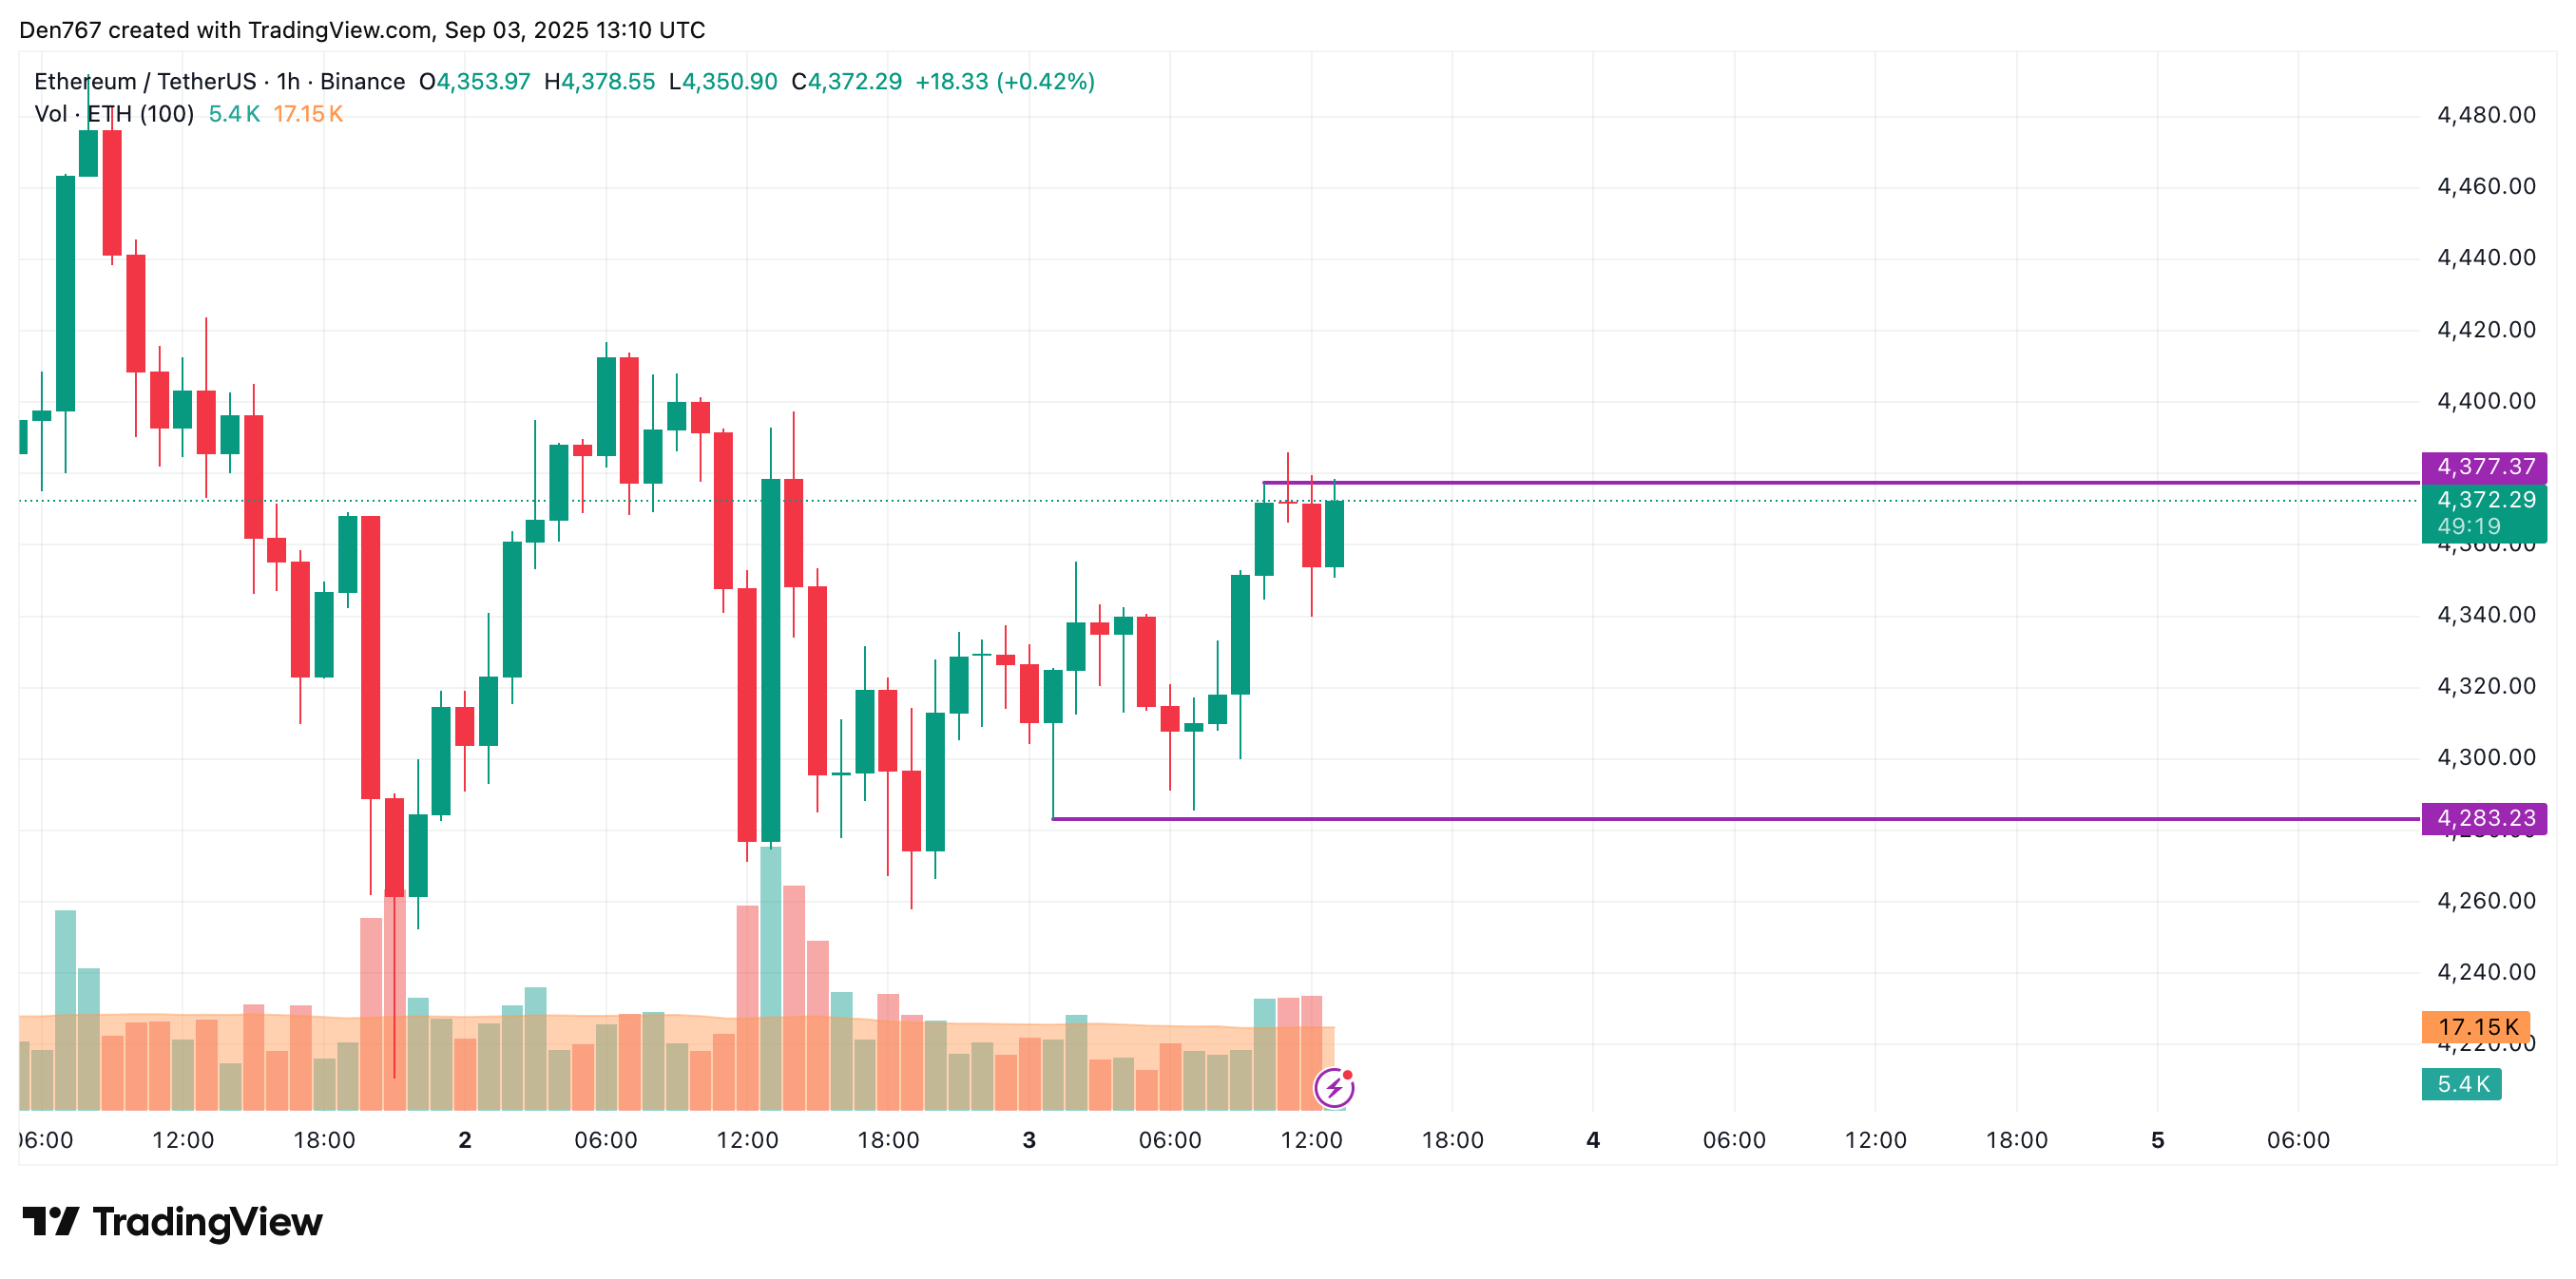
Image by TradingView
On the larger daily chart, the price is recovering after testing the support zone. A daily close without a long upper wick would increase the probability of a test of $4,500 in the near term.
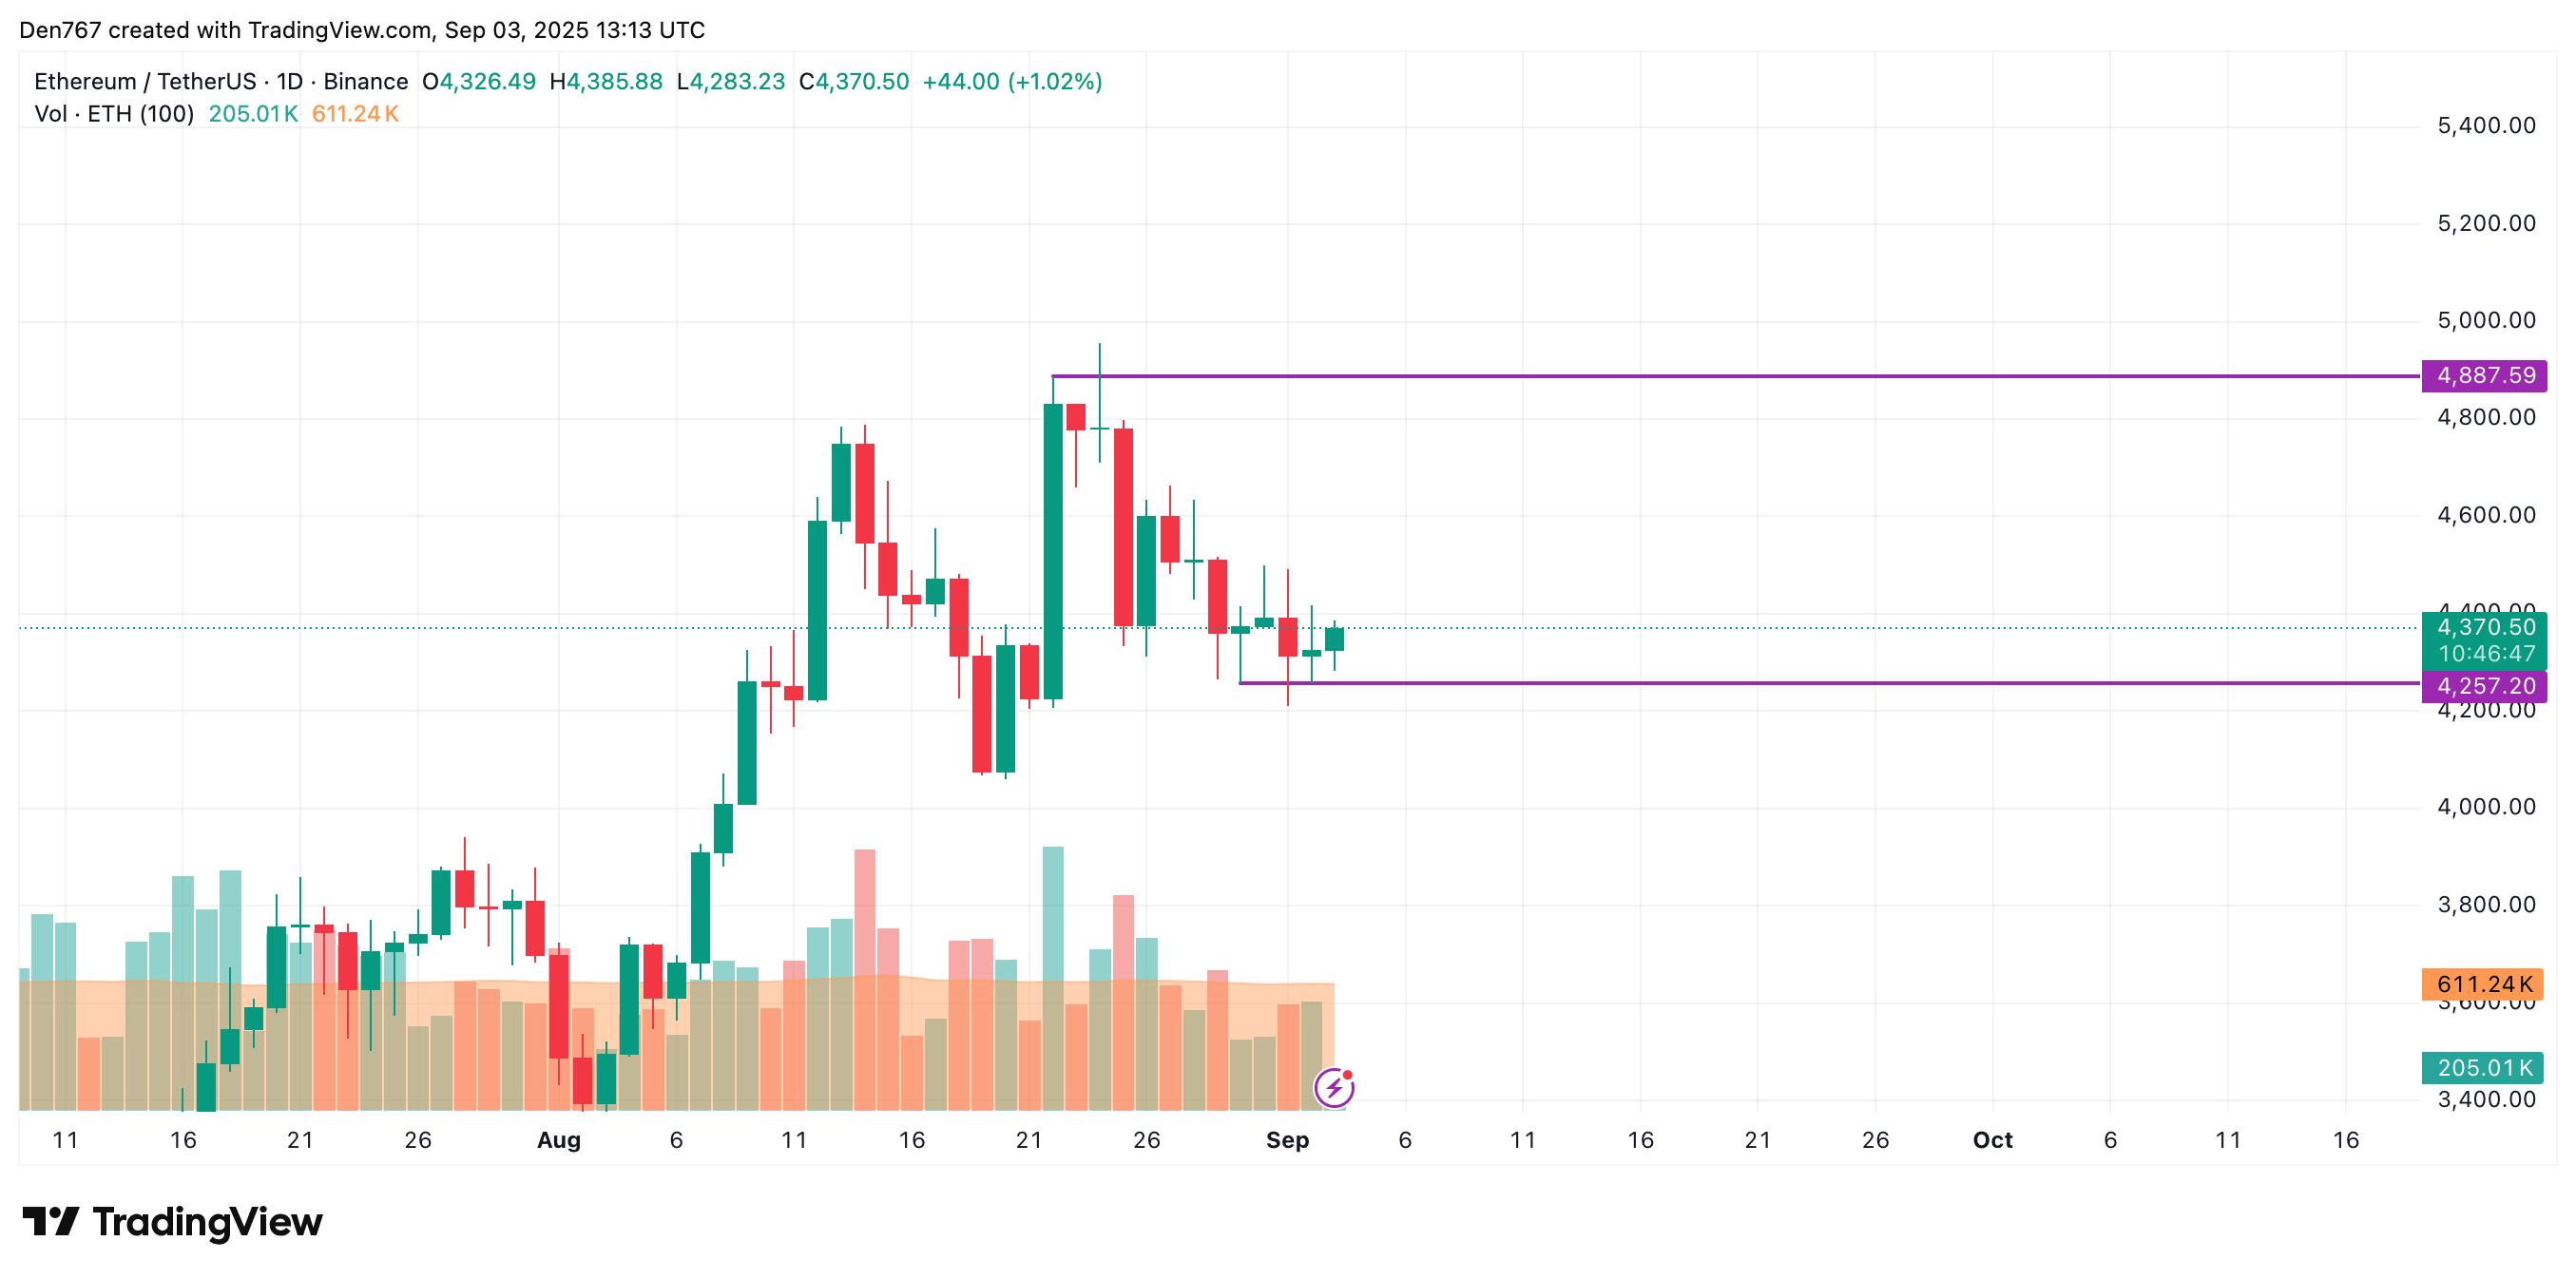
Image by TradingView
From a midterm perspective, neither buyers nor sellers are fully dominant. Price remains between key levels, so sharp directional moves are unlikely without a catalyst. Ethereum is trading at $4,377 at press time.
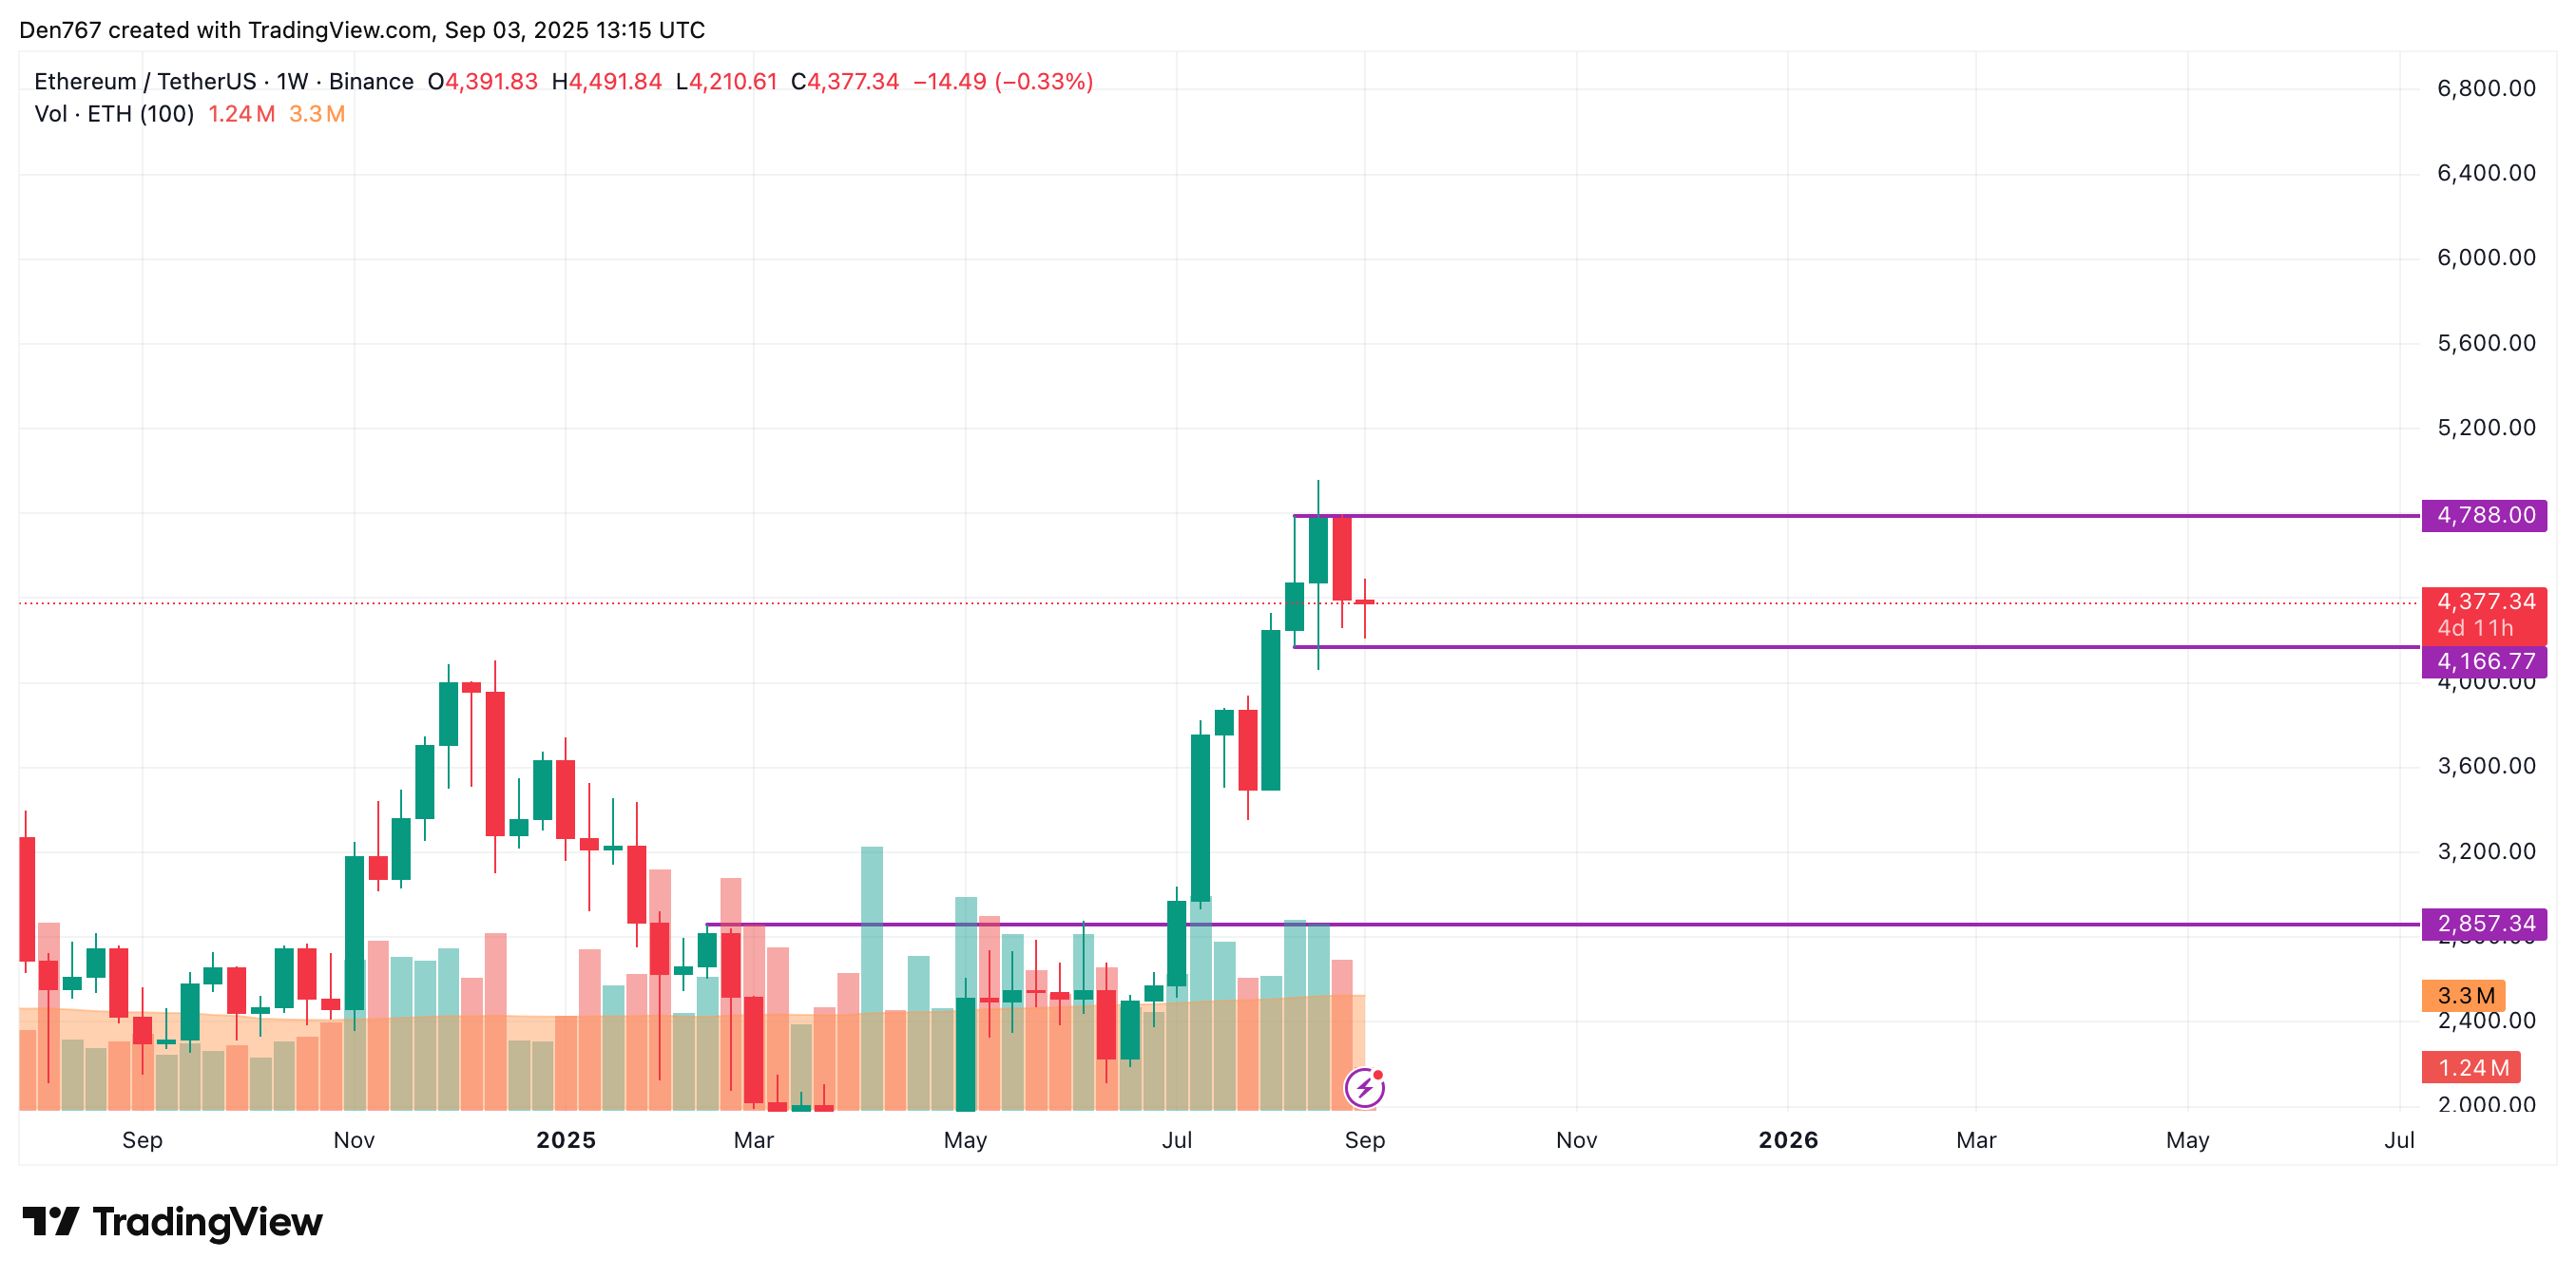
Image by TradingView
When could ETH test $4,500 and what would invalidate the bullish setup?
If the daily candle closes near its high and maintains a small wick, a test of the $4,500 area becomes likely within several sessions. Conversely, a drop below $4,257 with increased selling volume would invalidate the short-term bullish case and raise the risk of a deeper correction.
What levels should traders monitor?
-
Support 1: $4,257 — recent bounce zone
-
Resistance 1: $4,377 — immediate pivot
-
Upside Target: $4,500 — next significant resistance
How to interpret the technical signals on ETH charts?
- Confirm hourly close above $4,377 for short-term continuation.
- Monitor volume on breakouts; low volume breakouts are suspect.
- Use $4,257 as a stop-loss anchor for bullish intraday positions.
Comparative technical summary
| Current price | $4,377 | Short-term bullish |
| Support | $4,257 | Key bounce area |
| Resistance | $4,377–$4,500 | Targets on confirmed break |
Frequently Asked Questions
What is the probability ETH reaches $4,500 soon?
Probability increases if daily closes remain strong with low wick and volume supports upward moves. A confirmed close above $4,377 raises odds; failure at that resistance reduces the likelihood.
How should I manage risk on ETH trades?
Set stop-loss near $4,257 for bullish intraday trades, size positions based on volatility, and confirm entries with volume and clean candle closes for lower downside risk.
Key Takeaways
- Short-term bullish: ETH bounced from $4,257 and trades near $4,377.
- Critical levels: $4,257 support, $4,377 resistance, $4,500 next target.
- Action: Confirm hourly/daily closes and volume before adding exposure.
Conclusion
This technical update shows Ethereum price trading with short-term bullish momentum after a support test at $4,257. Monitor $4,377 for confirmation and $4,500 as the next upside target. For traders and analysts, use volume and clean candle closes to validate breakouts and manage risk carefully. Published by COINOTAG — updated 2025-09-03.