
Ethereum Price Struggles Badly – More Downside Risk if Support Fails

Ethereum price started a fresh recovery wave above the $4,350 zone but failed. ETH is still struggling and might slide below the $4,270 zone.
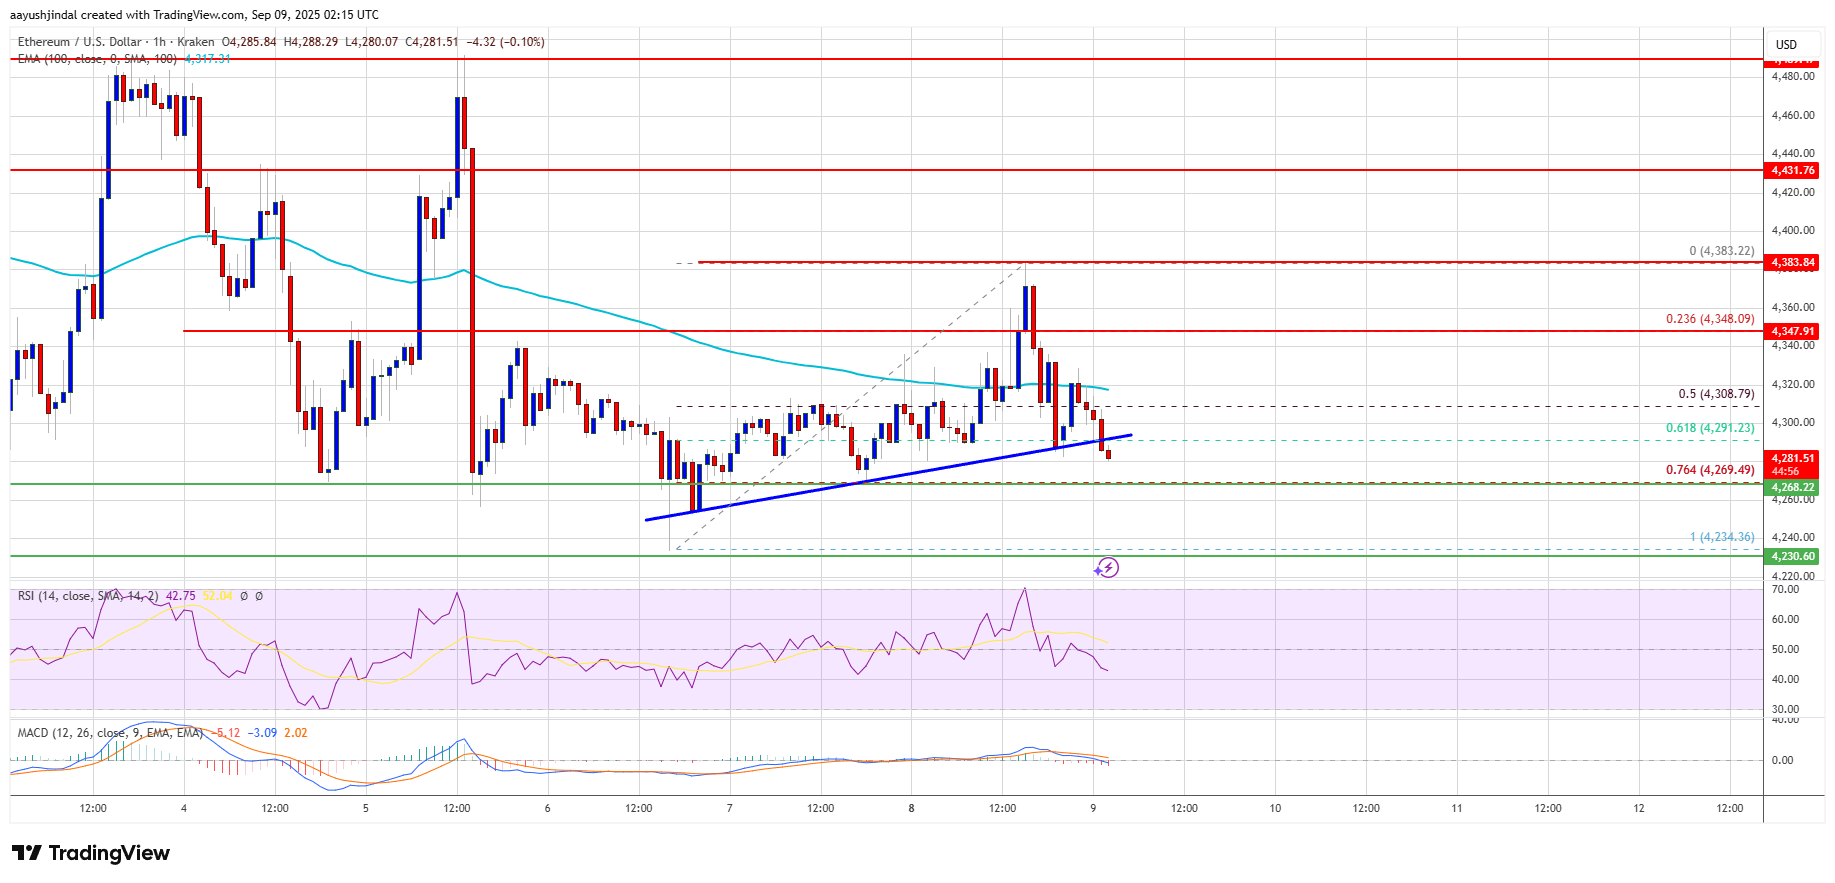
- Ethereum is still struggling to recover above the $4,400 zone.
- The price is trading below $4,350 and the 100-hourly Simple Moving Average.
- There was a break below a bullish trend line with support at $4,290 on the hourly chart of ETH/USD (data feed via Kraken).
- The pair could start a strong decline if it settles below the $4,220 level in the near term.
Ethereum Price Could Slide Further
Ethereum price started a recovery wave after it formed a base above the $4,220 zone, like Bitcoin. ETH price was able to climb above the $4,300 and $4,320 resistance levels before the bears appeared.
The price struggled to clear the $4,400 level. A high was formed at $4,383 and the price started to decline again. There was a move below the $4,320 support level. The price dipped below the 50% Fib retracement level of the recent increase from the $4,234 swing low to the $4,383 high.
Besides, there was a break below a bullish trend line with support at $4,290 on the hourly chart of ETH/USD. Ethereum price is now trading below $4,320 and the 100-hourly Simple Moving Average.
On the upside, the price could face resistance near the $4,320 level. The next key resistance is near the $4,360 level. The first major resistance is near the $4,400 level. A clear move above the $4,400 resistance might send the price toward the $4,440 resistance. An upside break above the $4,440 resistance might call for more gains in the coming sessions. In the stated case, Ether could rise toward the $4,500 resistance zone or even $4,550 in the near term.
More Downside In ETH?
If Ethereum fails to clear the $4,360 resistance, it could start a fresh decline. Initial support on the downside is near the $4,270 level. The first major support sits near the $4,220 zone.
A clear move below the $4,220 support might push the price toward the $4,200 support. Any more losses might send the price toward the $4,160 support level in the near term. The next key support sits at $4,120.
Technical Indicators
Hourly MACD – The MACD for ETH/USD is gaining momentum in the bearish zone.
Hourly RSI – The RSI for ETH/USD is now below the 50 zone.
Major Support Level – $4,220
Major Resistance Level – $4,360
Disclaimer: The content of this article solely reflects the author's opinion and does not represent the platform in any capacity. This article is not intended to serve as a reference for making investment decisions.
You may also like
Fed Chair’s Dovish Tone Signals Rate Cuts May Resume in September; Slower Capital Inflows and Sector Rotation Lead to BTC Correction (08.18~08.24)
After the dovish remarks from the Federal Reserve Chairman, non-farm payrolls and August inflation data have become the main trading focuses for the market going forward.

US employment data supports restarting interest rate cuts in September, new SEC regulations cool down treasury companies, BTC weekly increase of 2.66% (09.01~09.07)
The new SEC regulations will slow down the pace and scale of acquisitions by treasury companies, which the market views as a significant bearish factor.

Gachapon on the blockchain is already a hundred-million dollar market
From Labubus to Pokémon

The "perfect macro narrative" is forming—will the crypto market usher in the start of a new quarterly trend?
If rate cuts are completed and a dovish stance is expressed, it may drive the market to break through resistance. If an unexpectedly hawkish stance occurs (a low probability event), it could trigger a pullback.

Trending news
MoreFed Chair’s Dovish Tone Signals Rate Cuts May Resume in September; Slower Capital Inflows and Sector Rotation Lead to BTC Correction (08.18~08.24)
US employment data supports restarting interest rate cuts in September, new SEC regulations cool down treasury companies, BTC weekly increase of 2.66% (09.01~09.07)