Shiba Inu’s Breakout Attempt Could Be a Trap Unless Price Clears One Key Level

Shiba Inu price is testing a breakout pattern, but profit-taking and bearish signals suggest the move could be a bull trap unless $0.00001351 breaks.
Shiba Inu price has gained 7.2% over the past week, fueling hopes of a breakout. But traders looking to ride this momentum may need to think twice. SHIB is moving closer to the upper edge of a pattern that often flips both ways — and false signals here can be costly.
Also, a few on-chain and technical hints have surfaced that show that, despite the weekly price surge, all might not be well with the broader Shiba Inu price action, and a trap might be forming for the bulls if they are not attentive.
Profit-Taking Metrics And Exchange Flows Signal Selling
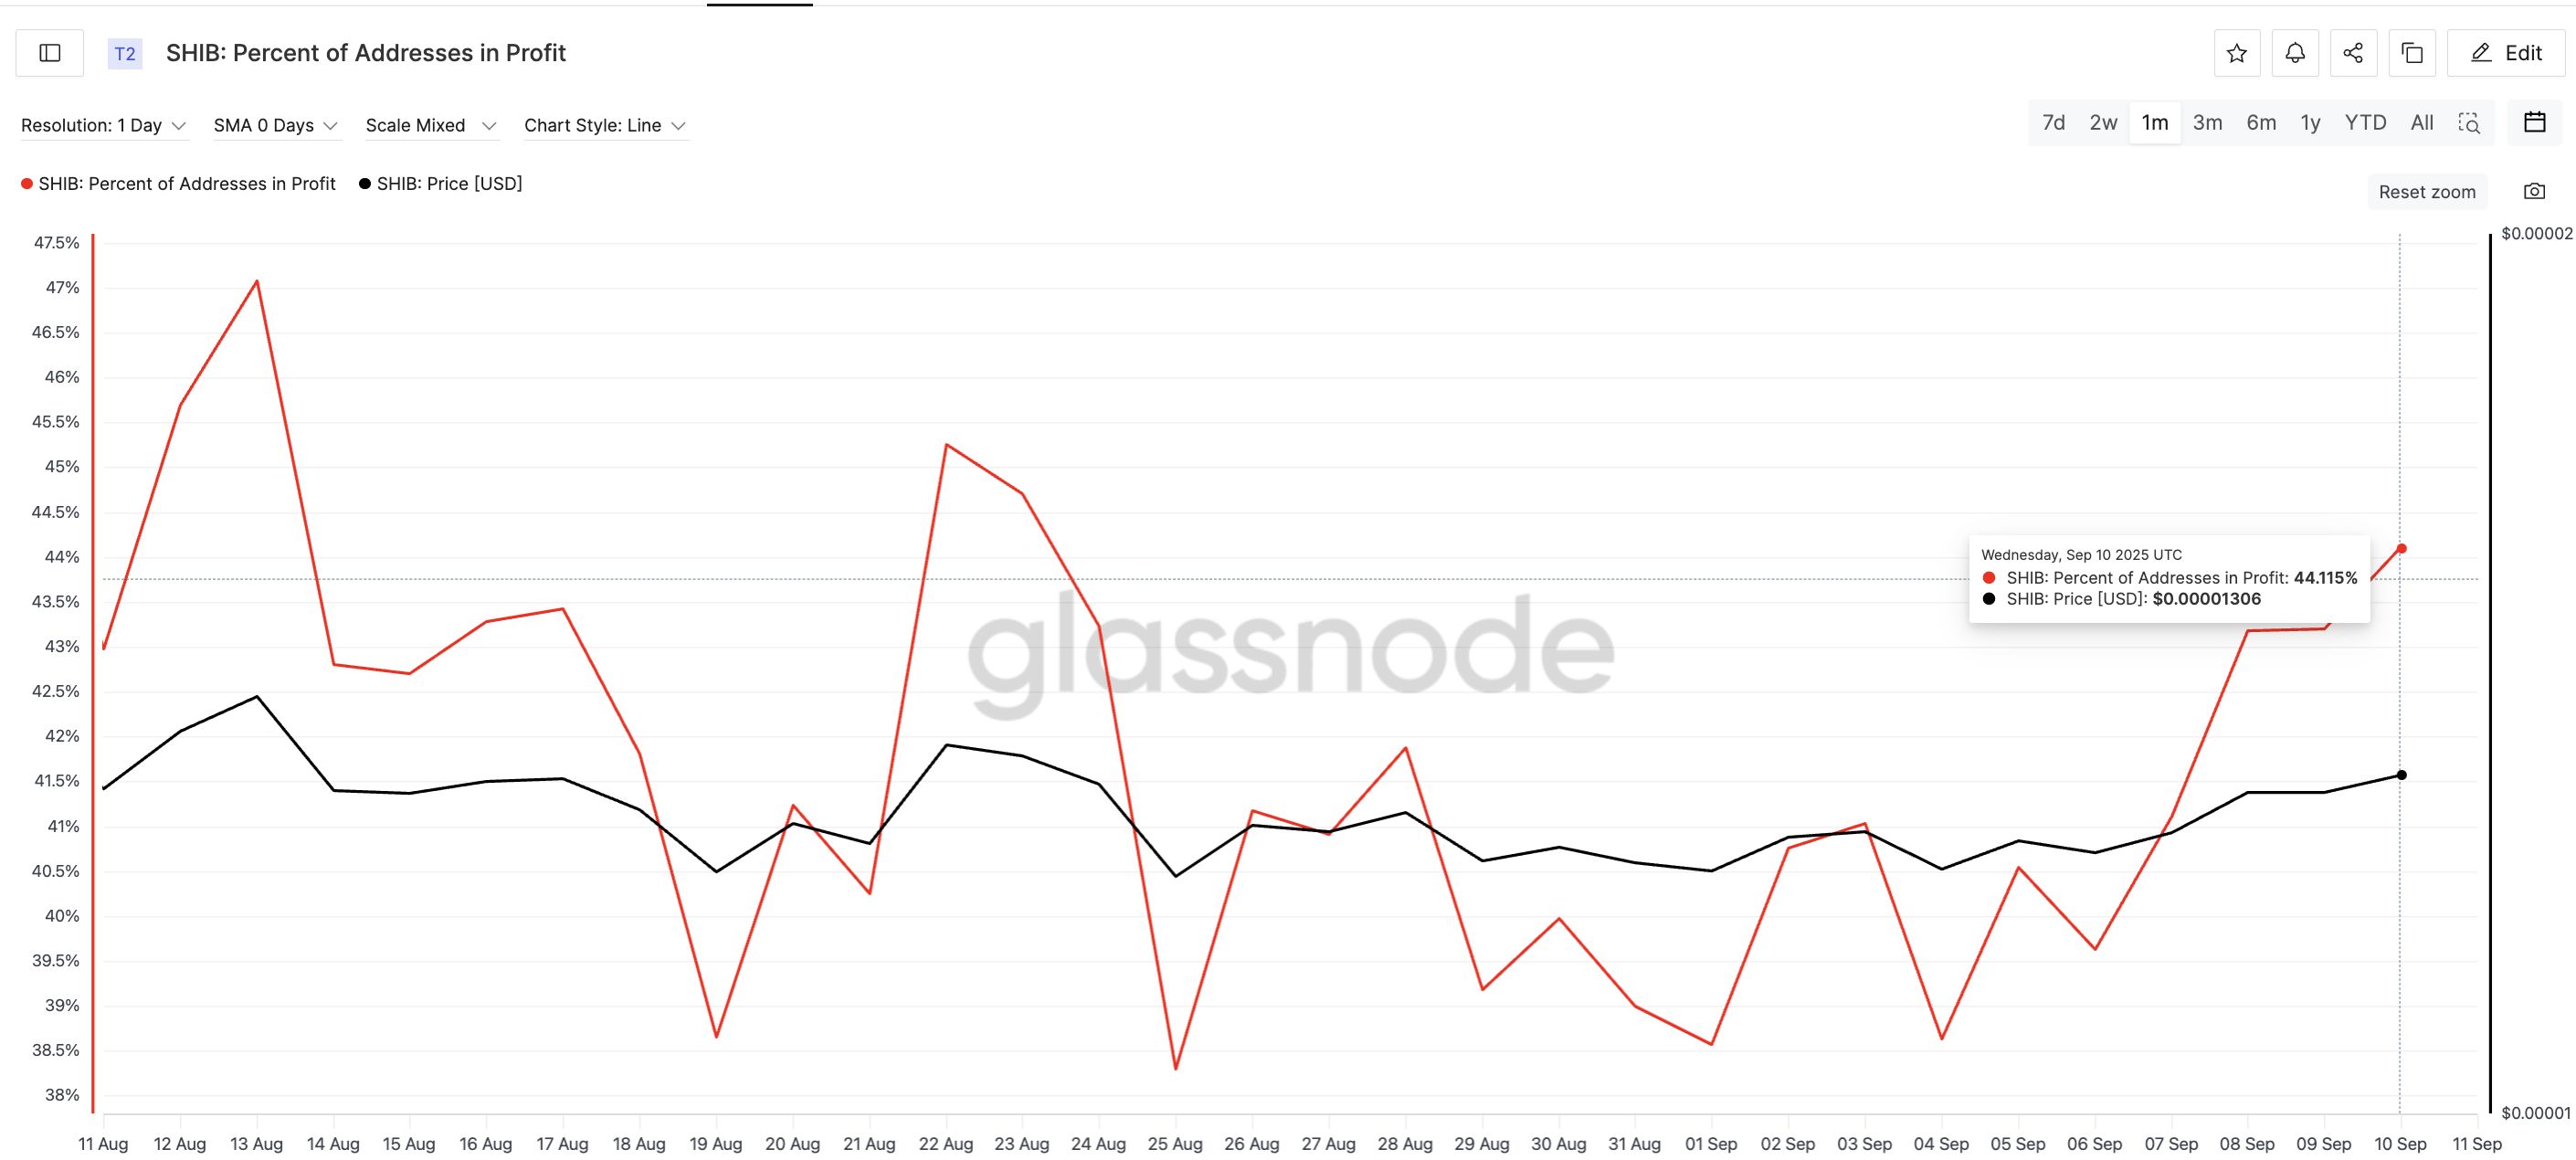
The first bearish sign comes from the percentage of addresses in profit, a key on-chain metric that tracks how many SHIB holders are above water. At the start of September, just 38.57% of addresses were in profit. That figure has since climbed to 44.11%, forming the third-highest local peak in a month.
 Profit Booking Might Hit Shiba Inu Price:
Glassnode
Profit Booking Might Hit Shiba Inu Price:
Glassnode
Earlier peaks have marked short-term tops. On August 13, when 47% of addresses were in profit, SHIB corrected 13%. On August 22, at 45.26%, the SHIB price slipped close to 10%. The latest spike suggests holders may again be preparing to book profits.
Want more token insights like this? Sign up for Editor Harsh Notariya’s Daily Crypto Newsletter.
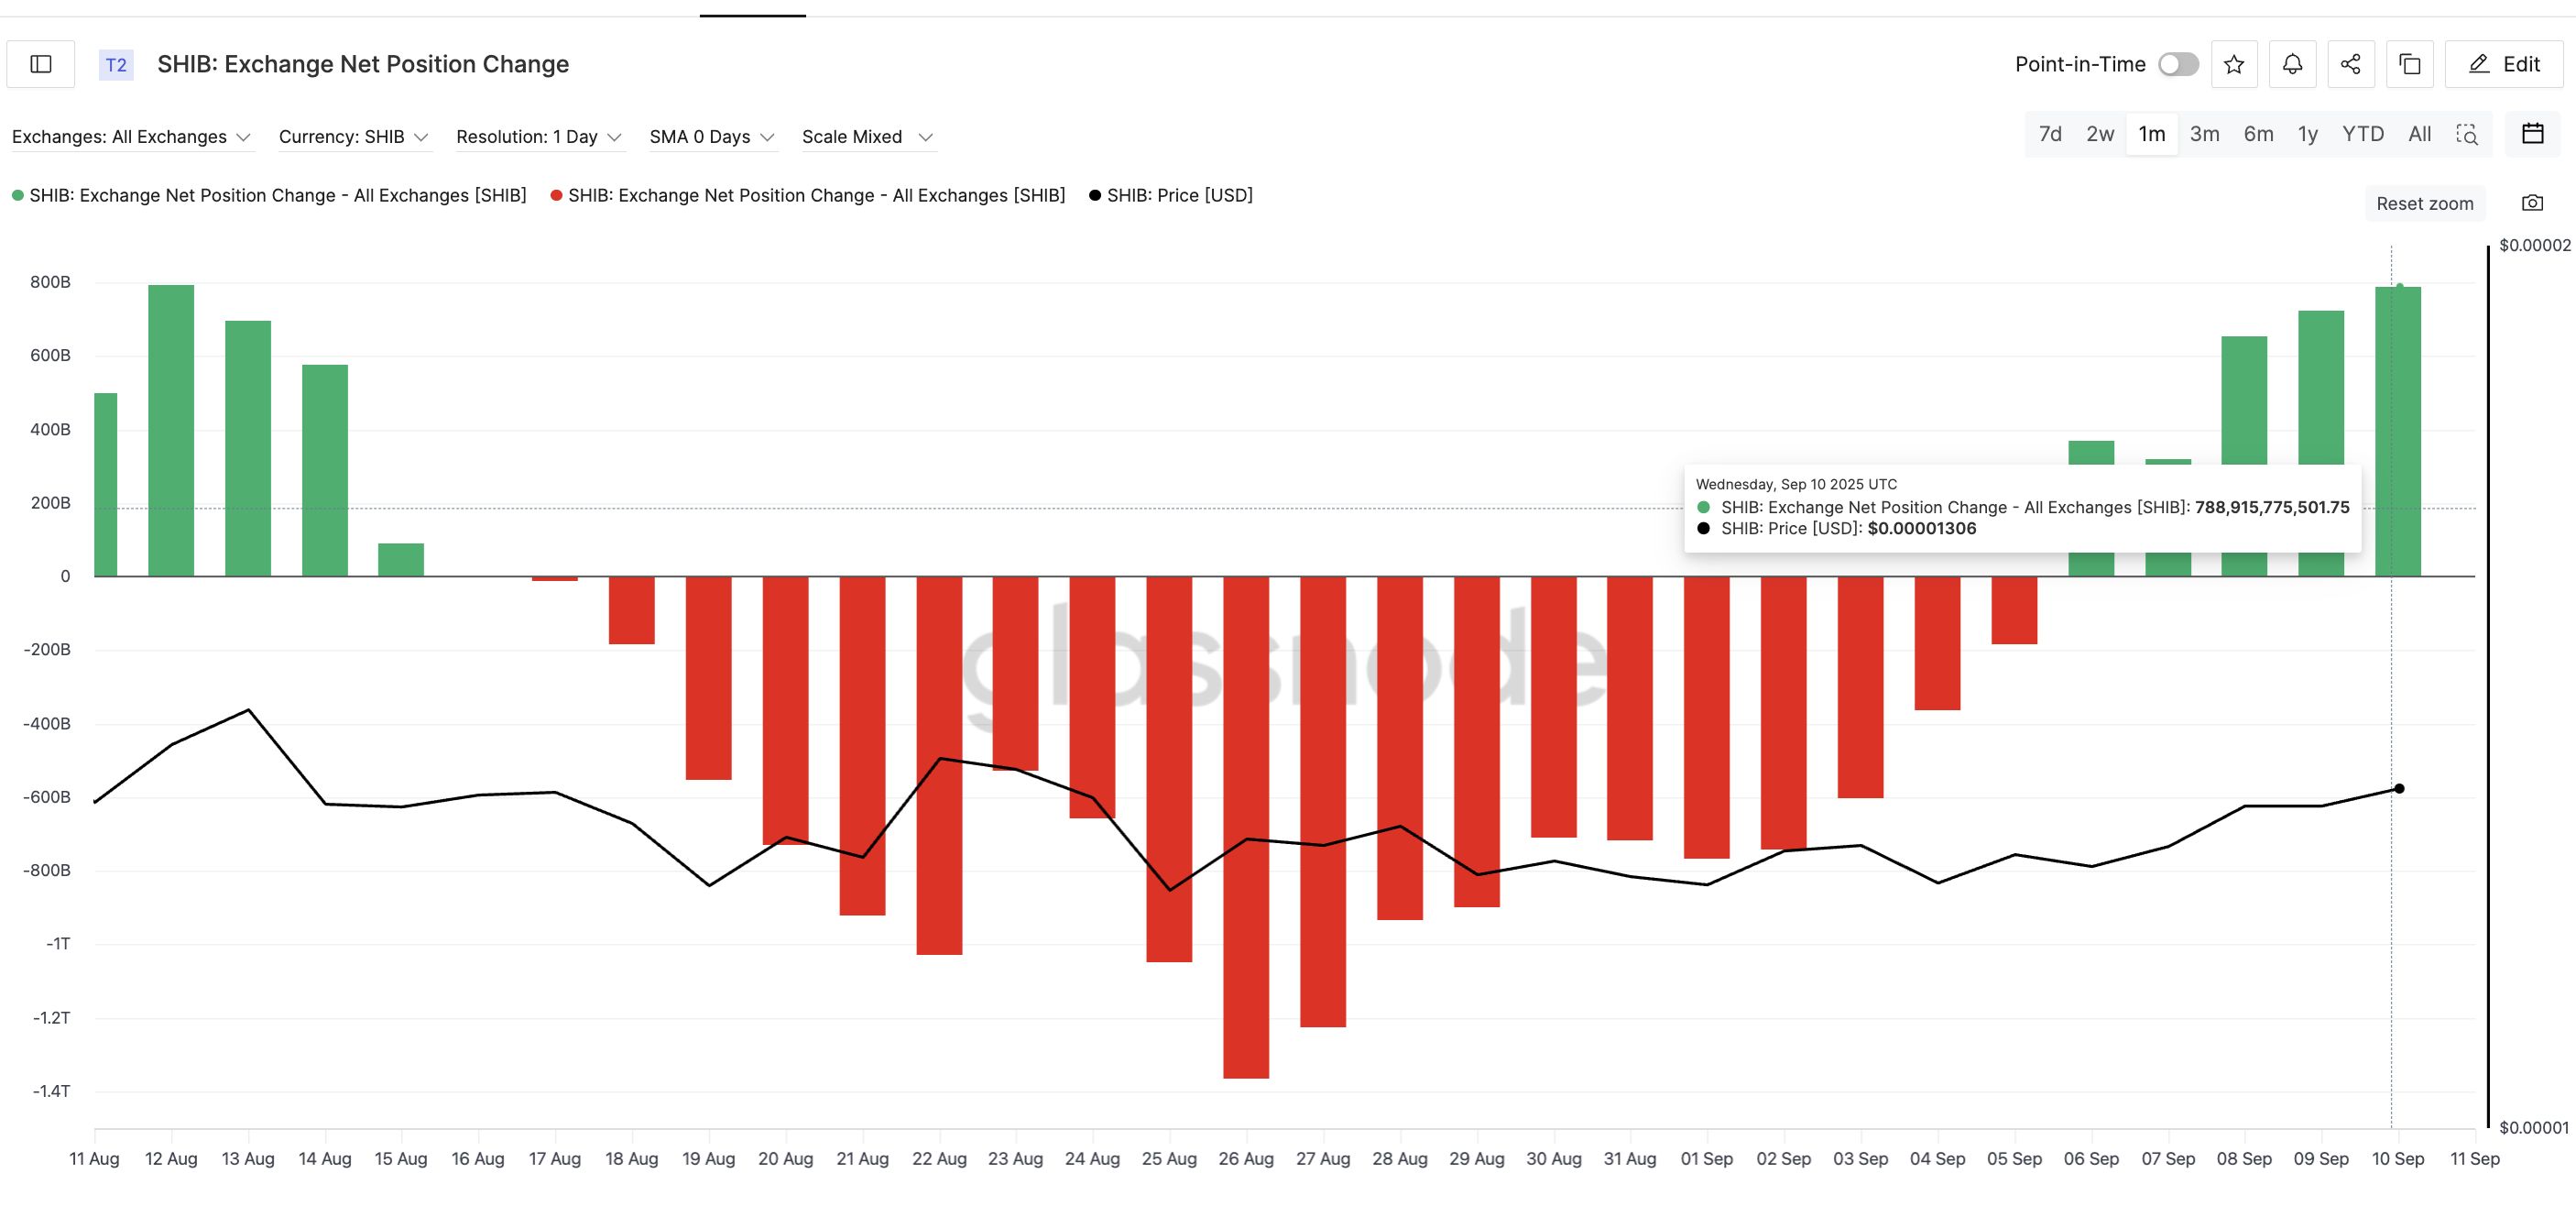
This is already visible in the exchange net position change, which measures how much SHIB is flowing in and out of exchanges. On September 5, net outflows stood at about −836 billion SHIB, showing holders were pulling tokens off exchanges. By September 10, flows flipped sharply to +788.91 billion SHIB.
That’s a 1.62 trillion SHIB swing, now sitting on exchanges and ready to be sold.
 Selling Pressure Weighs Down SHIB:
Glassnode
Selling Pressure Weighs Down SHIB:
Glassnode
Together, these metrics show that profit-taking is not just likely; it has already started. That selling pressure is now creeping into the charts.
Key Shiba Inu Price Levels To Watch
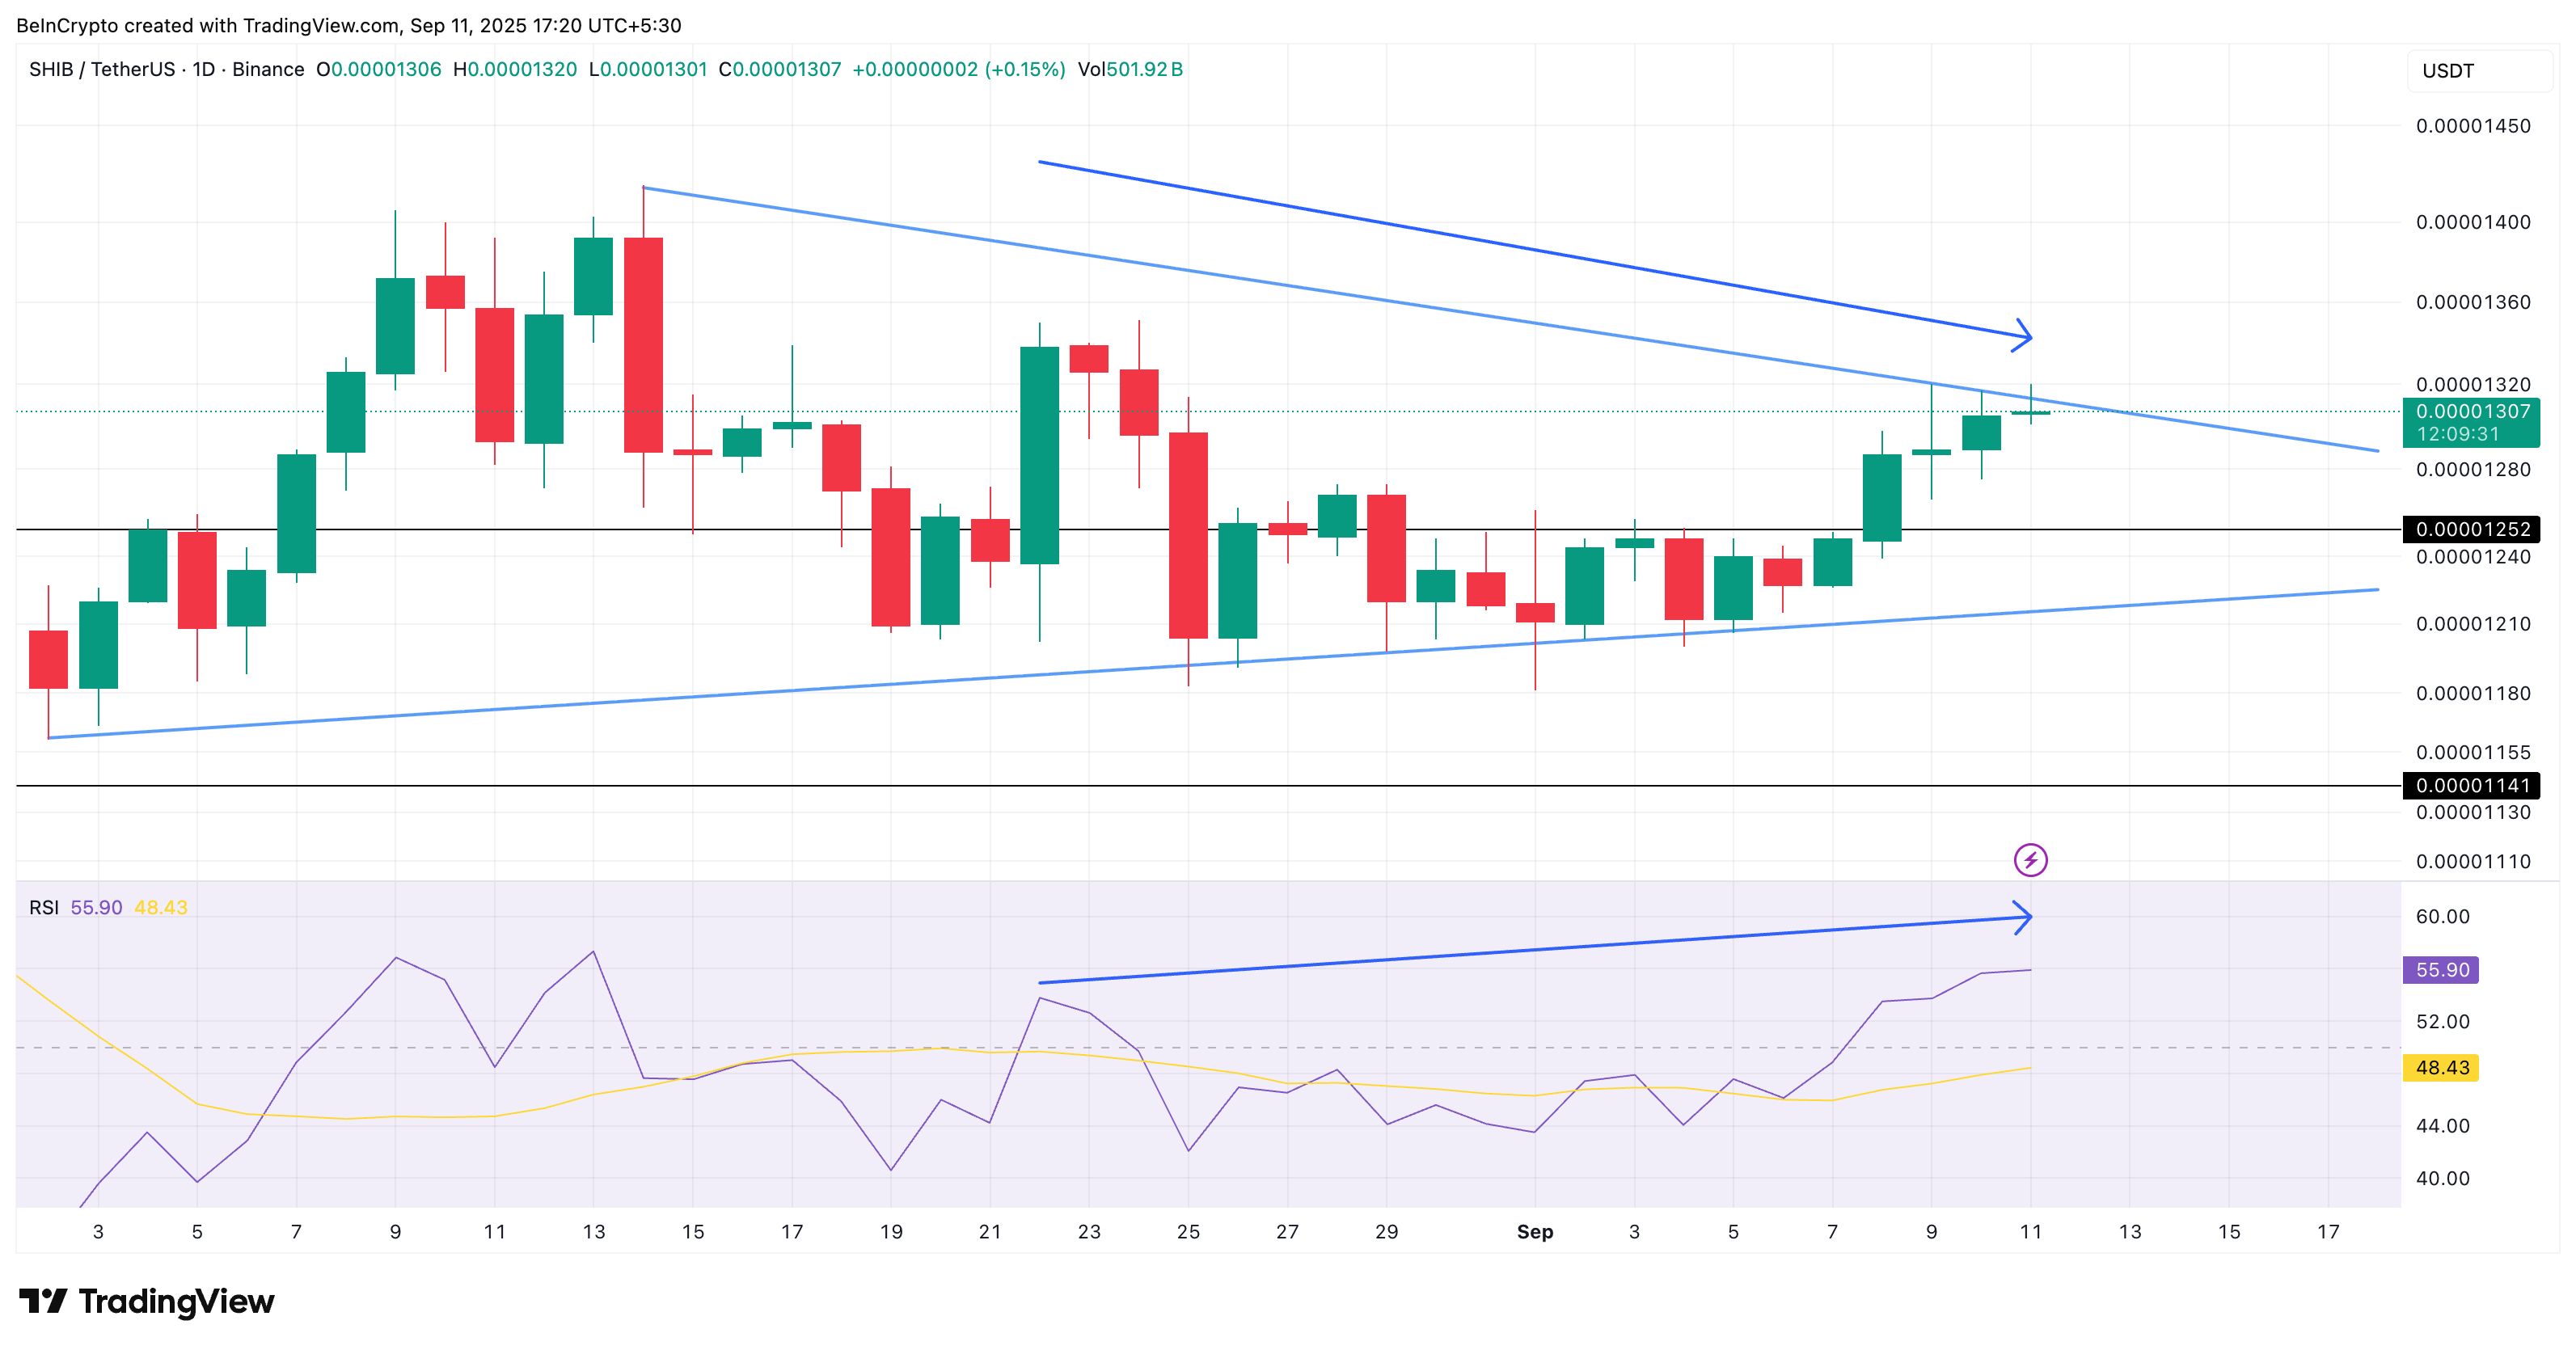
On the daily chart, the Shiba Inu price is trading inside a symmetrical triangle. A close above $0.00001320 may look bullish at first glance, but there are reasons to be cautious.
First, the triangle pattern itself is neutral — it can break either way. That means an upside breakout does not automatically confirm a bullish move unless it’s backed by heavy buying pressure. The on-chain metrics discussed earlier have put those expectations to rest, at least for now.
Secondly, while price is pressing toward resistance, momentum is flashing a hidden bearish divergence. This occurs when price makes a lower high while the Relative Strength Index (RSI) — an indicator that measures the strength of buying and selling momentum — forms a higher high.
 SHIB Pattern And Divergence:
TradingView
SHIB Pattern And Divergence:
TradingView
Hidden bearish divergence usually signals continuation of the broader downtrend (year-on-year -1.35% for SHIB), meaning even if SHIB pokes above resistance, the move could fade quickly.
Zooming out, the key levels become clear.
 Shiba Inu Price Analysis:
TradingView
Shiba Inu Price Analysis:
TradingView
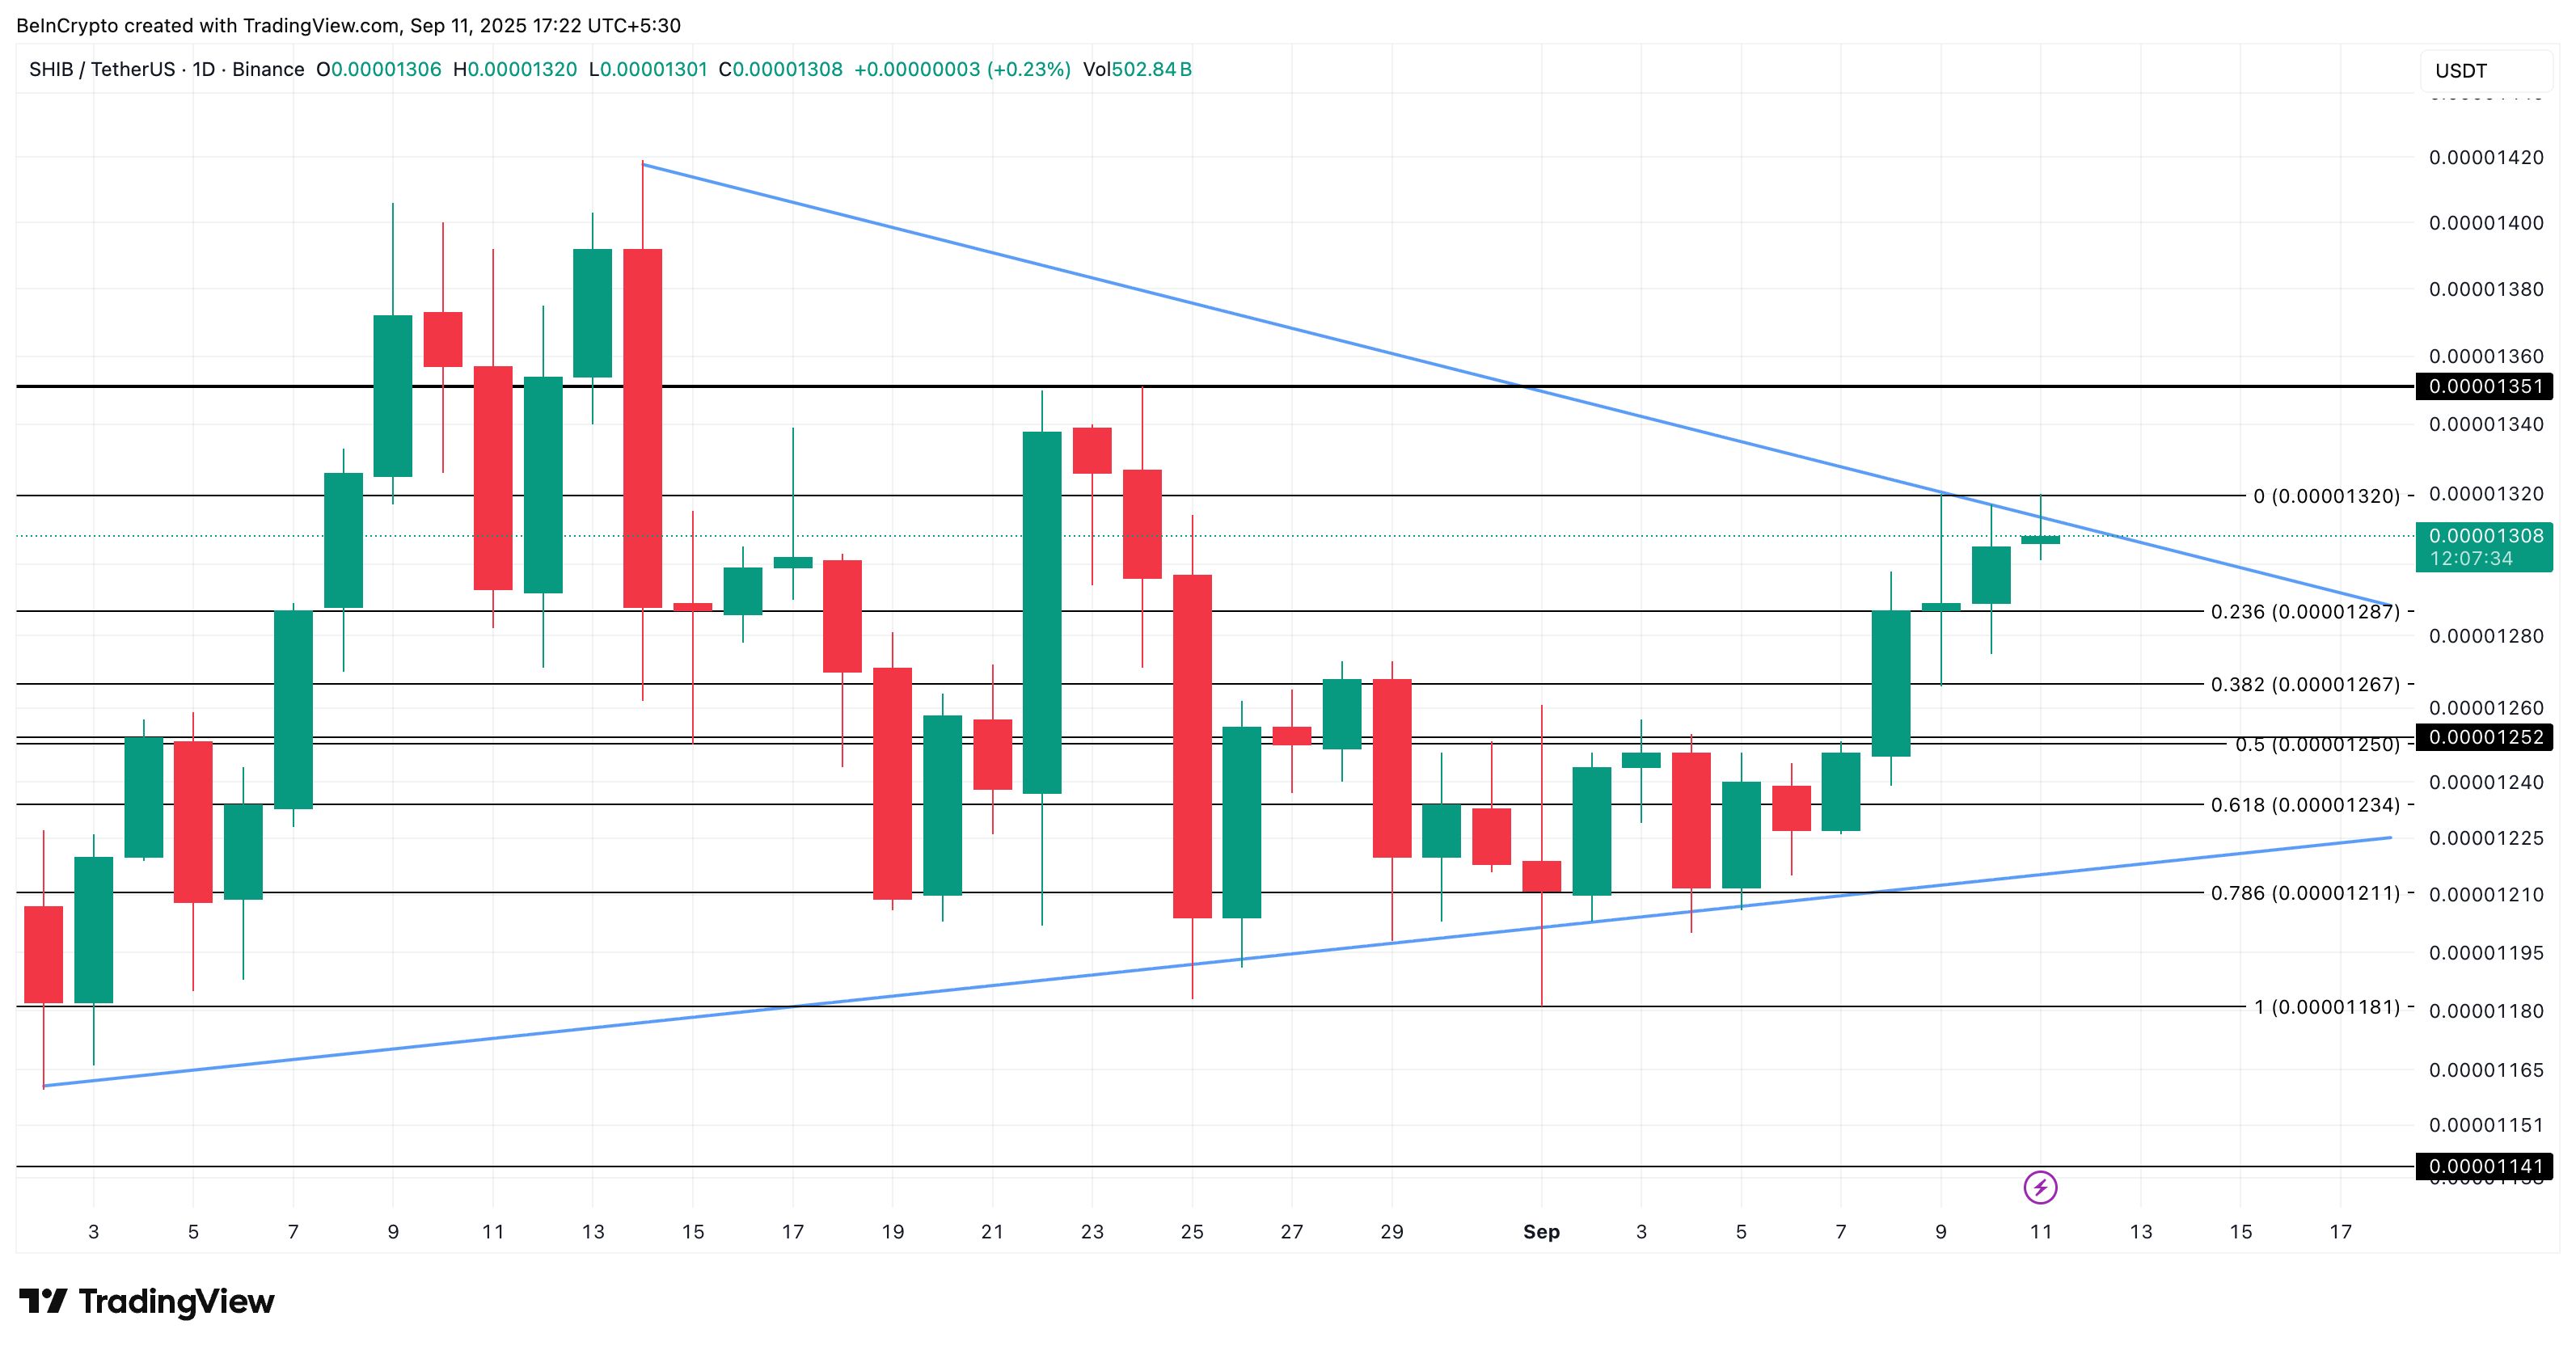
For a breakout to hold weight, SHIB needs more than just a close above $0.00001320. Only a decisive move above $0.00001351 would invalidate the bearish divergence, align price with momentum, and set up a path toward new highs.
Anything less risks becoming a bull trap as the price’s higher low formation would still hold.
If the move stalls, SHIB could retreat to support at $0.00001267. A deeper slide toward $0.00001181 would flip the entire structure bearish and confirm that the breakout attempt had failed.
Disclaimer: The content of this article solely reflects the author's opinion and does not represent the platform in any capacity. This article is not intended to serve as a reference for making investment decisions.
You may also like
Hong Kong’s HKMA Launches Fintech 2030 to Drive Future Financial Innovation

Balancer DeFi Hack: $70.9M in Crypto Stolen
DeFi protocol Balancer suffers a major exploit with $70.9M in crypto drained. Team yet to respond.Funds Moved to New WalletWhat’s Next for Balancer and DeFi Security?

Dogecoin Price Prediction Targets November Surge, While BullZilla Steals the Spotlight Among Best Meme Coin Presales in 2025
BullZilla and Dogecoin battle for investor attention among the best meme coin presales in 2025 as BullZilla’s presale explodes and Dogecoin eyes a recovery from recent declines.Dogecoin Price Prediction: A Chance for a Strong ComebackBullZilla: Exploding Ahead in the Best Meme Coin Presales in 2025Conclusion
Bitcoin Dips as Whale Sales Trigger $414M in Liquidations
Crypto markets dip as whales sell $2B in BTC, leading to $414M in liquidations amid rising geopolitical risks.Liquidations Top $414M as Sentiment Turns FearfulMarket Cap Falls Amid Uncertainty