
Is HBAR’s Weekly Bounce Foreshadowing a 40% Price Rally? 3 Factors Say Yes

HBAR price trades near $0.236 as whales add millions and RSI confirms strength. A falling wedge breakout could send the token 40% higher if key levels hold.
HBAR price trades around $0.236 at press time on September 11, up 10.6% in the past seven days. The token is still down 3.7% on the month, but broader gains of 53% in three months keep its trend positive.
Over the past week, multiple bullish signals have surfaced, whale activity being one of them. When combined with a key momentum pattern and a broader chart breakout, these signs suggest that HBAR could be preparing for a rally of close to 40%.
Whales Step In As RSI Setup Confirms Strength
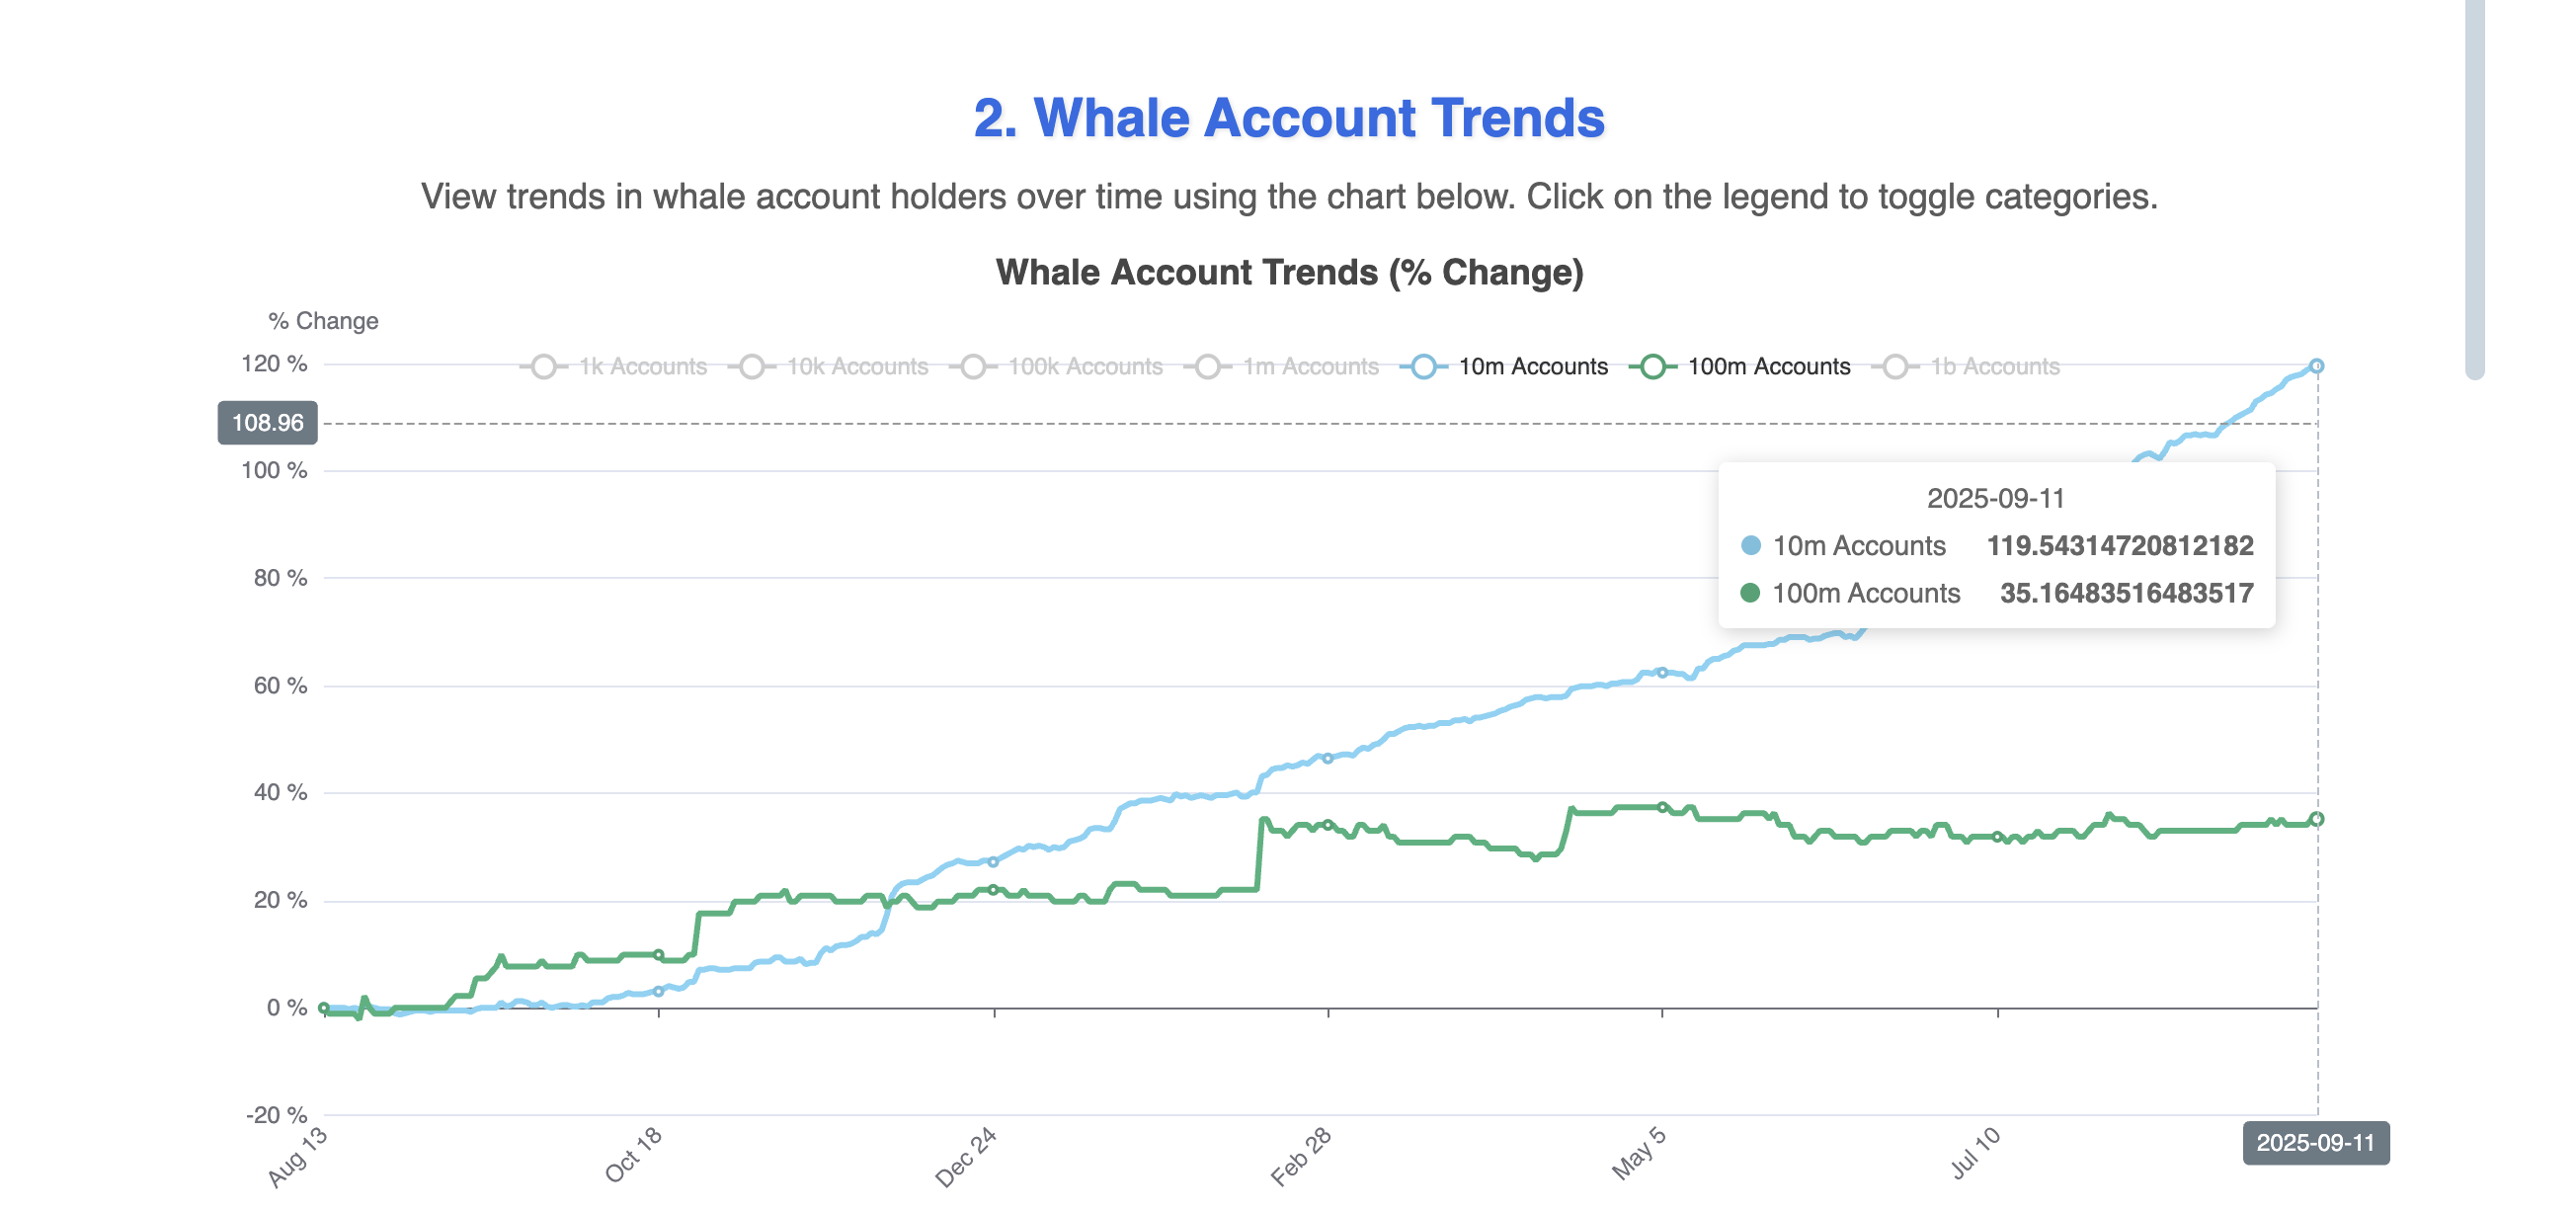
Whale activity has been notable since the start of the week. Between September 6 and September 11, the number of accounts holding more than 10 million HBAR rose from 117.76 to 119.54.
 HBAR Whales: Source:
HBAR Whales
HBAR Whales: Source:
HBAR Whales
At a minimum, that means this group added at least 18 million tokens. During the same period, the number of accounts with 100 million or more HBAR increased from 34.06 to 35.16, representing an addition of at least 110 million tokens. Together, whales absorbed at least 128 million HBAR, worth over $30 million in less than a week, signaling confidence in higher prices ahead.
Want more token insights like this? Sign up for Editor Harsh Notariya’s Daily Crypto Newsletter here.
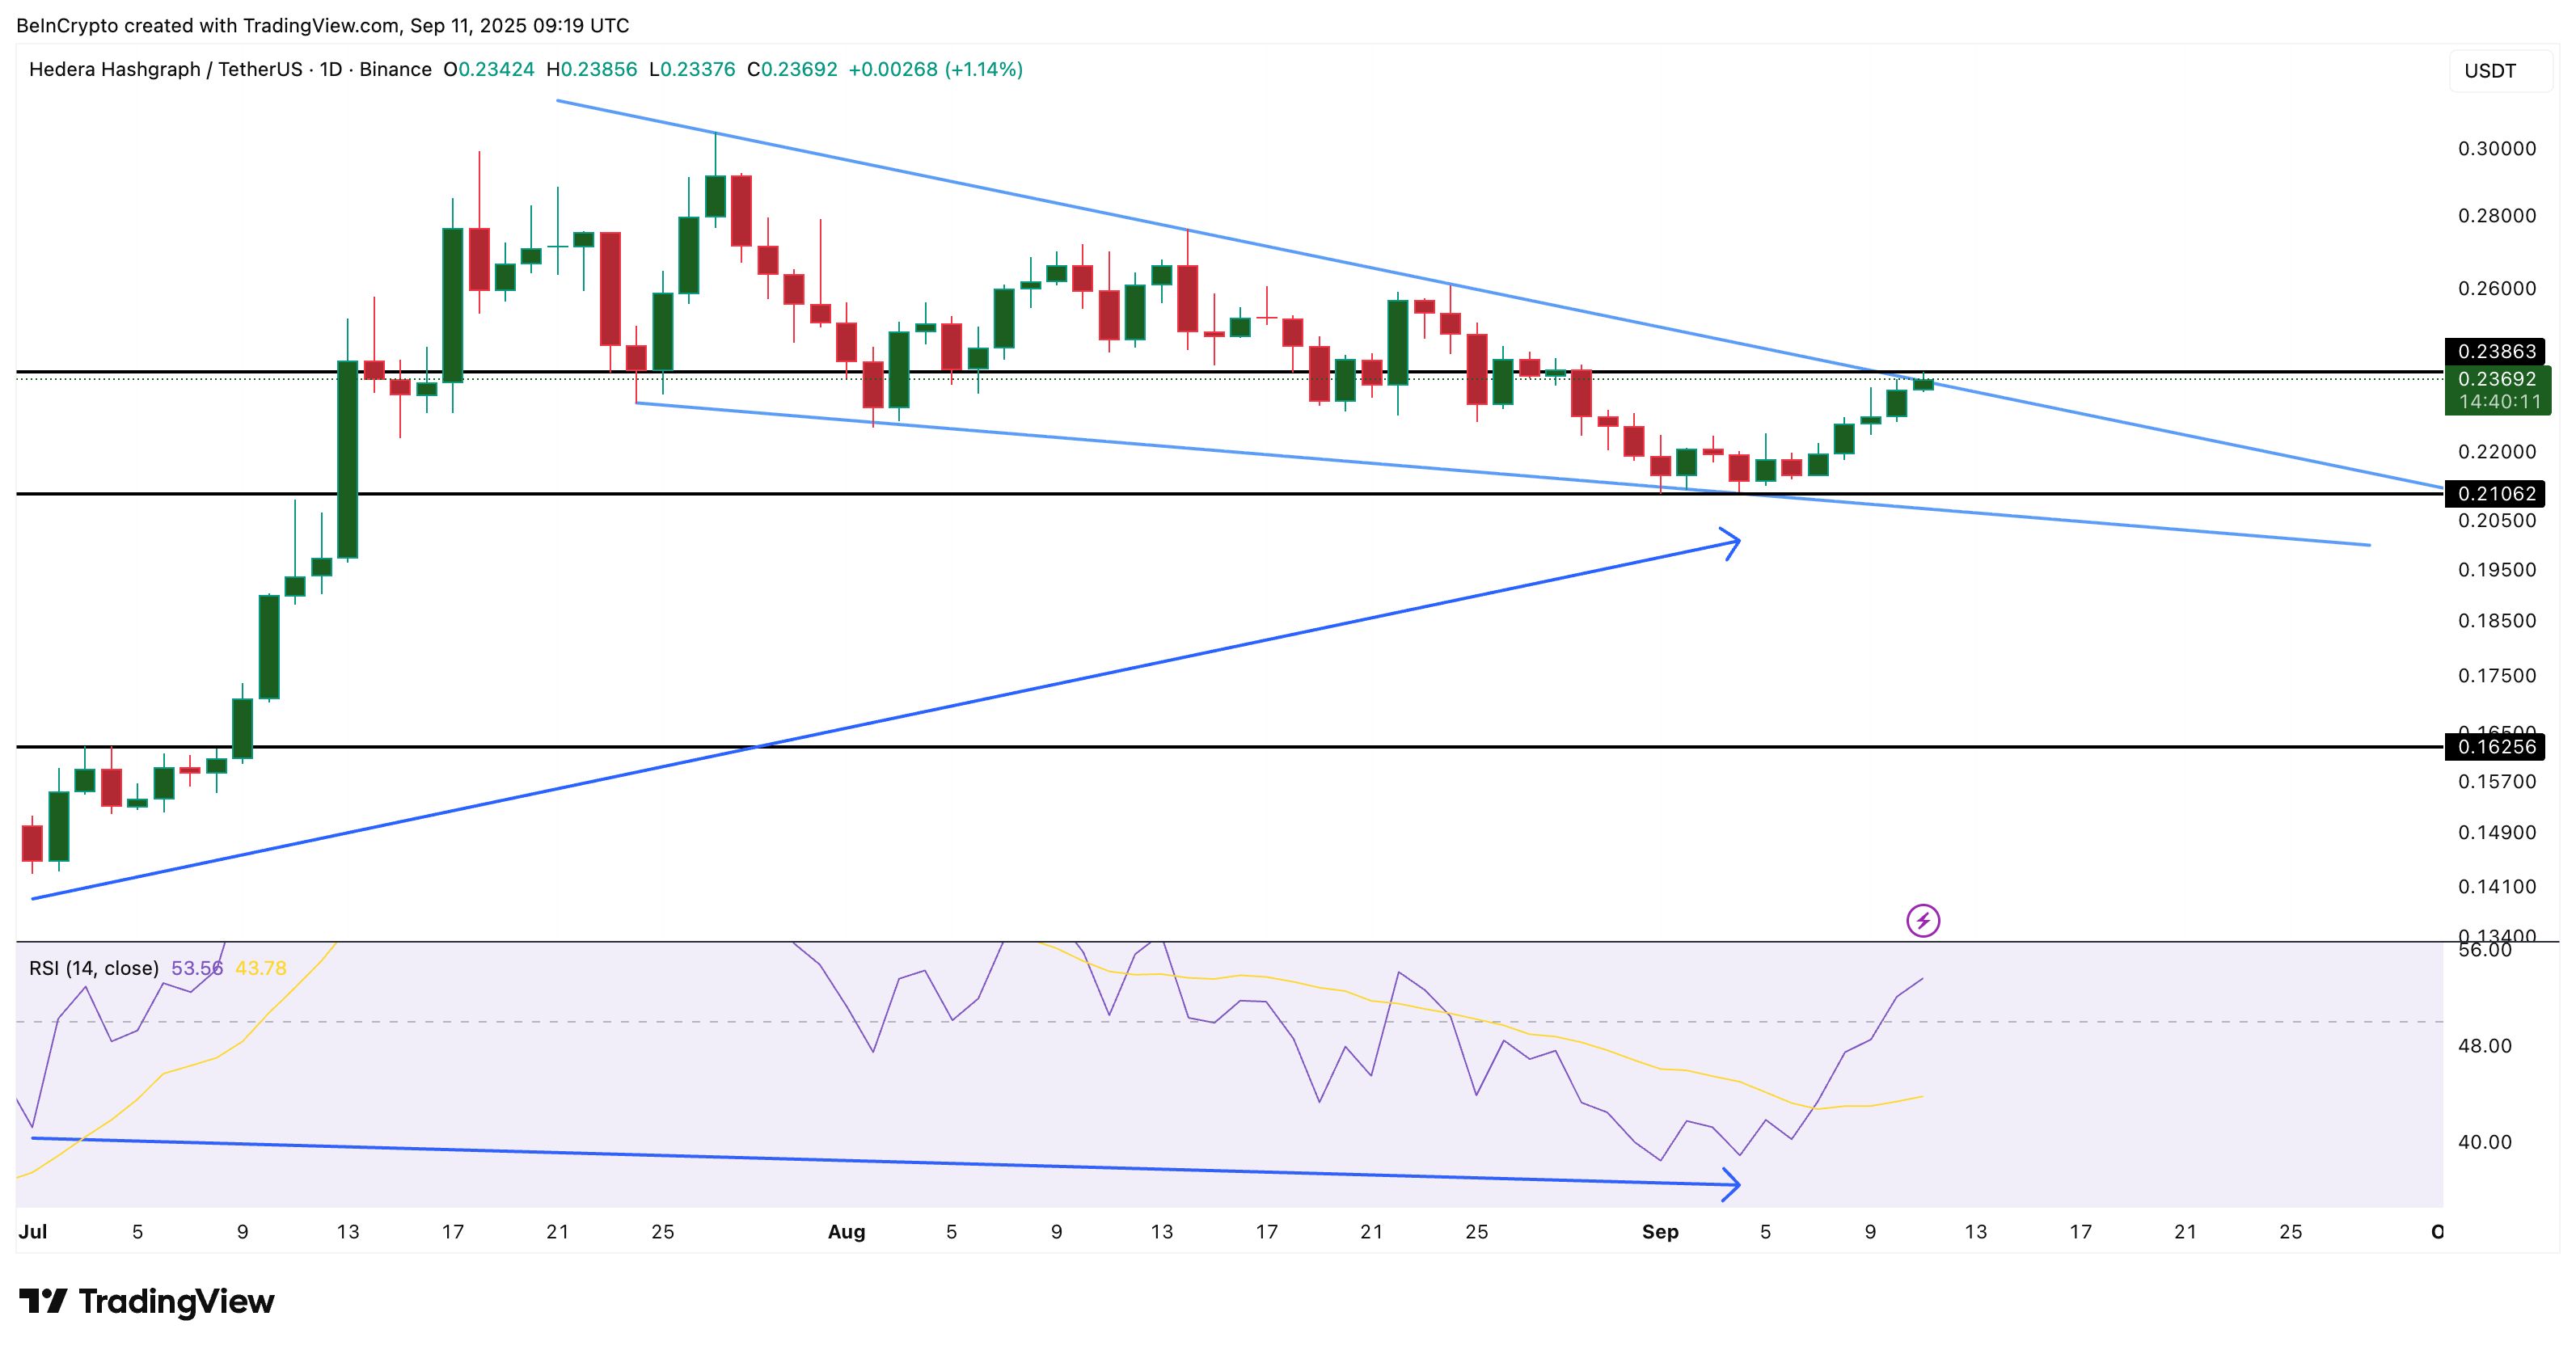
This accumulation aligned with a critical move on the Relative Strength Index (RSI). The RSI tracks buying and selling momentum, with higher readings showing stronger upward pressure.
Since July, the RSI had been making lower lows while HBAR’s price was making higher lows. This is called a hidden bullish divergence, and it often signals that the broader uptrend may continue. On September 4–5, that setup was finally confirmed as RSI turned upward with a price bounce, and soon after, the whales began adding heavily to their holdings.
 HBAR Price Pattern:
HBAR Price Pattern
HBAR Price Pattern:
HBAR Price Pattern
The combined effect pushed HBAR toward the upper boundary of a falling wedge pattern. Falling wedges happen when prices form lower highs and lower lows inside narrowing lines, and they usually end with an upward breakout.
For this momentum to be confirmed, HBAR needs a daily close above $0.238. That would mark the first signal that buyers are strong enough to take control of the trend. But more on this in our next section.
HBAR Price Pattern Points To 40% Rally, If Breakout Holds
Building from the RSI setup, the HBAR price chart itself shows why analysts are eyeing a much larger move. The falling wedge now in focus suggests that a breakout could trigger significant upside.
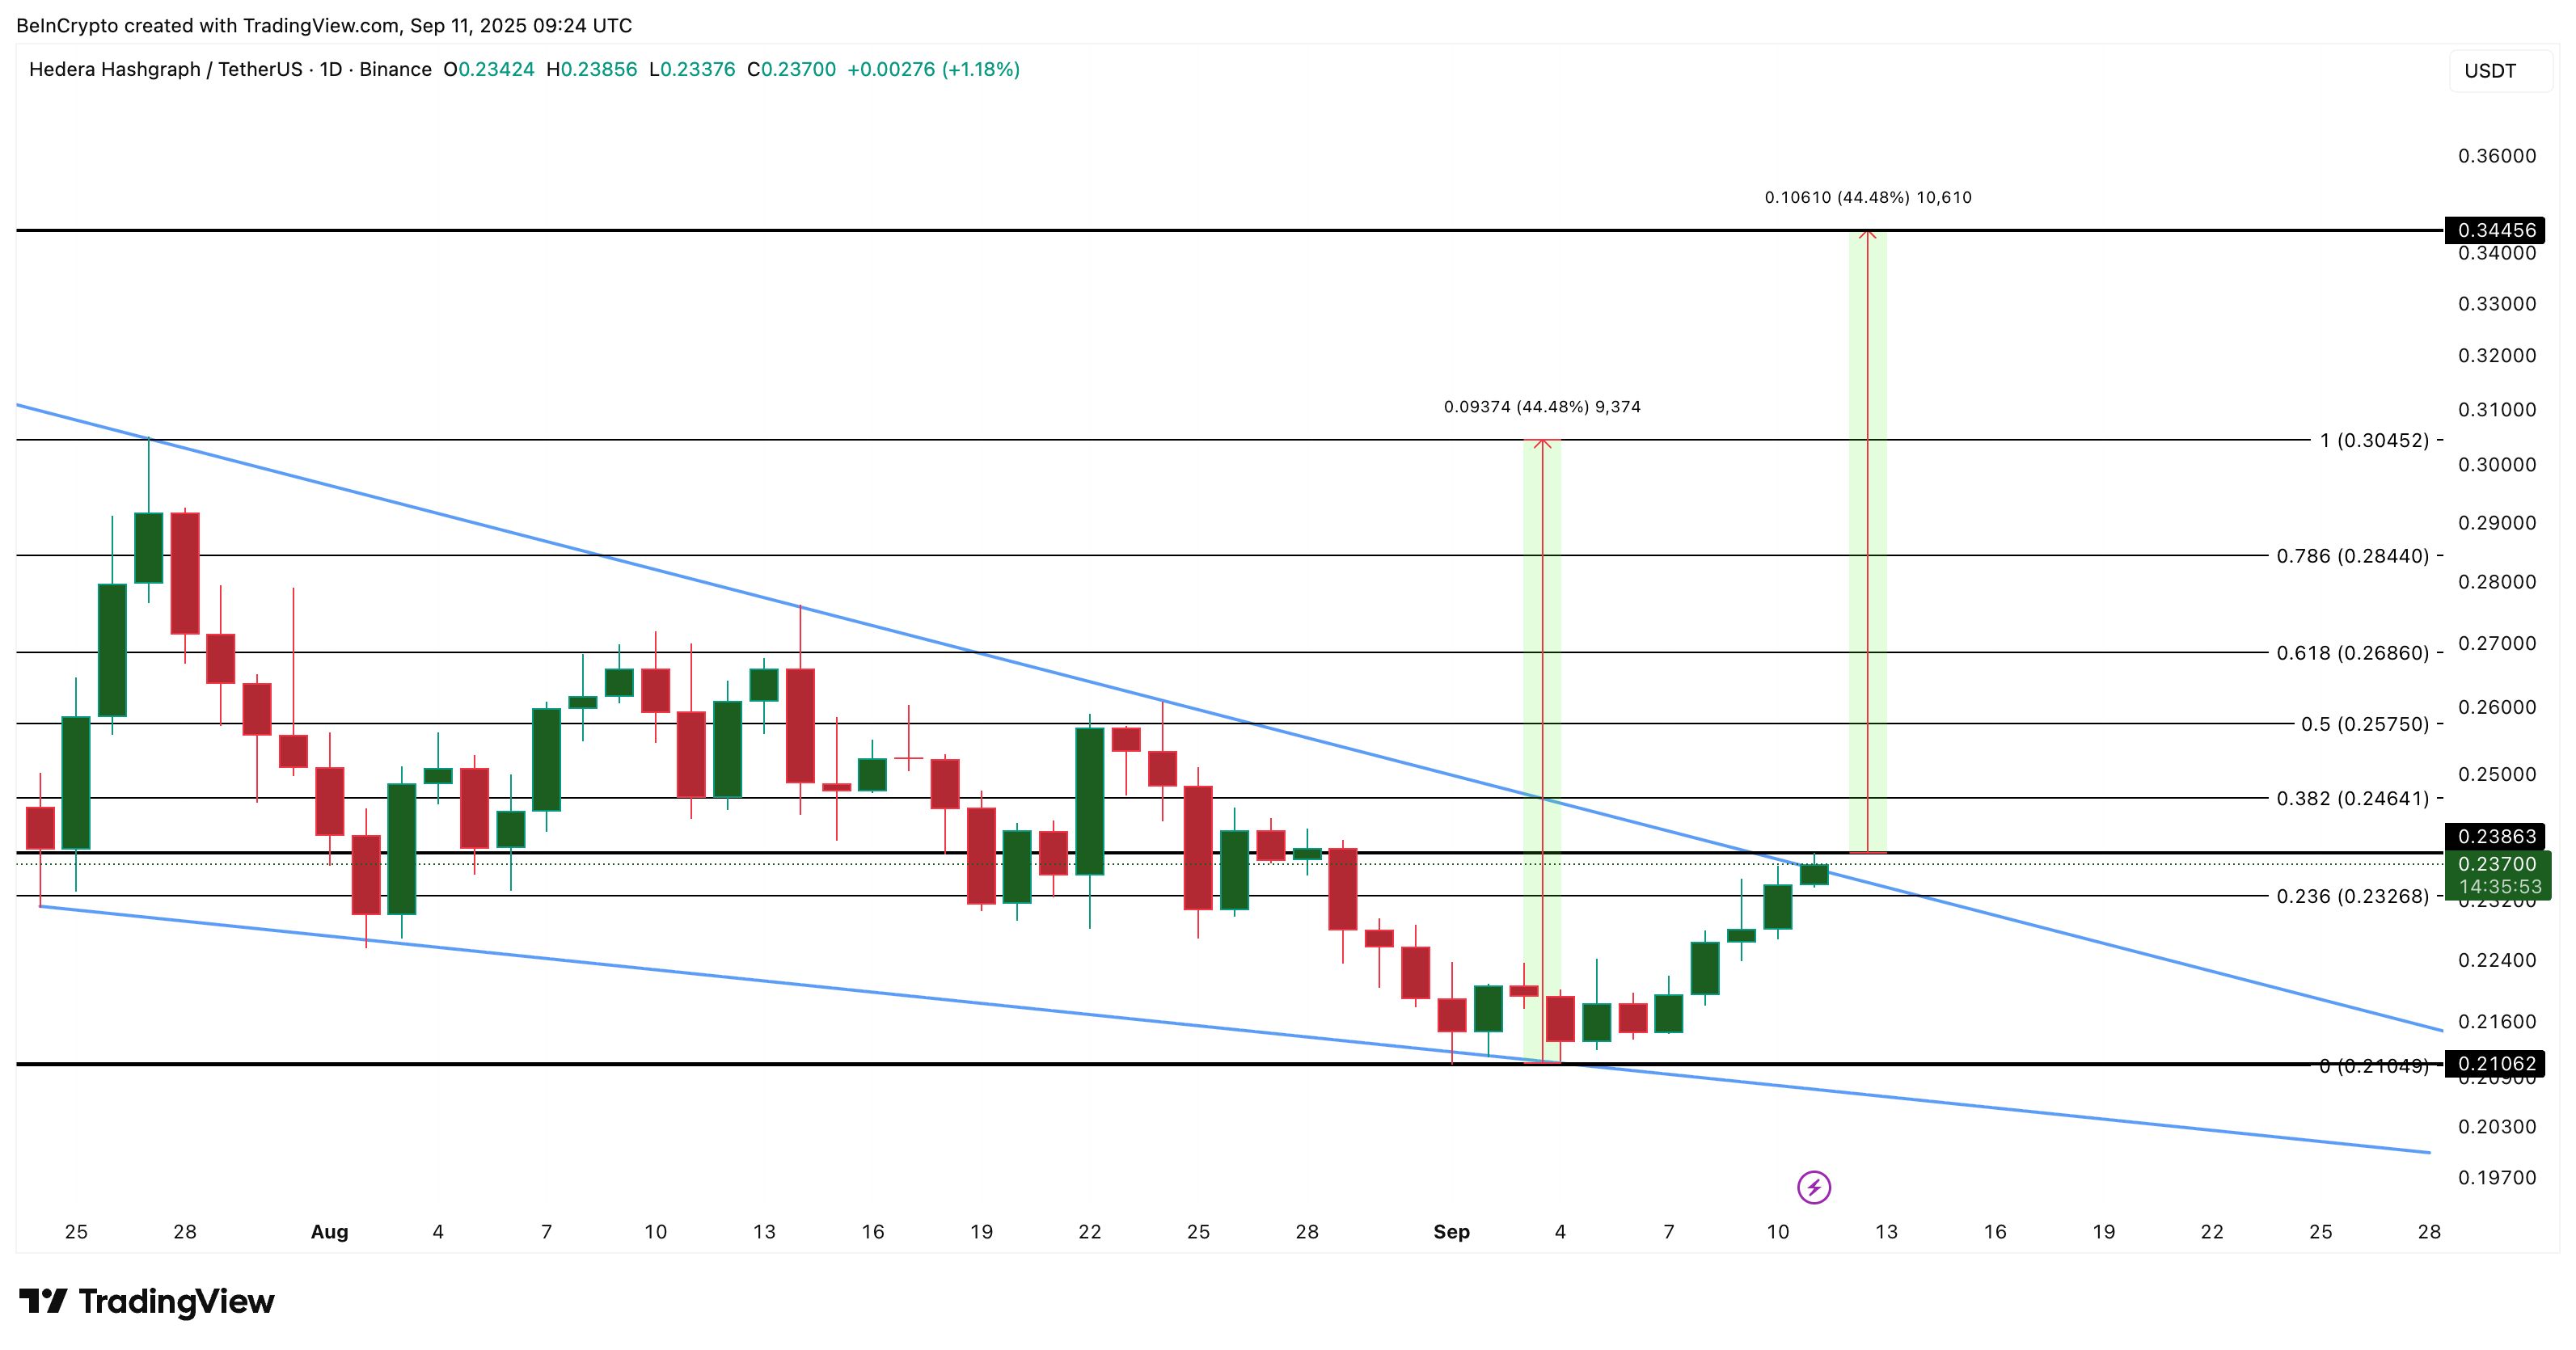
The target for this move is measured by taking the vertical distance between the wedge’s highest point and its lowest point (while still inside the wedge) and projecting that distance upward from the breakout zone. In HBAR’s case, this points to a target near $0.344, which would mean about a 40% rally from the breakout level.
 HBAR Price Analysis:
HBAR Price Analysis
HBAR Price Analysis:
HBAR Price Analysis
For this path to hold, key levels must be crossed in sequence. The first key resistance sits near $0.246, provided the breakout above $0.238 confirms. Beyond that, $0.268 and $0.304 (a swing high) become critical checkpoints. Breaking through these would open the door to the full measured move toward $0.344.
On the flip side, traders will also watch for signals of failure. If the HBAR price falls below $0.232, the current bullish structure would weaken. A deeper drop under $0.210 would invalidate the wedge setup altogether, shifting the outlook back toward caution.
Disclaimer: The content of this article solely reflects the author's opinion and does not represent the platform in any capacity. This article is not intended to serve as a reference for making investment decisions.
You may also like
Trend Research: The "Blockchain Revolution" is underway, remaining bullish on Ethereum
In a scenario of extreme fear, where capital and sentiment have not yet fully recovered, ETH is still in a relatively good buying "strike zone."
Should You Still Believe in Crypto
No industry has always been right along the way, until it truly changes the world.

Gavin Wood: After EVM, JAM will become the new industry consensus!

You Should Also Believe in <strong>Crypto</strong>
No industry has ever been right all the way until it truly changed the world