
Solana’s Breakout Push Gets Backing From Two Strong Forces — What’s Next for Price?

Solana price trades near $235 after strong weekly gains. With both whales and smart money stepping in, the token eyes a breakout — but confirmation is still needed.
Solana trades around $235 at press time on September 12, up more than 4% in the last 24 hours. Weekly gains stand at about 15%, while the past month shows an 18% increase. Over the past three months, the Solana price has climbed by over 55%.
In recent weeks, rallies often faced selling pressure as profit-takers booked gains quickly. While this risk still exists, two powerful market groups are now adding support. Together, their actions suggest the bullish structure is getting stronger.
Whales Pick Up, Exchange Flows Confirm Strength
The relative address supply distribution metric, which tracks the amount of supply held by wallets of different sizes, indicates that holders with more than 100,000 SOL (whales and sharks) have resumed accumulating. Since August 19, their holdings rose from 57.81% to 58.95% of the total circulating supply.
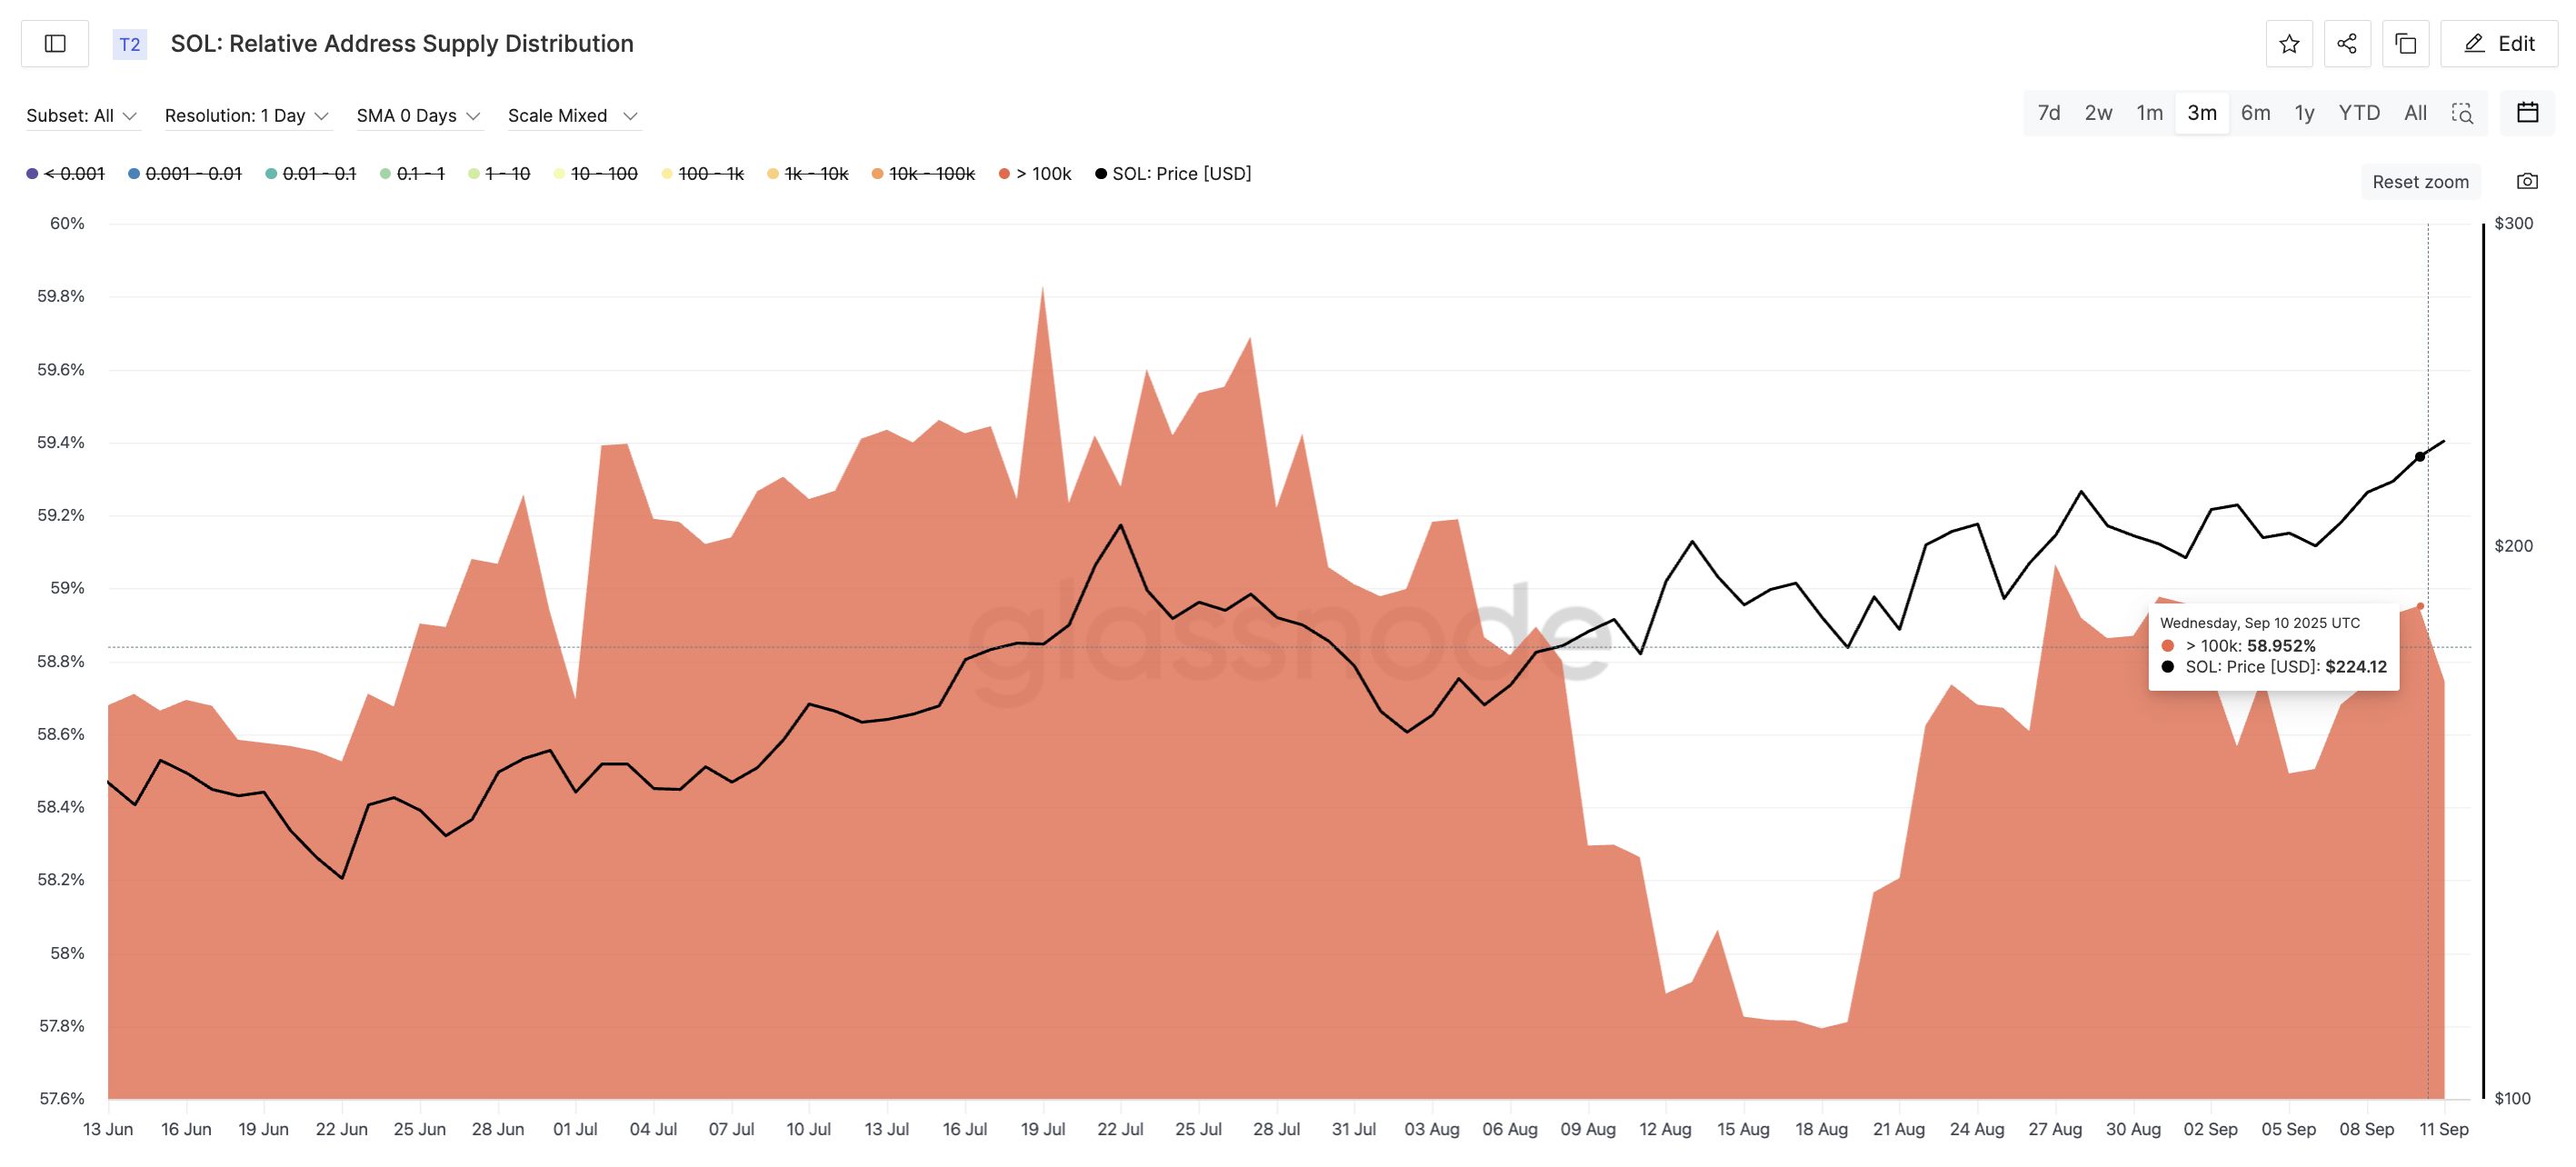 Solana Whales Have Started Adding To Their Stash:
Glassnode
Solana Whales Have Started Adding To Their Stash:
Glassnode
History shows why this matters. On July 1, when Solana traded near $146, these whales held 58.69%. They increased that position to 59.83% while Solana climbed to $205 — a gain of nearly 40%. Their decision to add again while Solana trades above $230 suggests they expect further upside.
Want more token insights like this? Sign up for Editor Harsh Notariya’s Daily Crypto Newsletter.
This activity is also reflected in the exchange net position change metric. On September 10, while Solana was rising, almost 291,000 SOL flowed into exchanges. Normally, such inflows signal profit-taking. However, just one day later, as Solana crossed $227 (a key level from the price chart later), the balance shifted sharply negative, indicating outflows of 1.77 million SOL.
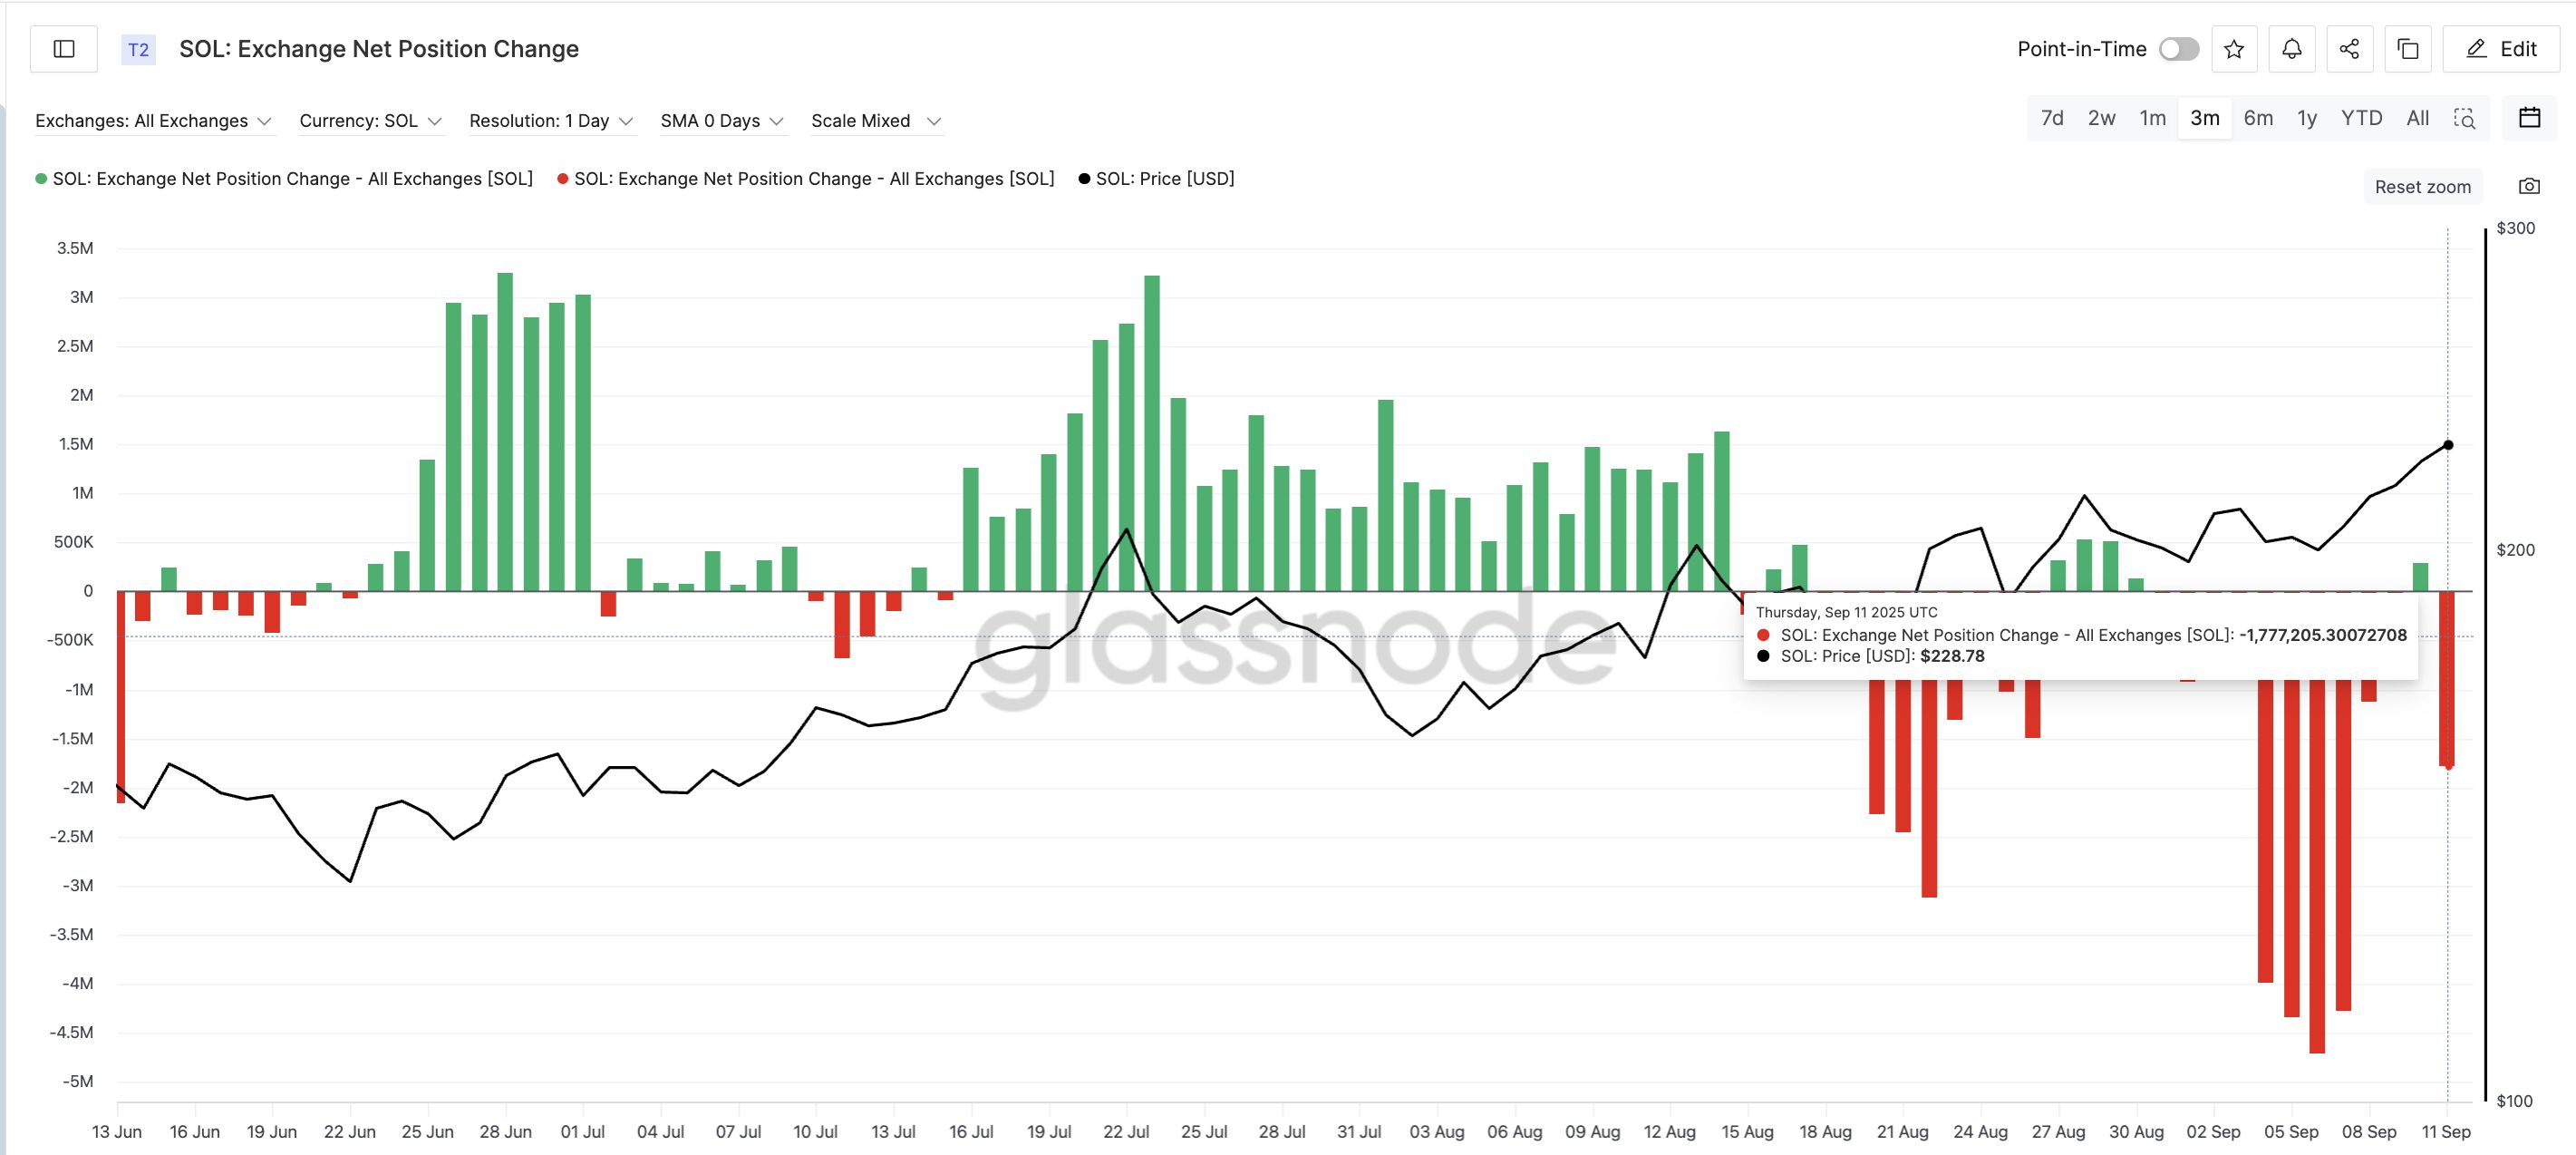 Solana Price And The Return Of Buying Pressure:
Glassnode
Solana Price And The Return Of Buying Pressure:
Glassnode
This is unusual compared to recent weeks, where traders sold rallies quickly. The shift suggests holders are moving tokens away from exchanges, reducing immediate selling pressure. Although the three-month average of both these metrics is not yet at prior peaks, the trend is closing in; another signal that momentum could be building.
Smart Money Bets On Breakout As Key Solana Price Levels Form
Alongside the whales, the Smart Money Index, which tracks activity from high-conviction addresses, has surged from 261.62 on September 7 to 290.14 today. These wallets often buy into strength and sell quickly into rallies. Their rising activity signals bets on a continued price surge.
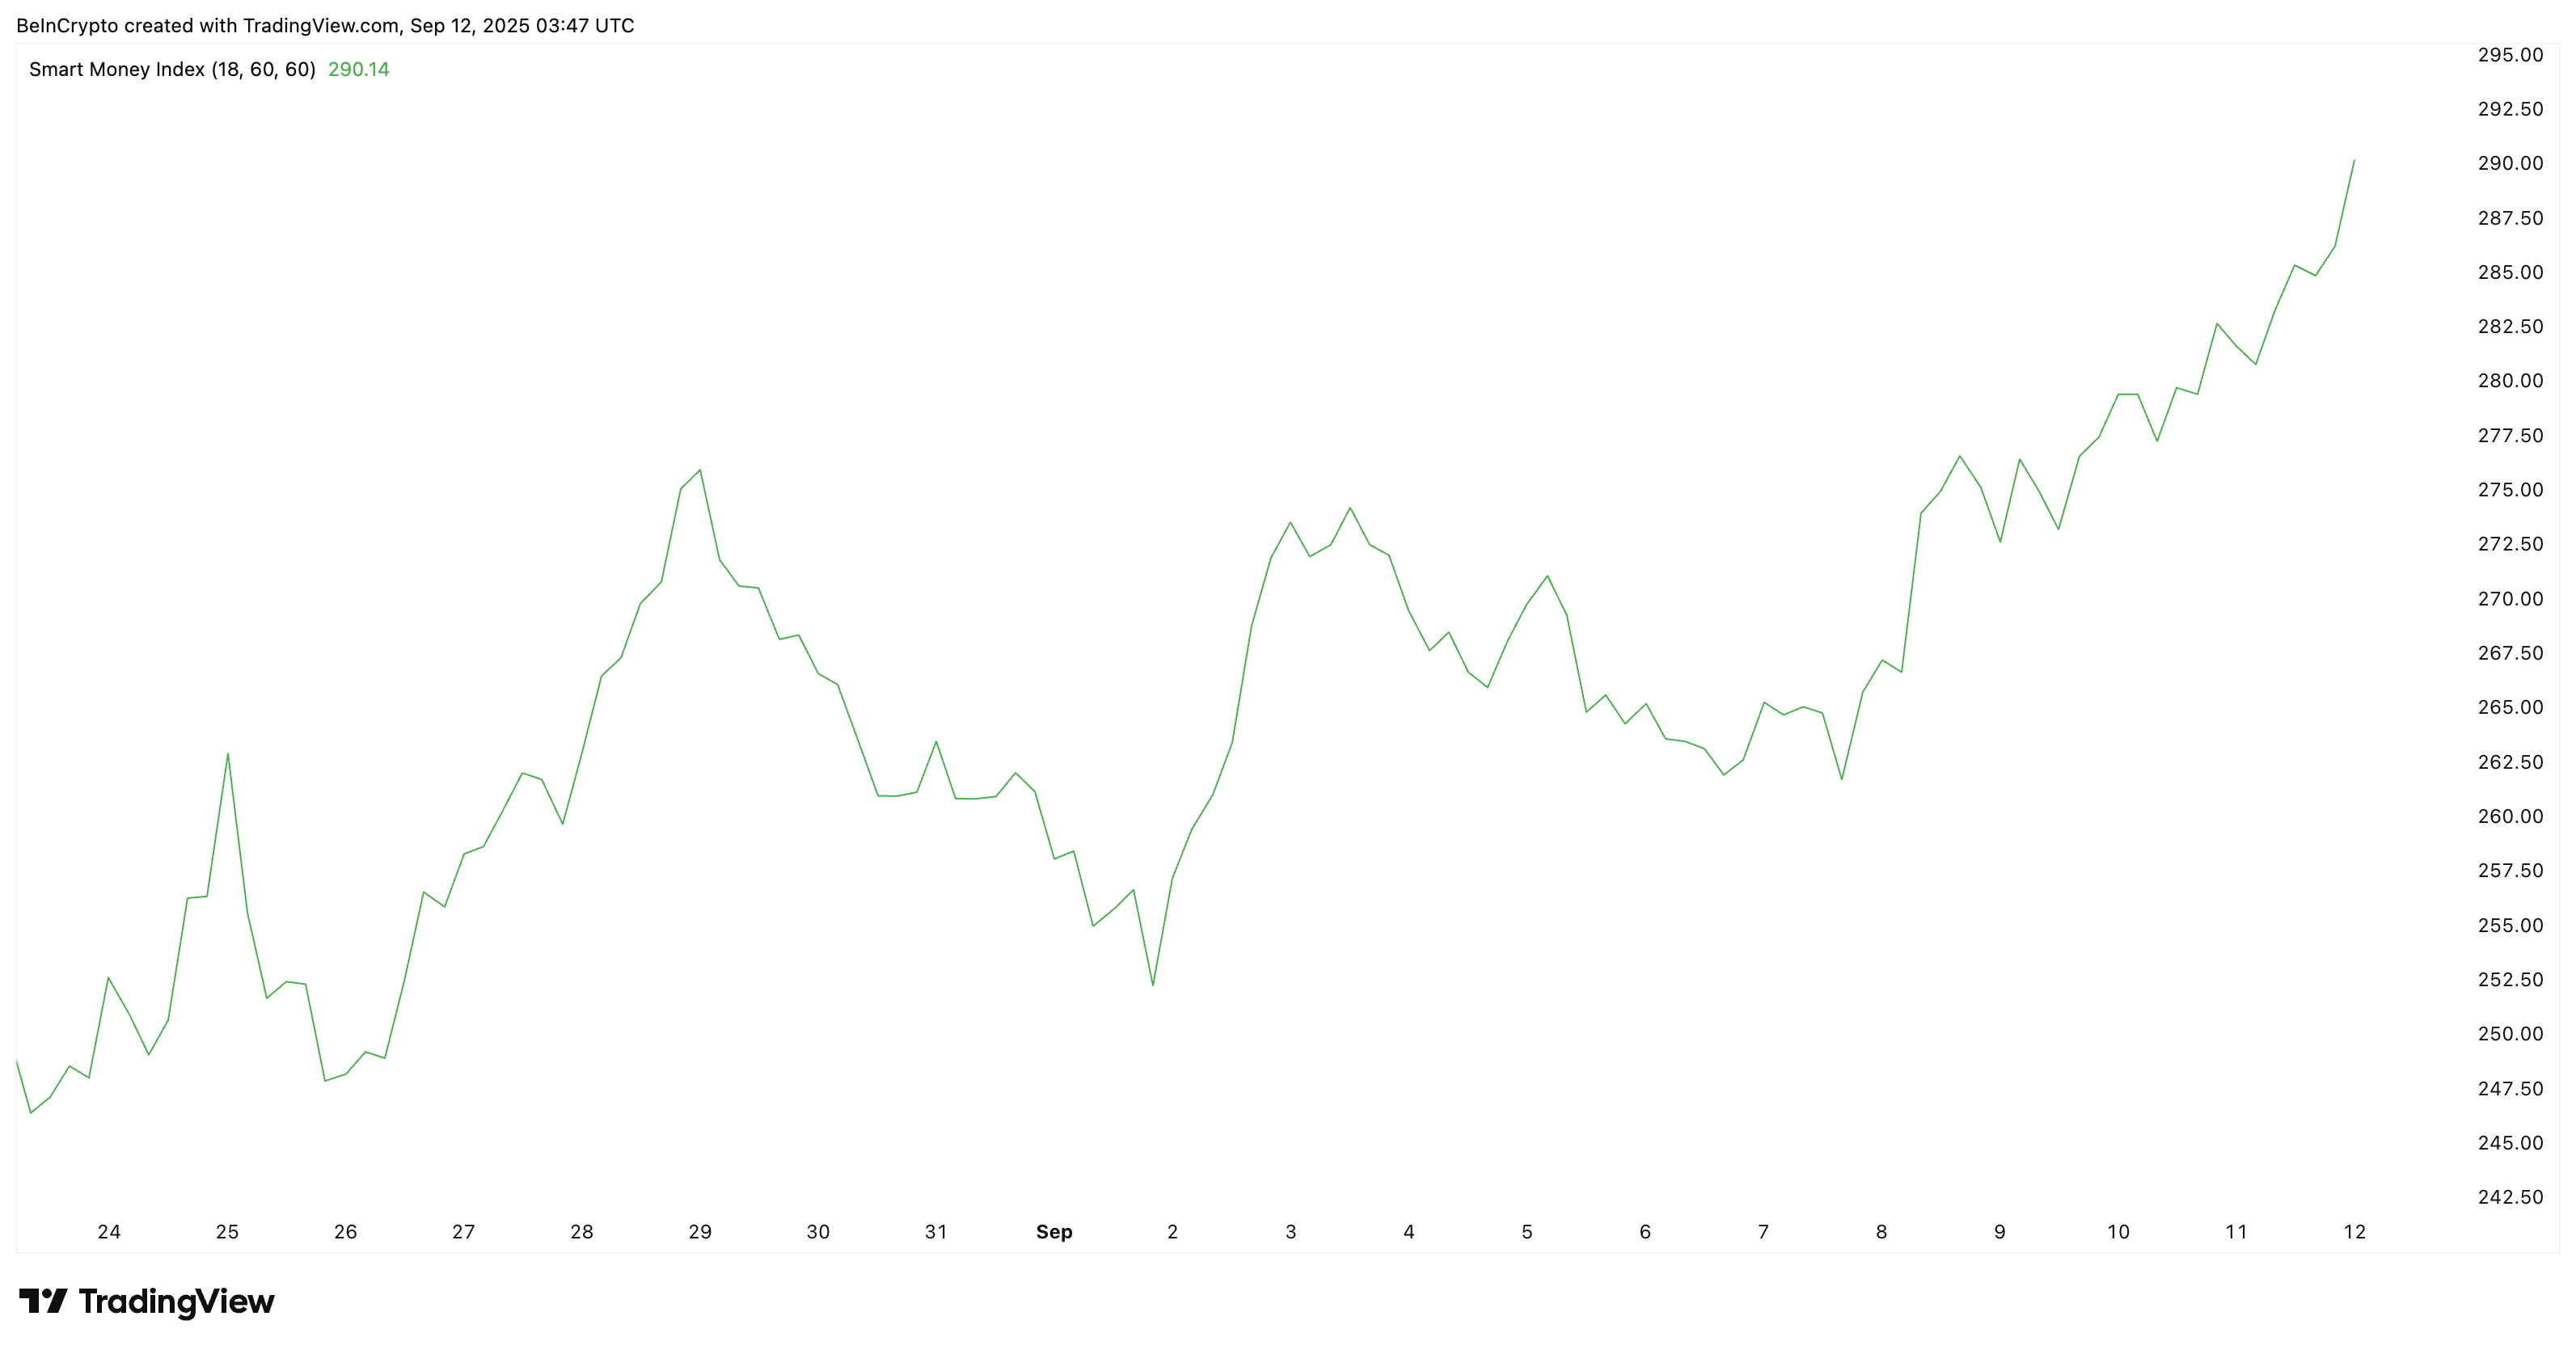 Smart Money Bets Big On The SOL Price:
On the 4-hour Solana price chart, SOL trades inside an ascending channel pattern, a formation that often breaks upward. The next test lies at the upper trendline. A clean 4-hour candle close above the upper trendline would confirm a breakout. If that happens, the measured move points to $244 as the next target for the Solana price.
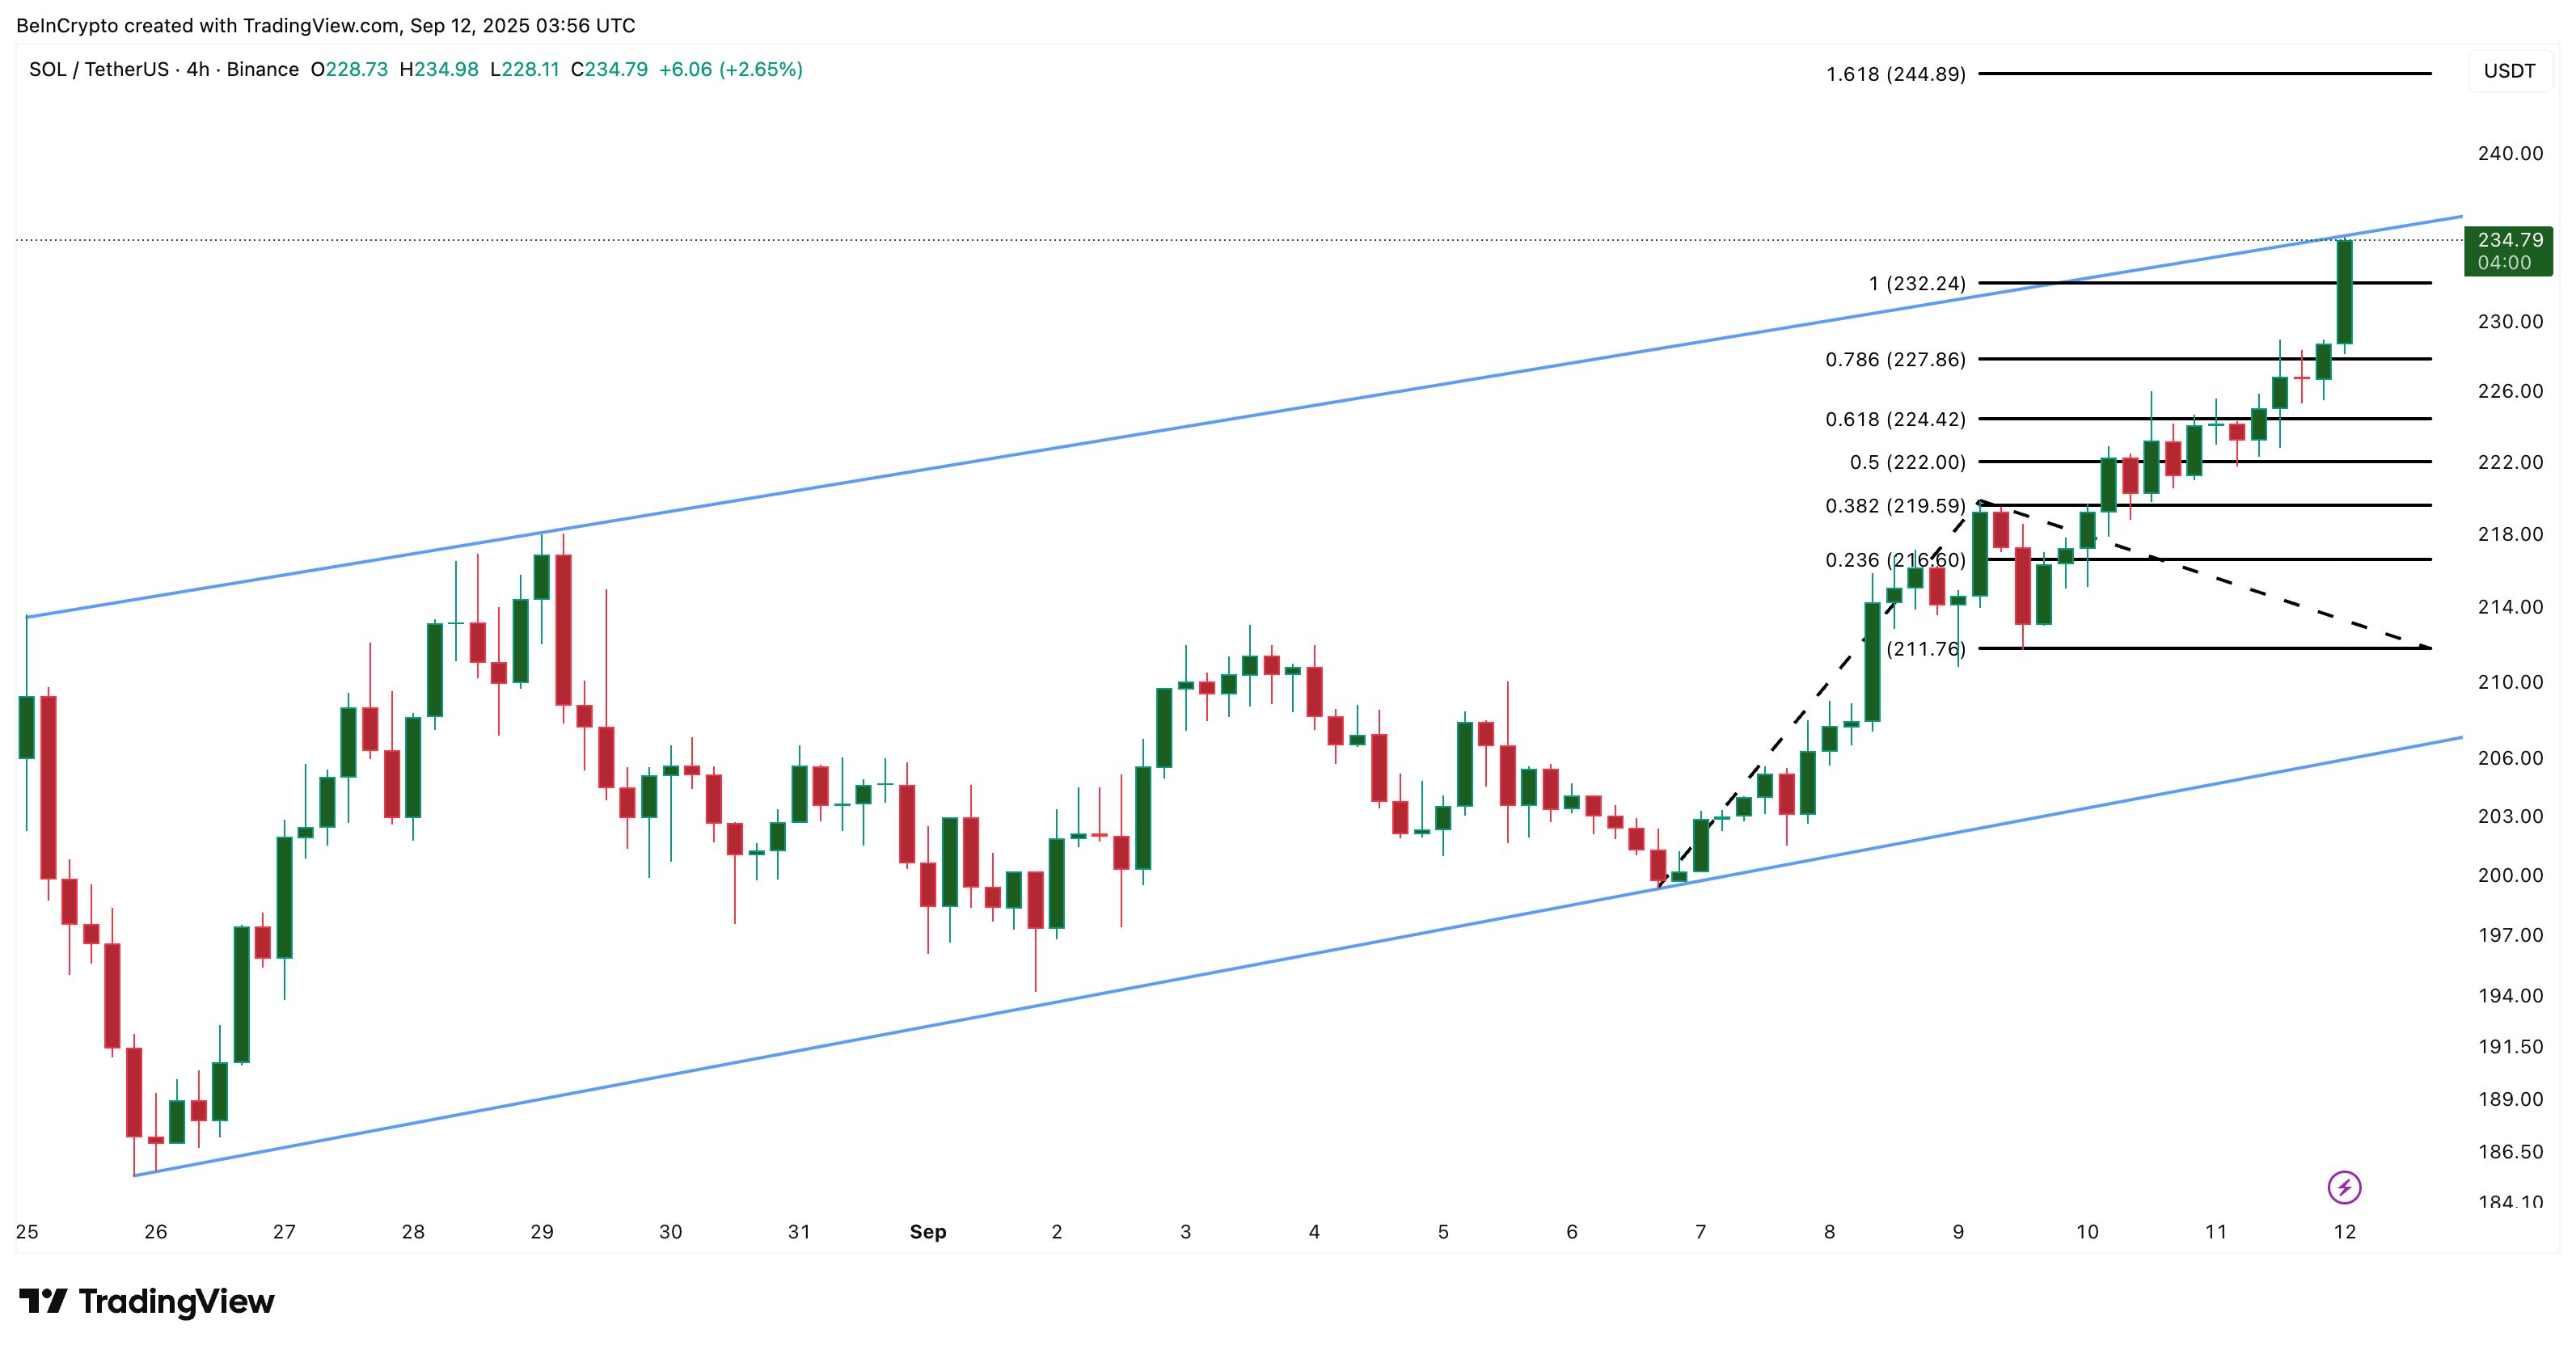 Solana Price Analysis:
Support remains layered below. Strong demand zones sit at $227 and $224, with deeper support at $211 in the near-term. A drop under that level would weaken the current bullish structure.
But for now, the Solana price setup looks positive, with both whales and smart money aligned on the bullish side. However, a breakout confirmation is still needed.
Disclaimer: The content of this article solely reflects the author's opinion and does not represent the platform in any capacity. This article is not intended to serve as a reference for making investment decisions.
You may also like
New spot margin trading pair — HOLO/USDT!
FUN drops by 32.34% within 24 hours as it faces a steep short-term downturn
- FUN plunged 32.34% in 24 hours to $0.008938, marking a 541.8% monthly loss amid prolonged bearish trends. - Technical breakdowns, elevated selling pressure, and forced liquidations highlight deteriorating market sentiment and risk-off behavior. - Analysts identify key support below $0.0080 as critical, with bearish momentum confirmed by RSI (<30) and MACD indicators. - A trend-following backtest strategy proposes short positions based on technical signals to capitalize on extended downward trajectories.

OPEN has dropped by 189.51% within 24 hours during a significant market pullback
- OPEN's price plummeted 189.51% in 24 hours to $0.8907, marking its largest intraday decline in history. - The token fell 3793.63% over 7 days, matching identical monthly and yearly declines, signaling severe bearish momentum. - Technical analysts cite broken support levels and lack of bullish catalysts as key drivers of the sustained sell-off. - Absence of stabilizing volume or reversal patterns leaves the market vulnerable to further downward pressure.

New spot margin trading pair — LINEA/USDT!