
XRP Price Gets Tighter: Here’s The Level Keeping It From Price Discovery

XRP is now back trading above $3 and is holding well above the price level. This is on the back of days of consolidating around $2.8. Although price action in the past 24 hours has seen XRP trading back above $3, it is yet to confirm a close to solidify the zone. Against this backdrop, technical analysis of the XRP 4-hour candlestick timeframe chart shows a critical level that could determine whether XRP finally breaks free into price discovery.
Resistance Keeping XRP From Price Discovery
Although the XRP price is currently inching slowly upwards, technical analysis shows it is yet to break above a technical resistance keeping it from price recovery. According to a technical analysis of the XRP 4-hour candlestick timeframe chart that was posted on the social media platform X by CoinsKid, XRP’s movement in August was capped by a resistance line at $3.3774. This resistance is represented with the white trendline in the price chart below.
The importance of this line goes beyond short-term price action. As it stands, this resistance barrier has effectively become the gatekeeper between XRP’s current price action and the possibility of a major breakout for price discovery into new all-time highs.
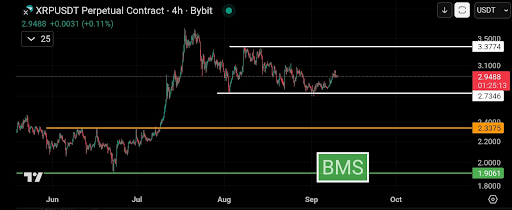
According to the analyst, clearing this line would mark the point at which XRP could enter price discovery, a stage where there are no previous highs to serve as reference points. Until that happens, XRP is expected to continue oscillating within its established range, with $2.7346 acting as the lower white support line on the chart.
Possible Shakeout Before The Break
Although XRP has managed to hold above notable price points around $2.8 during its most recent corrections, there’s always the possibility of a strong downside move. CoinsKid also noted that a final shakeout could take place before any bullish breakout occurs.
This shakeout could see the sellers gain temporary momentum and cause the XRP price to break below $2.8 and crash to lower price levels. In this case, the analyst pointed to the orange support trendline at $2.3375 as a possible level that XRP might retest in such a shakeout.
CoinsKid linked this possibility to September, earning the reputation of being rektember during bull cycles. However, this September might be different, considering the current dynamics of the crypto market.
At the time of writing, XRP is trading at $3.06, up by 1.8% in the past 24 hours. The analyst noted that XRP’s macro structure will be bullish as long as it holds above the green line at $1.9061. This long-term support has so far underpinned the rally that began in late June.
XRP is already up by about 10% from its September open, but it could possibly perform better in the later part of the month. The probability of a Fed rate cut in September is now above 97%, and this could play into a bullish run for XRP and many other large market-cap cryptocurrencies.
Disclaimer: The content of this article solely reflects the author's opinion and does not represent the platform in any capacity. This article is not intended to serve as a reference for making investment decisions.
You may also like
New spot margin trading pair — HOLO/USDT!
FUN drops by 32.34% within 24 hours as it faces a steep short-term downturn
- FUN plunged 32.34% in 24 hours to $0.008938, marking a 541.8% monthly loss amid prolonged bearish trends. - Technical breakdowns, elevated selling pressure, and forced liquidations highlight deteriorating market sentiment and risk-off behavior. - Analysts identify key support below $0.0080 as critical, with bearish momentum confirmed by RSI (<30) and MACD indicators. - A trend-following backtest strategy proposes short positions based on technical signals to capitalize on extended downward trajectories.

OPEN has dropped by 189.51% within 24 hours during a significant market pullback
- OPEN's price plummeted 189.51% in 24 hours to $0.8907, marking its largest intraday decline in history. - The token fell 3793.63% over 7 days, matching identical monthly and yearly declines, signaling severe bearish momentum. - Technical analysts cite broken support levels and lack of bullish catalysts as key drivers of the sustained sell-off. - Absence of stabilizing volume or reversal patterns leaves the market vulnerable to further downward pressure.

New spot margin trading pair — LINEA/USDT!