Date: Sun, Sept 14, 2025 | 06:40 AM GMT
The cryptocurrency market continues to show strength amid the anticipated potential US Federal Reserve rate cuts, with Ethereum (ETH) trading near the $4,650 mark after an 8% weekly gain. Riding on this positive momentum, several altcoins are flashing bullish signals — including Sonic (S).
Sonic has turned green with a 4% gain over the week, and more importantly, its chart is now highlighting a harmonic structure that could set the stage for further upside momentum.
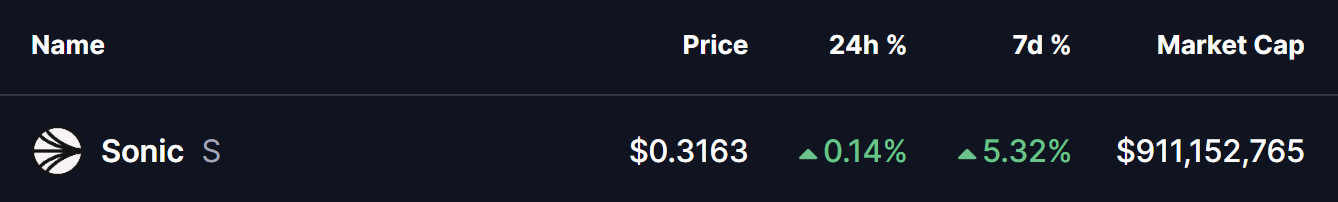 Source: Coinmarketcap
Harmonic Pattern Hints at Potential Upside
On the daily timeframe, Sonic is developing a Bearish Gartley harmonic pattern. Despite the name, the CD leg of this structure often unfolds with a bullish push before the price action nears the Potential Reversal Zone (PRZ).
The sequence began at point X ($0.4188), retraced down to point A, rebounded to B, and corrected lower to point C near $0.2940. From there, Sonic has shown resilience, bouncing back and is now trading around $0.3141.
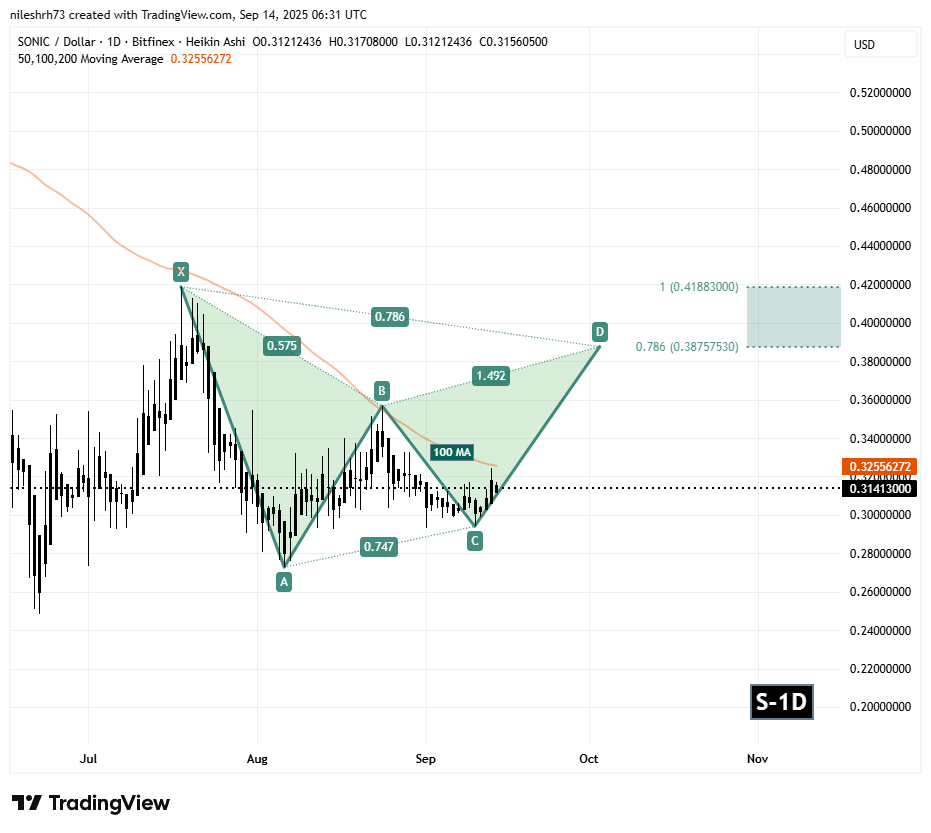 Sonic (S) Daily Chart/Coinsprobe (Source: Tradingview)
A key technical observation is that Sonic is hovering just under its 100-day moving average at $0.3255. Reclaiming this level would serve as a strong bullish confirmation, potentially turning it into support and fueling the next leg higher.
What’s Next for Sonic (S)?
If buyers manage to push Sonic above the 100-day MA, the token could rally into the PRZ range between $0.3875 and $0.4188. This area, defined by the 0.786–1.0 Fibonacci extensions, marks the completion zone of the Gartley formation and represents nearly a 33% upside from current levels.
However, confirmation remains key. Unless Sonic decisively clears the 100-day MA, the bullish setup will remain unconfirmed, leaving the door open for sideways consolidation.