Chainlink’s breakout above long-term resistance marks a structural shift: the Chainlink breakout cleared $21 and projects Fibonacci-based targets at $31.57, $53 and $69, while recurring bull pennants and MACD golden crosses support upward continuation if price stays above $25–$27.
-
Breakout cleared $21, opening Fibonacci targets at $31.57, $53 and $69
-
Recurring bull pennants aligned with MACD golden crosses suggest short-term continuation.
-
Stability above $25–$27 is critical to maintain momentum; immediate support sits near $21 and $22.
Chainlink breakout: LINK clears $21 with Fibonacci targets to $31.57 and beyond — monitor $25–$27 support for continuation. Read analysis and next steps.
What is the Chainlink breakout and what are the immediate price targets?
The Chainlink breakout refers to LINK’s decisive move above multi‑year resistance near $21, signaling a shift from prolonged consolidation to possible expansion. Fibonacci retracements set near-term targets at $31.57 (0.786), $53 (1.0 extension) and $69 (1.272), with a higher extension at $145 as a blow‑off level.
How do Fibonacci levels and technical patterns define Chainlink price targets?
Fibonacci retracement and extension levels provide objective milestones for potential upside and corrective support. The 0.786 retracement at $31.57 and extensions at $53 and $69 map a phased rally. Analysts Ali and Lark Davis cited these levels alongside pattern breakouts to quantify targets and downside guards.
Chainlink breaks multi year resistance with Fibonacci targets while analysts highlight recurring bull pennants and MACD momentum signals.
- Chainlink broke above $21 after years of consolidation, with Fibonacci targets pointing to $31.57, $53, $69, and $145.
- Analyst Lark Davis noted two bull pennants, each aligning with MACD golden crosses, supporting bullish continuation signals.
- Analysts stressed that stability above $25–$27 is crucial to sustain momentum and test higher resistance near $30 and beyond.
Chainlink has surged above long term resistance levels, with analysts pointing to technical structures that could lead to higher gains. The asset is trading at $24.78, a 1.5% decline, after moving beyond a symmetrical triangle pattern that had been in place since 2022. This breakout, according to analyst Ali, indicates a change from prolonged consolidation into a potential expansion phase that could define price action in the coming year.
Multi Year Resistance Cleared
From 2022 to mid‑2023, LINK traded below $10, forming a structural base with gradual higher lows. A tightening wedge emerged as rising trendline support converged with descending resistance from previous highs.
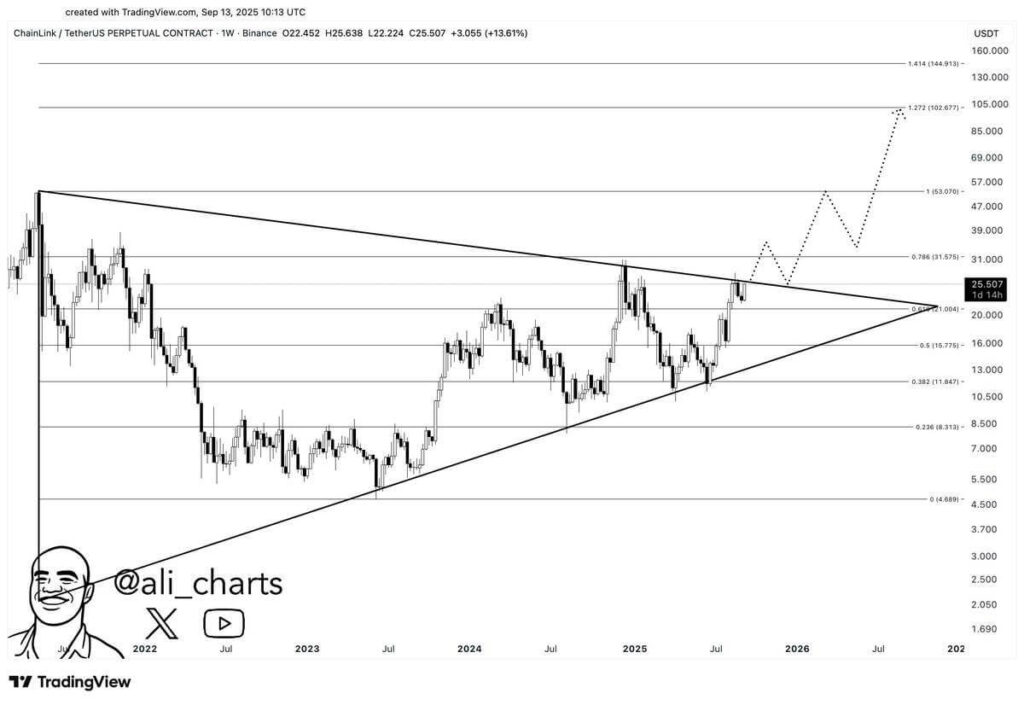
LINK/USDT 1-week price chart, Source: Ali on X
The decisive breakout above $21 marked the first clear move beyond that resistance in years. Technical levels now provide milestones for the trend. Immediate resistance is set near $31.57, aligning with the 0.786 Fibonacci retracement.
Sustained strength could lead toward $53 and $69, with the 1.272 extension projecting further at $102.6. A blow‑off target remains higher at $145, based on the 1.414 extension. On the downside, $21 serves as a crucial support zone, followed by $15.77 and $11.84 if a retest occurs.
Recurring Bull Pennant Adds Momentum Confirmation
A different setup was highlighted by analyst Lark Davis, who noted LINK forming consecutive bull pennants supported by momentum indicators. In early August, the first pennant breakout combined with a MACD golden cross, fueling a rally of over 54%.
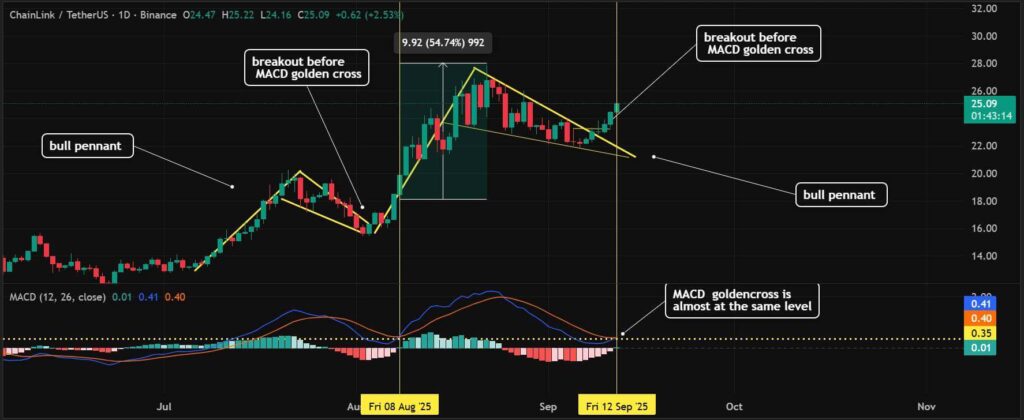
LINK/USDT 1-day price chart, Source: Lark Davis on X
Price jumped from $18.12 to $27.94 in that phase. The second pennant appeared in late August through September, breaking out near $24.50–$25.00. At the same time, the MACD line at 0.41 crossed above the signal line at 0.40.
This synchronization between pattern resolution and momentum indicator confirmed a strong continuation signal. Resistance stands ahead at $27.94 and the psychological $30 mark, while support rests near $22 at the pennant base.
Structural and Short Term Patterns Align
Both Ali and Davis identify conditions that could favor continued bullish momentum, though their focus lies on different aspects of the setup. Ali emphasized the long‑term breakout from consolidation supported by Fibonacci projections. Meanwhile, Davis tracked shorter‑term continuation patterns aligned with the MACD golden cross.
The alignment of structural breakout and recurring pennant patterns highlights significant interest from both institutional and retail participants. Immediate price stability above $25–$27 remains key to maintaining the trajectory toward higher resistance zones.
Quick Comparison: Fibonacci Targets and Key Levels
| Support | $21 | Former resistance, now key support |
| Short‑term Target | $31.57 | 0.786 Fibonacci retracement |
| Medium Target | $53 / $69 | Extension targets for phased rally |
| Blow‑off Target | $145 | 1.414 extension — high‑risk scenario |
Frequently Asked Questions
Is the current breakout likely to lead to a sustained uptrend?
Technical signals indicate a higher probability of continuation, but sustained momentum requires price stability above $25–$27 and confirmation from volume and momentum indicators like MACD and RSI.
What risk management levels should traders use for LINK?
Traders should consider trailing stops below $21 and reassess positions if price returns below $15.77. Position sizing and clear stop levels remain essential given crypto volatility.
Which on‑chain or market data can confirm the breakout?
Monitor exchange flows, realized volatility and on‑chain metrics from sources such as Glassnode and market pricing from CoinGecko (mentioned as reference) to validate market participation and risk sentiment.
Key Takeaways
- Breakout confirmed: LINK closed above $21, ending multi‑year consolidation and setting Fibonacci targets.
- Pattern and momentum alignment: Recurring bull pennants plus MACD golden crosses strengthen continuation thesis.
- Crucial support: Maintain above $25–$27 to sustain bullish momentum; deeper support at $21 and $15.77.
Conclusion
The Chainlink breakout above $21 combines structural Fibonacci targets and repeating pennant breakouts backed by MACD momentum, suggesting staged upside to $31.57, $53 and $69 if price holds key support. Traders and analysts should monitor volume, on‑chain metrics and stability above $25–$27 before increasing exposure. COINOTAG will continue tracking developments and updating analysis.