
XRP Price Prediction for September 14

Most of the coins are in the red zone on the last day of the week, according to CoinStats.
XRP/USD
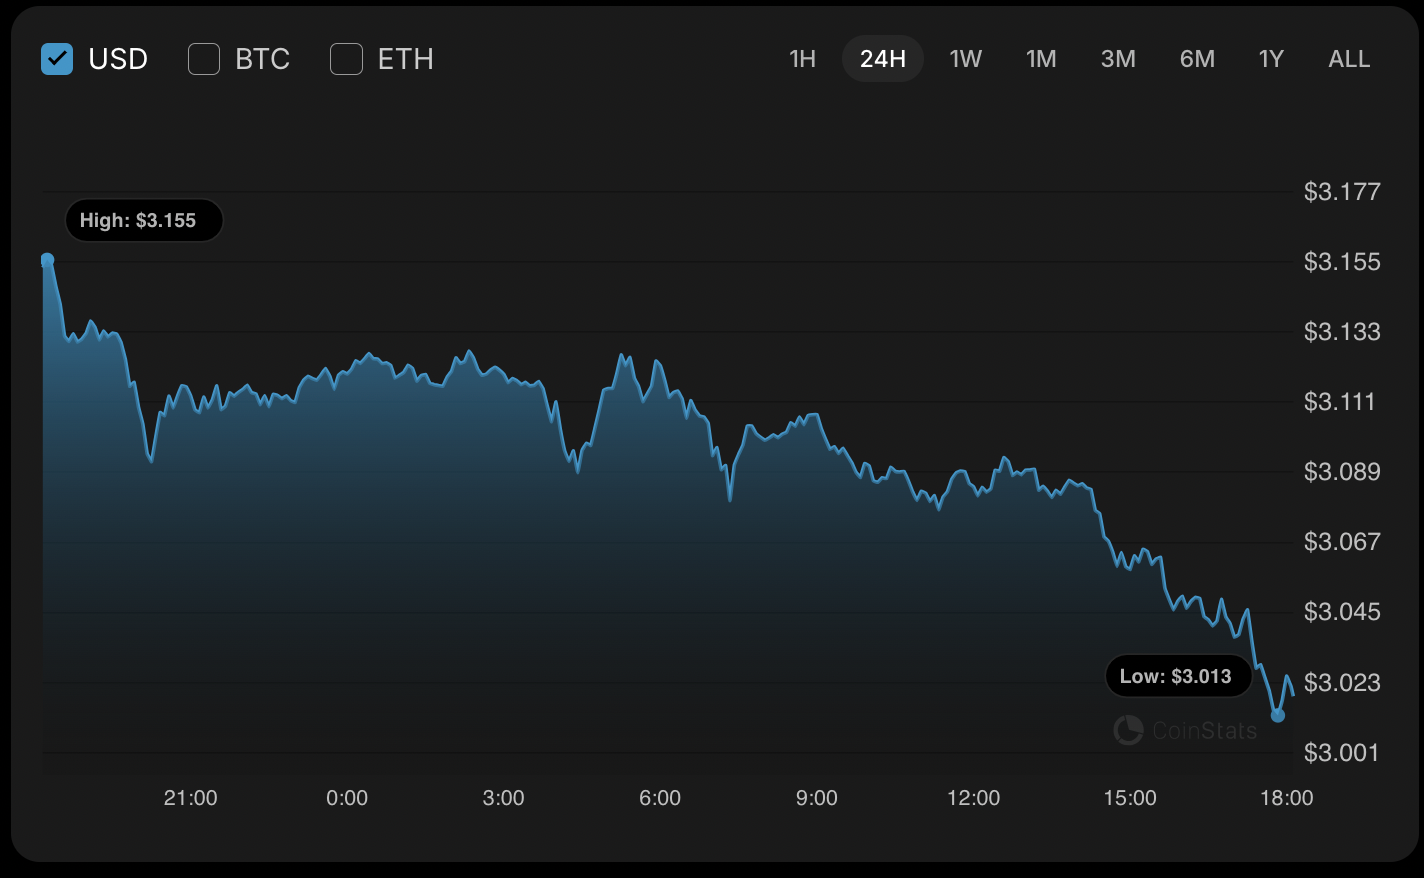
The price of XRP has fallen by almost 4% over the last 24 hours.
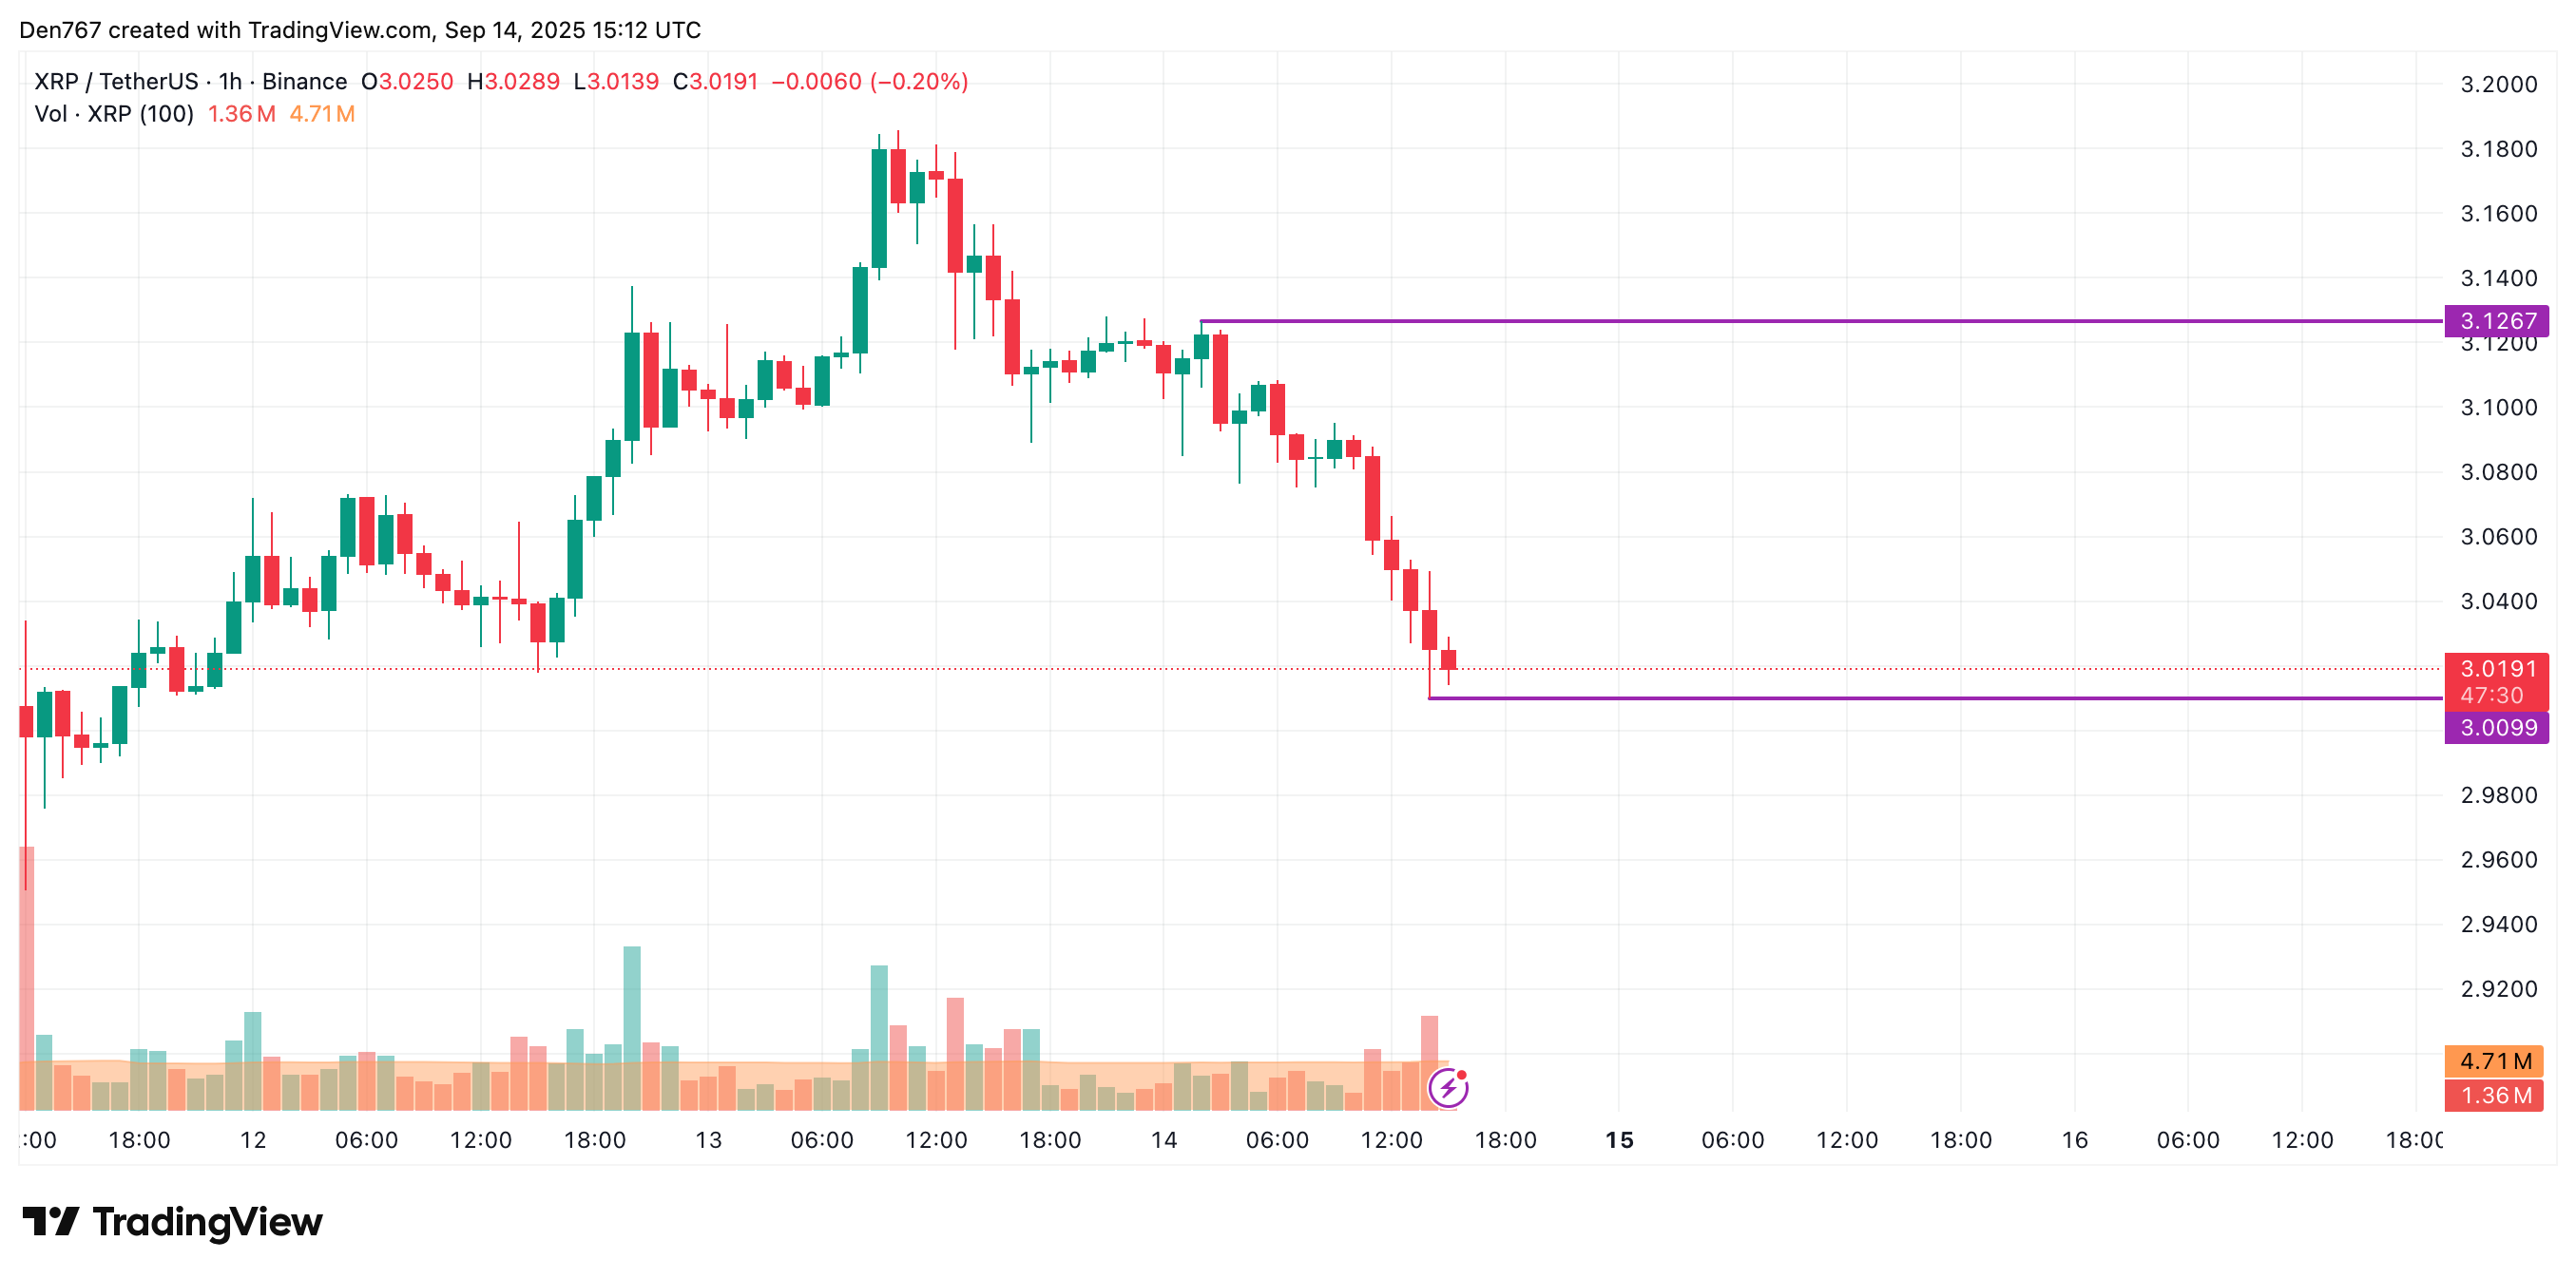
On the hourly chart, the rate of XRP is near the local support of $3. As most of the daily ATR has been passed, any sharp moves are unlikely to happen by the end of the day.
However, if a bounce back from the current prices does not happen, the fall may continue to the $2.95 zone soon.
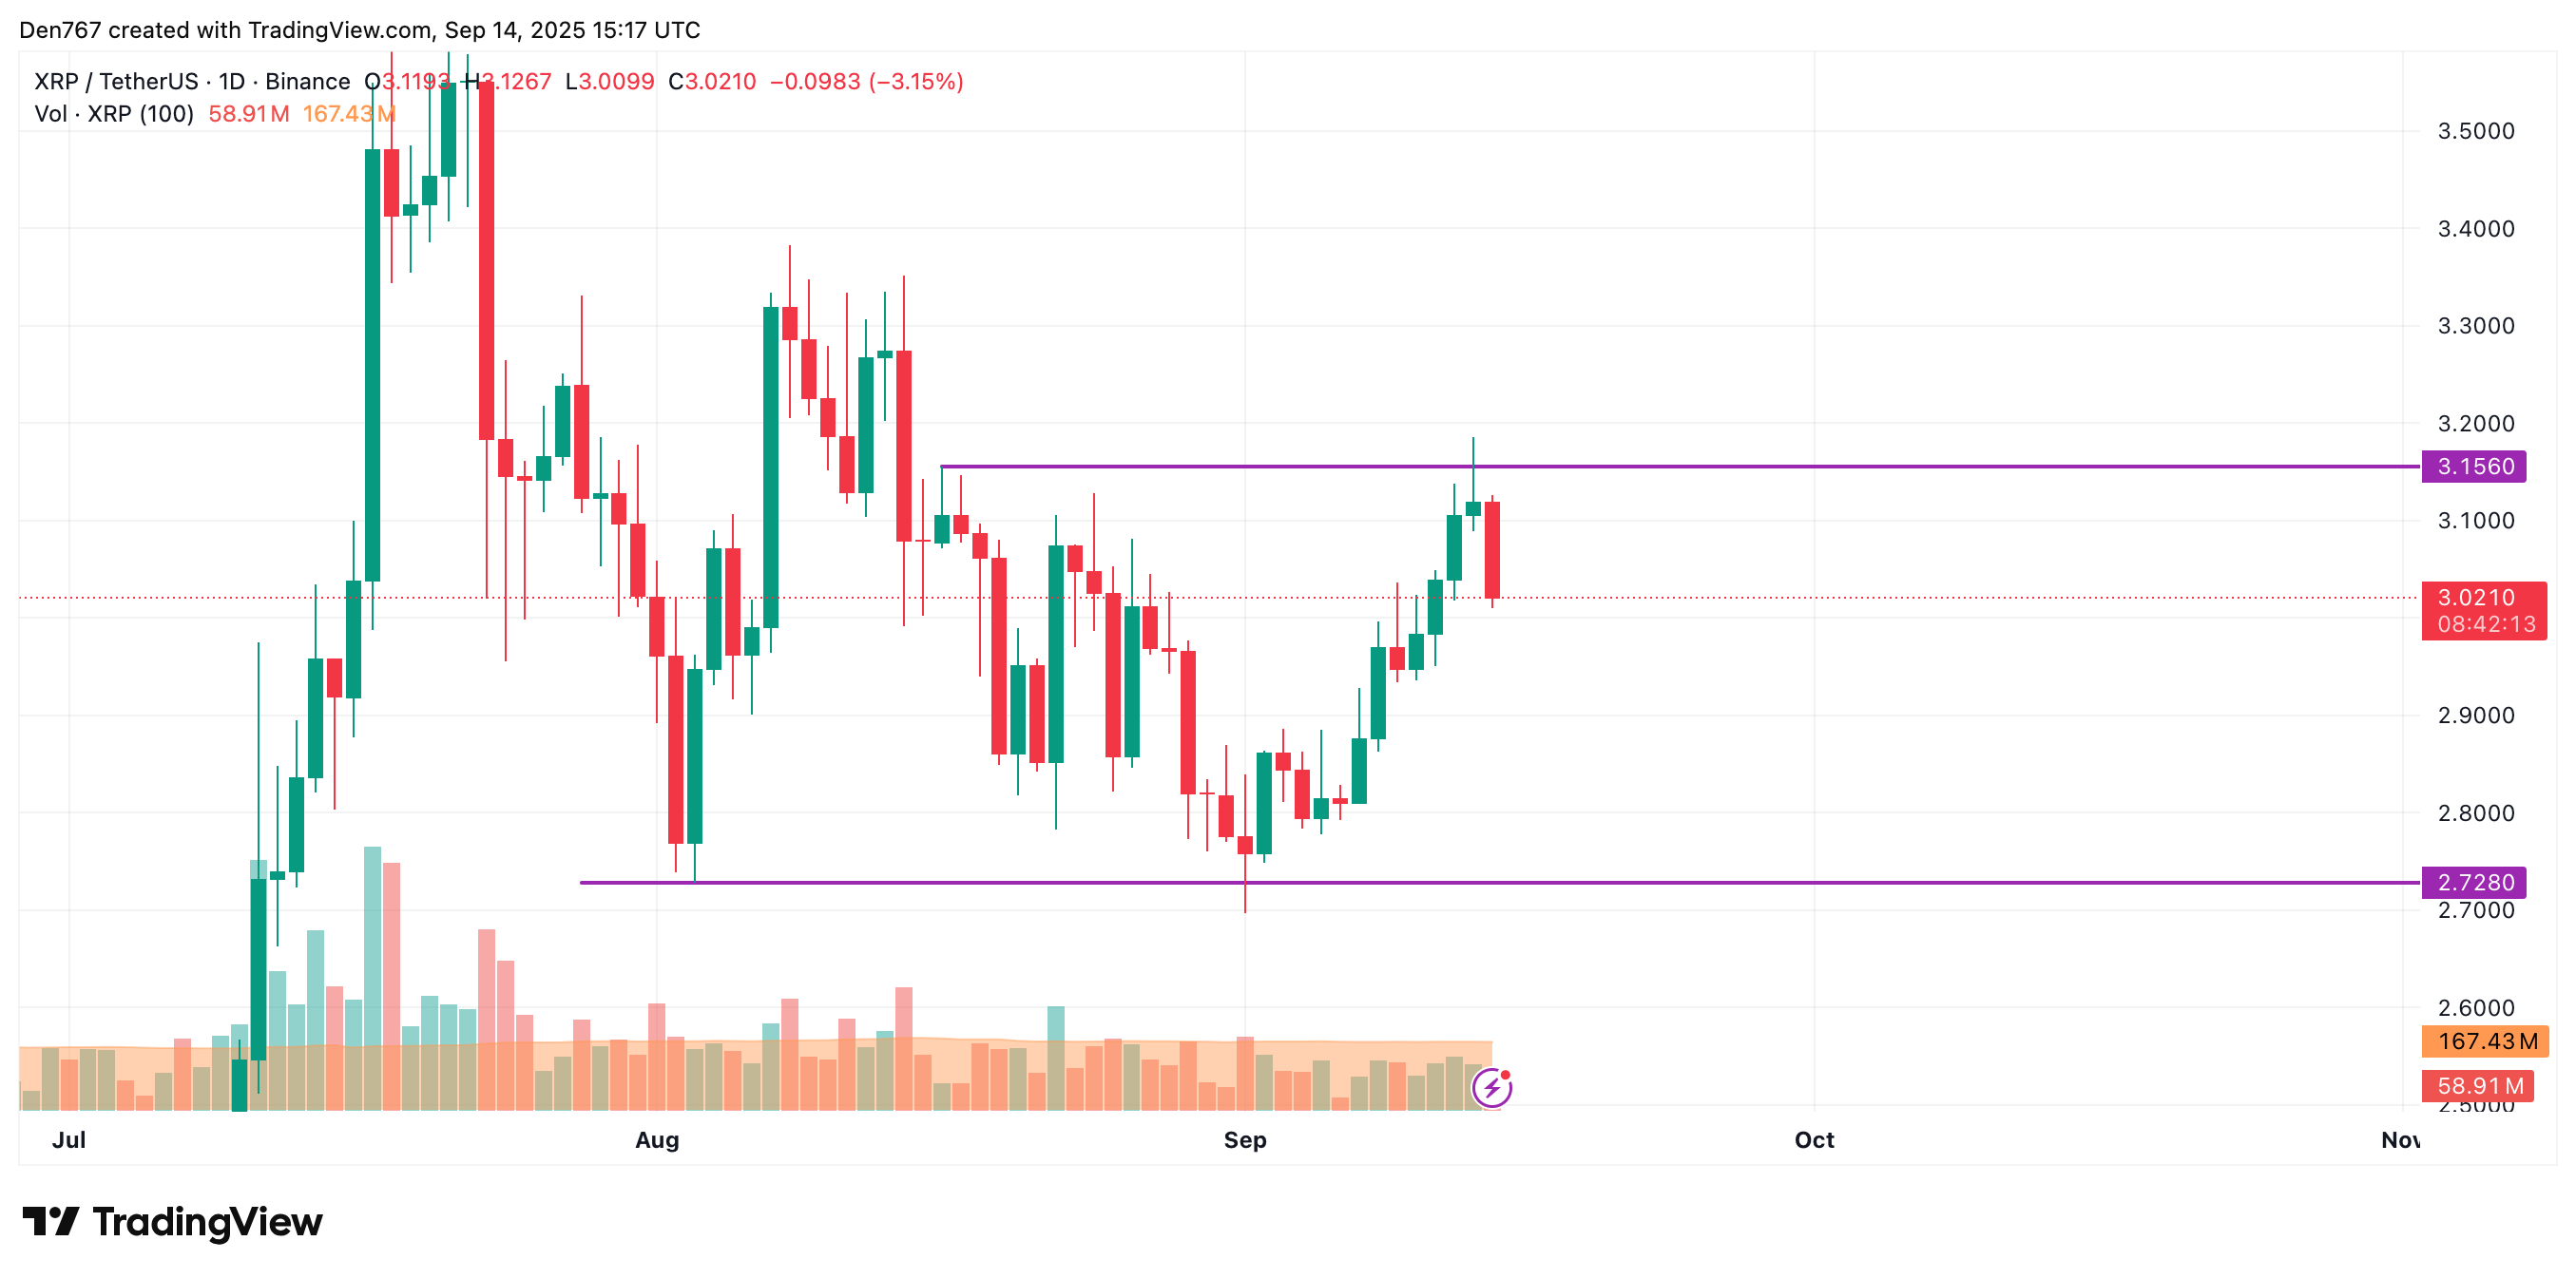
On the bigger time frame, the price of XRP is going down after a false breakout of the resistance of $3.1560. If bulls cannot seize the initiative, the decline is likely to continue to the $2.90-$2.95 range.
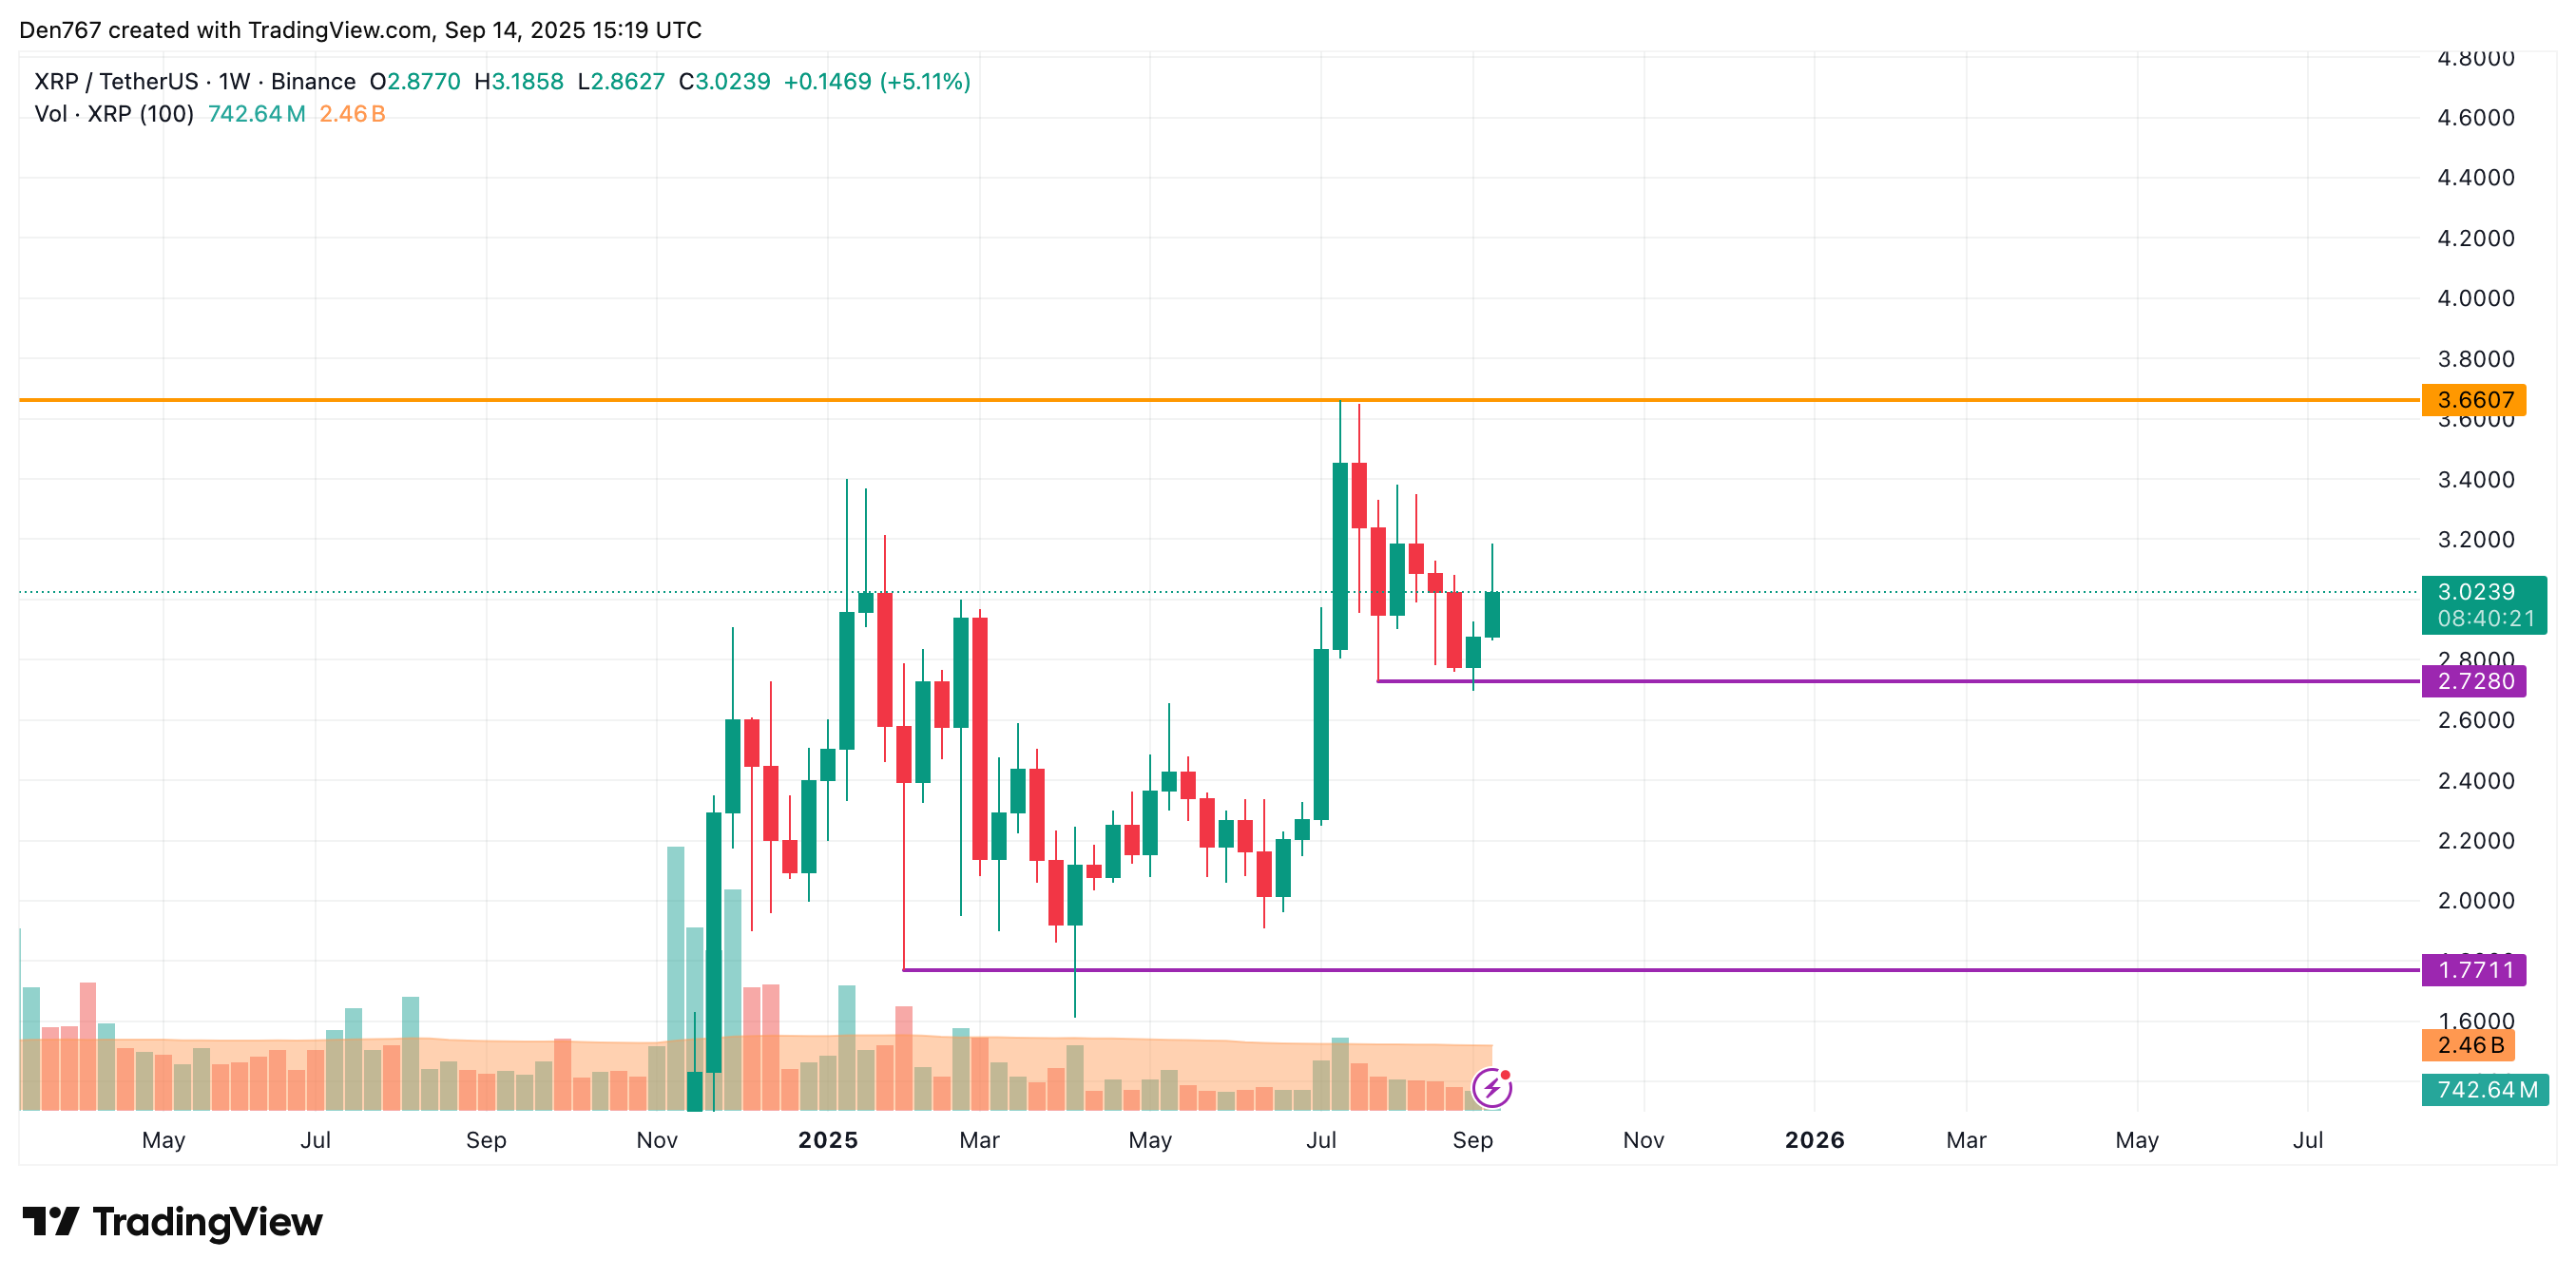
From the midterm point of view, neither side is dominating as the rate of XRP is far from the support and resistance levels. The volume is low, which means neither side has enough energy for a further sharp move. All in all, consolidation around the current prices is the more likely scenario.
XRP is trading at $3.032 at press time.
Disclaimer: The content of this article solely reflects the author's opinion and does not represent the platform in any capacity. This article is not intended to serve as a reference for making investment decisions.
You may also like
100% rebate for KYB users: Earn fee rebates on EUR bank deposits!
[Initial listing] Bitget to list Talus (US) in the Innovation and AI zone
Bitget Trading Club Championship (Phase 21)—Up to 1250 BGB per user, plus a ZETA pool and Mystery Boxes
Bitget Spot Margin Announcement on Suspension of MDT/USDT, RAD/USDT, FIS/USDT, CHESS/USDT, RDNT/USDT Margin Trading Services