Solana outlook: Solana’s network performance shows record weekly transactions and $1.2M in fees, but falling monthly active users and retention suggest the recent rally may be supply-driven rather than sustained demand, creating a mixed short-term price outlook for SOL.
-
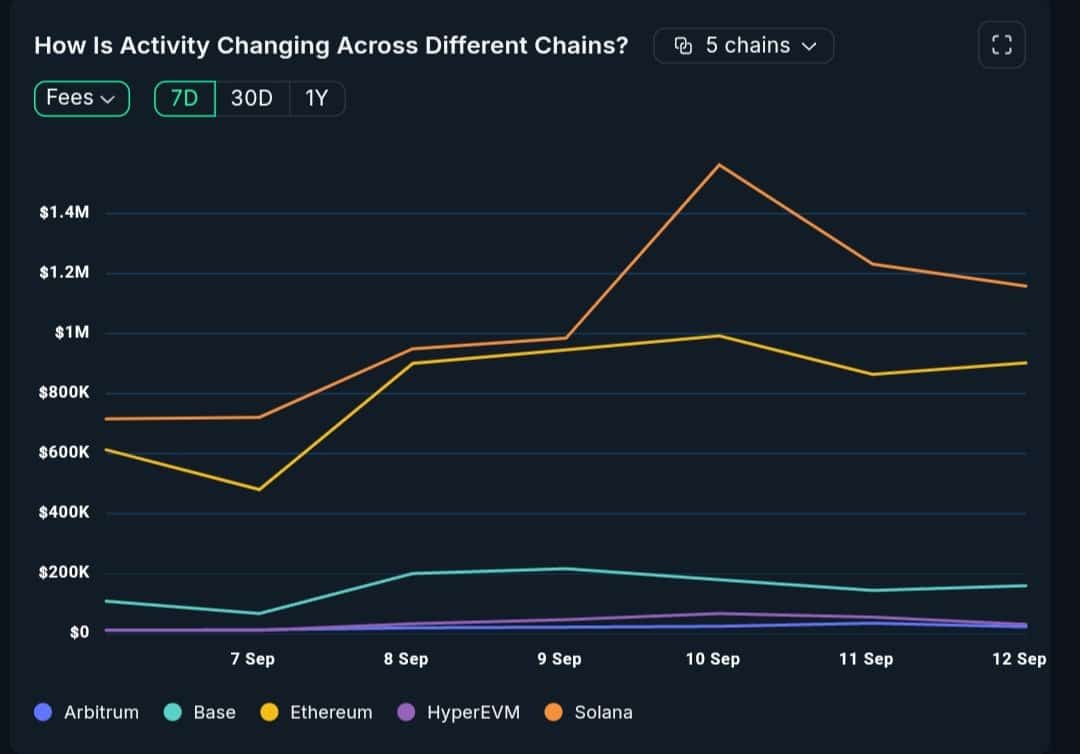
Solana led blockchains with 65M weekly transactions and $1.2M fees.
-
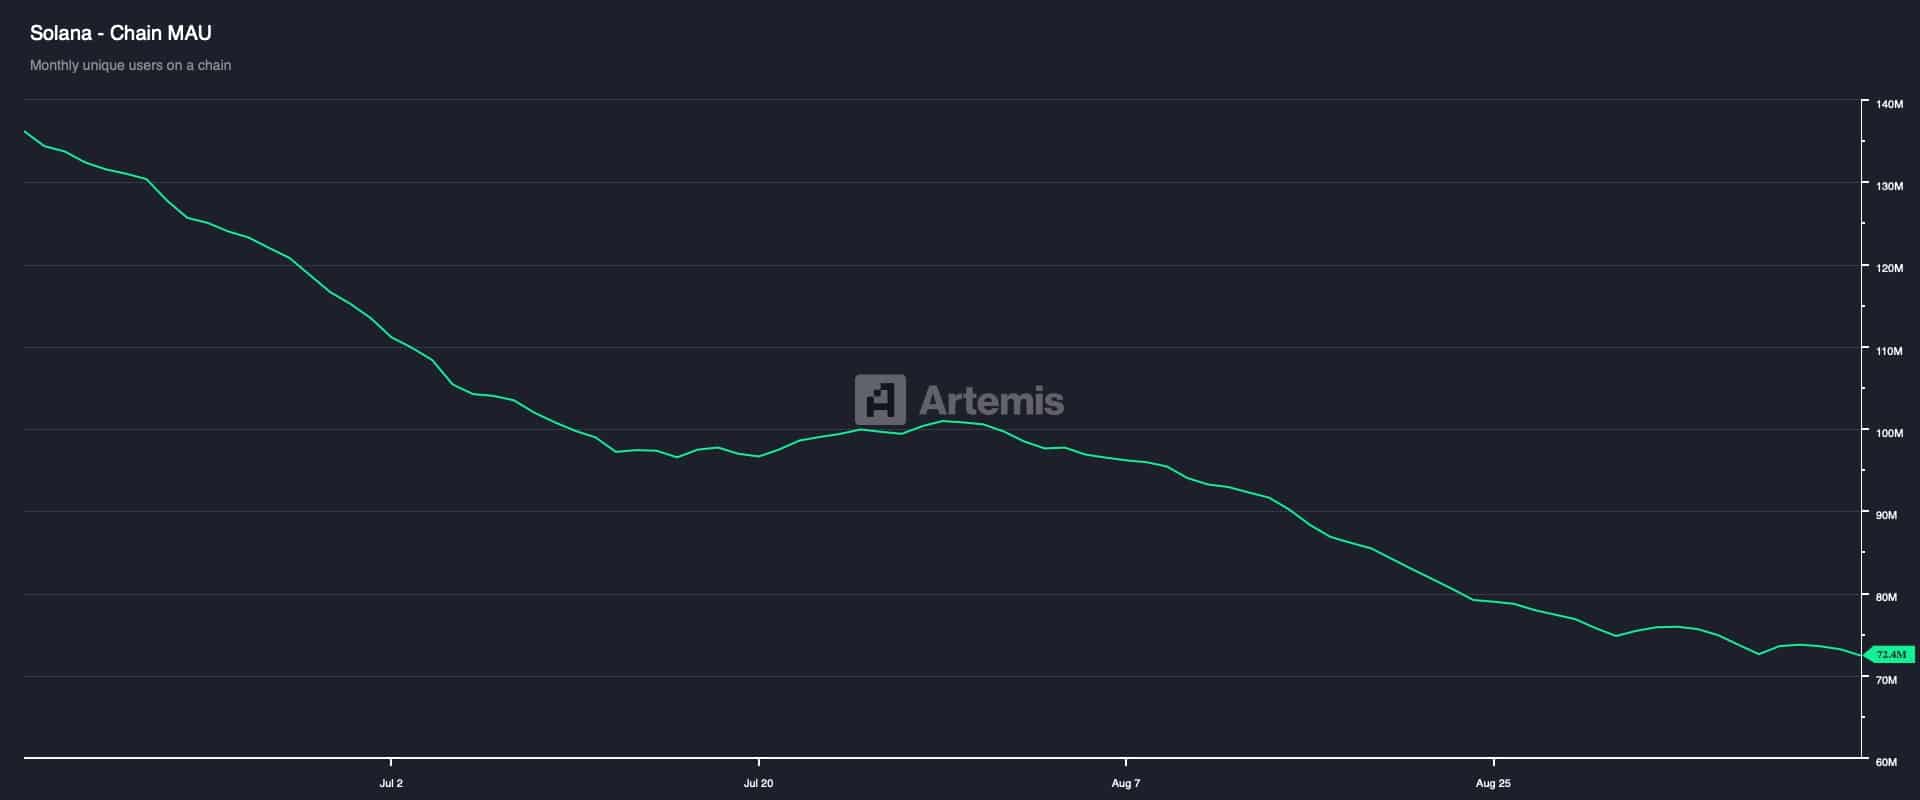
Monthly active users fell to a three-month low (≈72.4M) while returning users dropped to 1.5M.
-
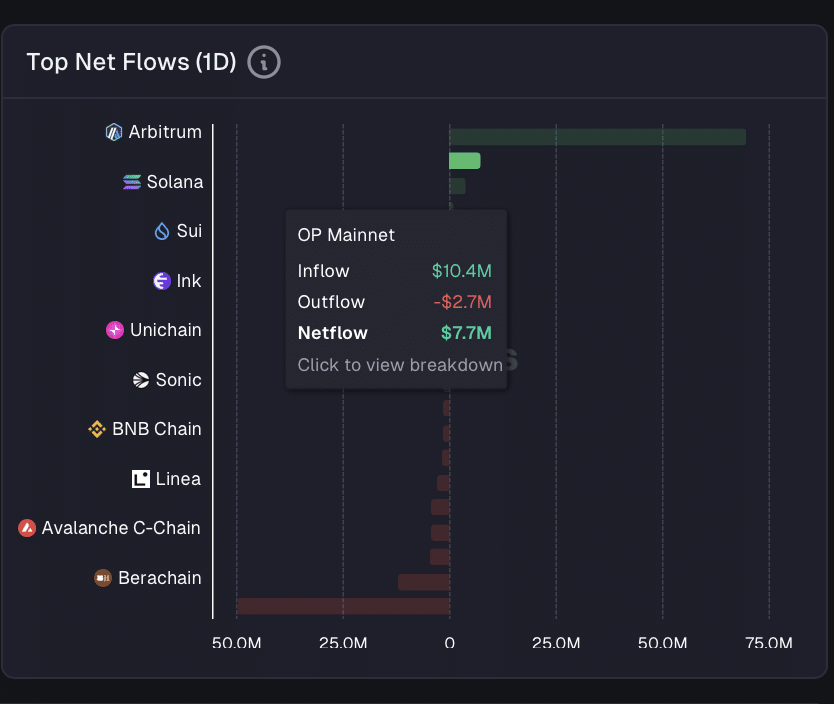
Bridge inflows remain strong: $7.7M of net bridged capital added in the past day.
Meta description: Solana outlook: Solana network performance shows 65M weekly transactions and $1.2M fees; falling MAUs raise caution. Read short-term analysis and key takeaways.
What is the current Solana outlook?
Solana outlook is mixed: the Solana network performance recently delivered record transaction and fee metrics, yet user activity and retention weakened, indicating short-term price strength may be driven by capital rotation rather than organic user growth.
How did Solana lead other chains in transactions and fees?
Recent on-chain analytics from BeingInvested reported Solana posting over 65 million transactions in a single week and generating approximately $1.2 million in fees. This placed Solana ahead of Base, Ethereum, Arbitrum and others on raw throughput and fee revenue metrics.
Source: BeingInvested (plain text)
Why doesn’t high transaction volume guarantee a bullish Solana outlook?
High throughput can come from a small number of high-frequency traders or protocol churn. Short-term transaction spikes do not necessarily reflect expanding user adoption or improved retention across decentralized applications.
What does user activity say about Solana network performance?
Network metrics from Artemis show monthly active users (MAU) slid to approximately 72.4 million, a three-month low, while Returning Users declined to ~1.5 million. These declines suggest weaker user engagement despite elevated transaction counts.
Source: Artemis (plain text)
How strong is on-chain funding for Solana?
On-chain capital flows indicate continued investor interest. Total Bridge Netflow data shows Solana recorded the second-largest bridged netflow in the most recent day, with roughly $7.7 million arriving from other networks.
Source: Artemis (plain text)
What could bridge inflows mean for SOL price?
Bridge inflows of this size can create short-term buying pressure. At press time SOL traded near $249, roughly 16% below the January all-time high of $294 (CoinMarketCap plain text reference). Continued net inflows may help SOL test psychological resistance levels such as $300.
Frequently Asked Questions
Is Solana network performance sustainable?
Sustained network performance depends on user retention and new user growth; current metrics show high weekly transactions but falling MAUs and returning users, which suggests sustainability is uncertain in the short term.
How should traders interpret Solana on-chain data?
Look for converging signals: rising transactions plus stable or growing MAUs and retention indicate organic growth. If transactions rise while MAUs fall, the move may be capital-driven and more volatile.
Key Takeaways
- Transaction dominance: Solana recorded ~65M weekly transactions and led chains in fee generation (~$1.2M).
- User caution: MAUs dropped to a three-month low (~72.4M) and Returning Users declined to ~1.5M, indicating weaker engagement.
- Capital inflows: Bridge Netflow added ~$7.7M recently, showing cross-chain investor interest that could support short-term price moves.
Conclusion
Solana network performance demonstrates technical capacity and continued capital interest, but the Solana outlook remains mixed due to falling monthly active users and retention. Investors and traders should monitor MAU and retention trends alongside bridge netflows before assuming the recent rally indicates sustained demand. COINOTAG will continue tracking on-chain metrics and update this analysis as new data arrives.
Published: 2025-09-14 · Updated: 2025-09-14