Solana Price Rally Eyes $284 Despite Local Top Risks Hinting at a Pullback

The Solana price is trading near $242 after a strong monthly run, but charts and on-chain data show signs of a short-term pullback. Even so, the path toward $284 remains intact as accumulation trends stay strong.
Solana’s rally has been one of the strongest in the market, with prices climbing nearly 30% month-on-month. At $242 today, the bullish surge for the Solana price toward $284 is still in play.
But charts and on-chain data suggest the move may not be straight up. Short-term signals hint at a pullback that could reset the trend before Solana resumes its climb.
Overheating Signals Point to Only A Pullback as Accumulation Stays Strong
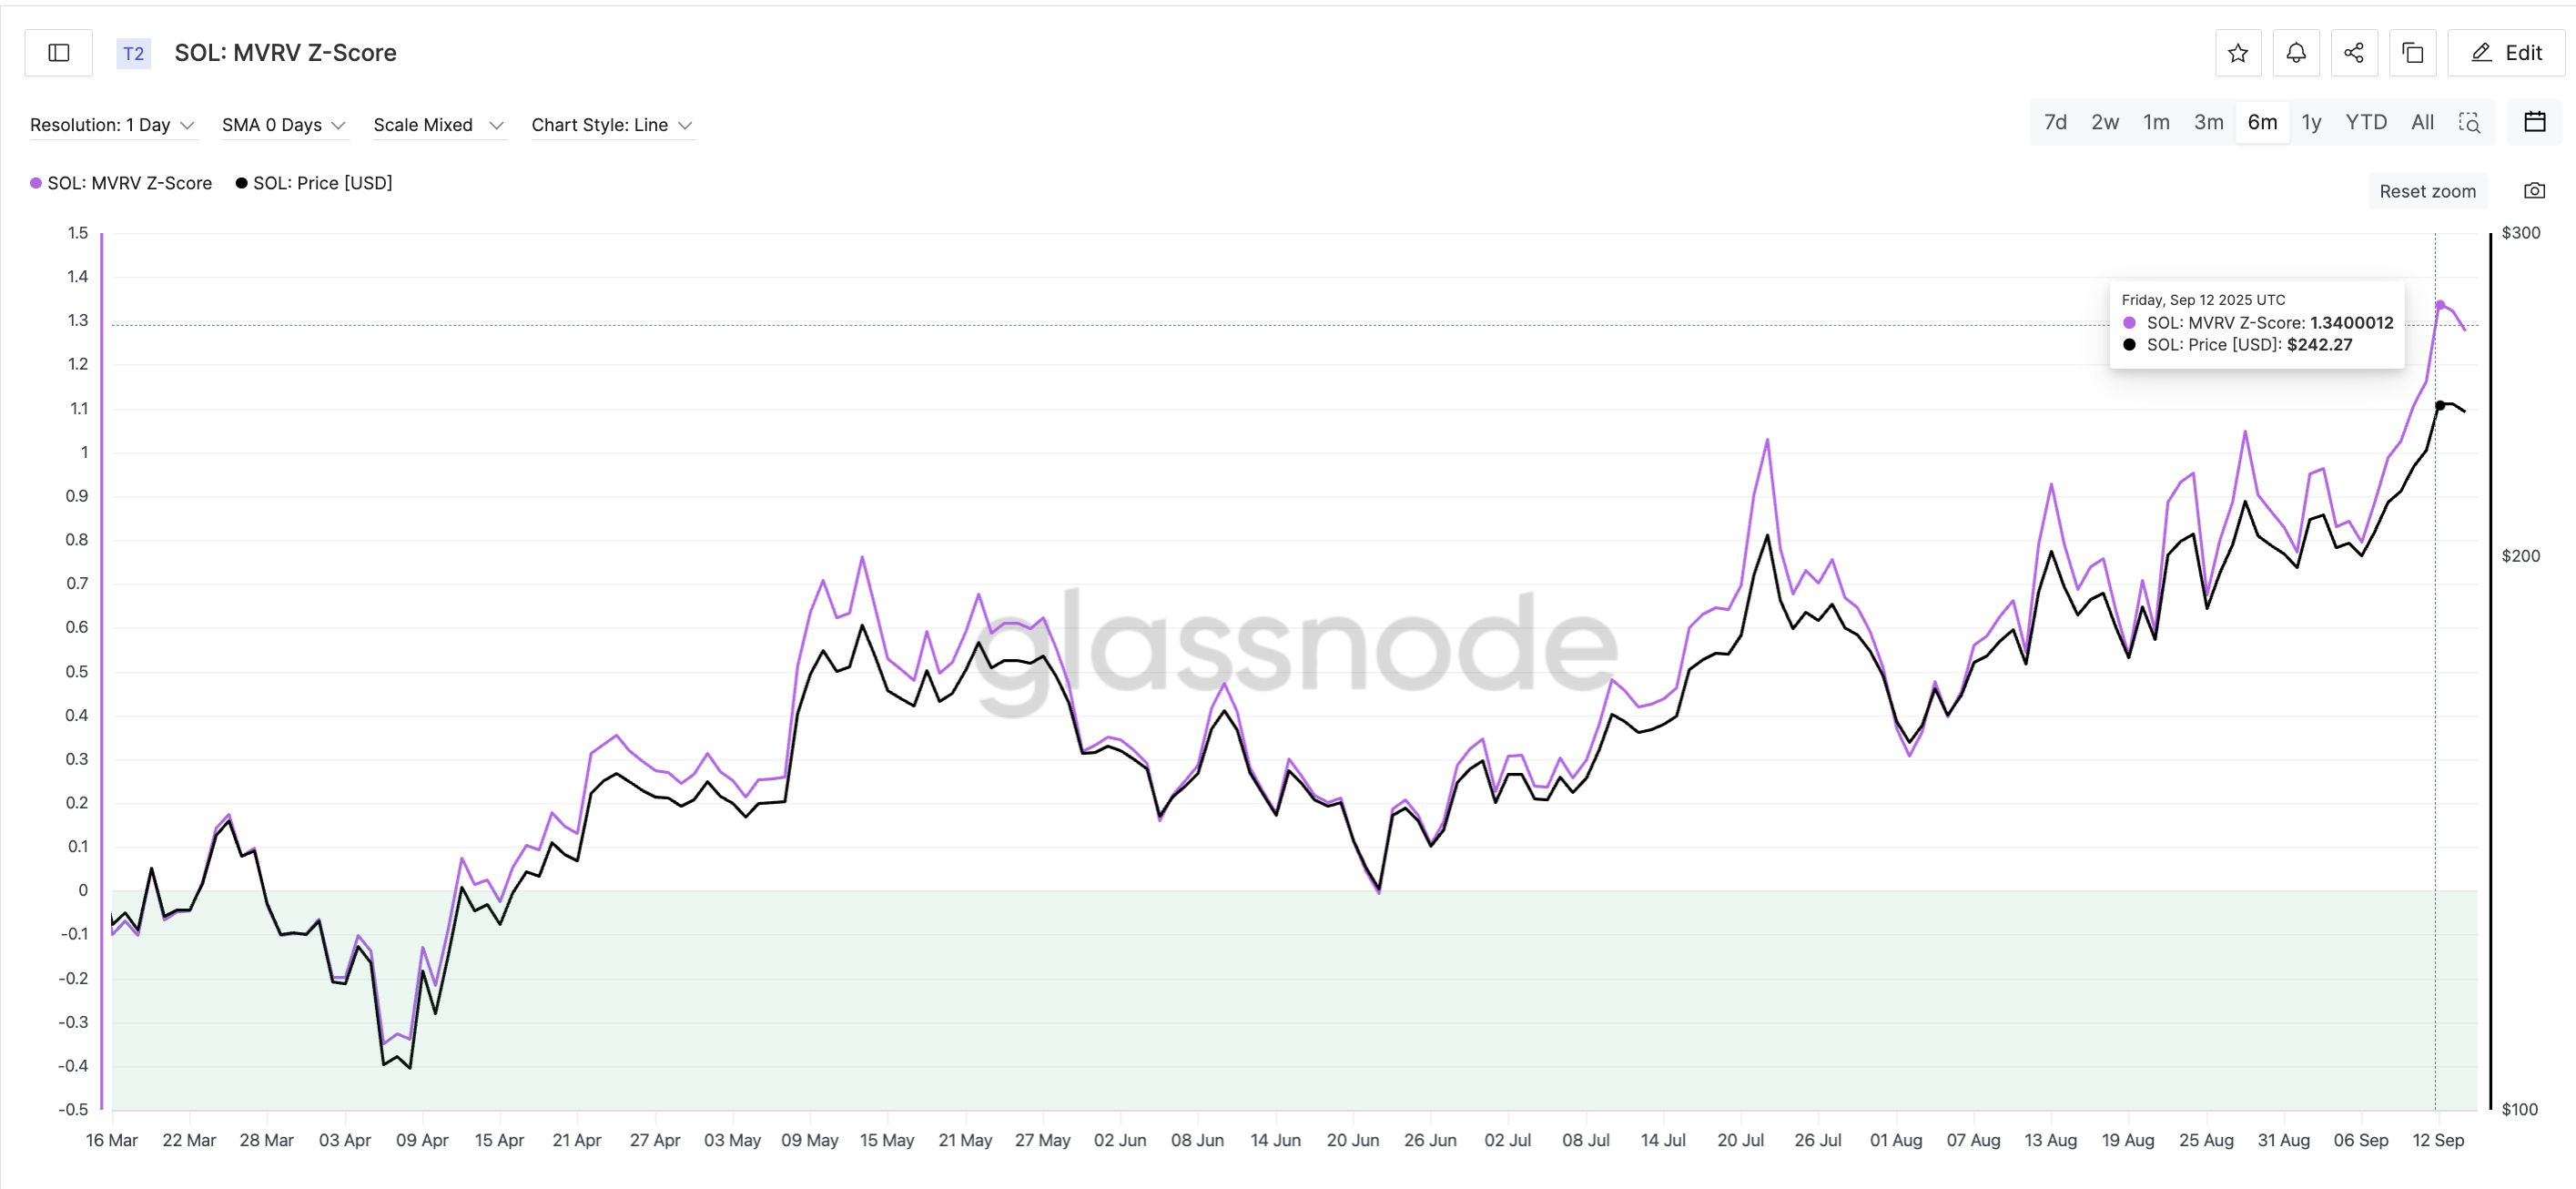
One reason to expect a pause is Solana’s MVRV Z-Score, a valuation metric that compares market value to realized value.
A higher score suggests the asset is leaning toward overvaluation or a local top. On September 12, the MVRV Z-Score spiked to 1.34, its highest in six months. Local peaks in July and August triggered double-digit corrections as they aligned with local Solana price tops.
 Solana MVRV-Z Score Hints At Correction:
Glassnode
Solana MVRV-Z Score Hints At Correction:
Glassnode
- July 22: MVRV hit 1.03 when SOL was $205. Solana price later corrected to $158, a drop of about 23%.
- August 13: MVRV peaked at 0.92 when SOL was $201, and price slid to $176, a 12% dip.
This makes the latest high concerning. But the context today is different.
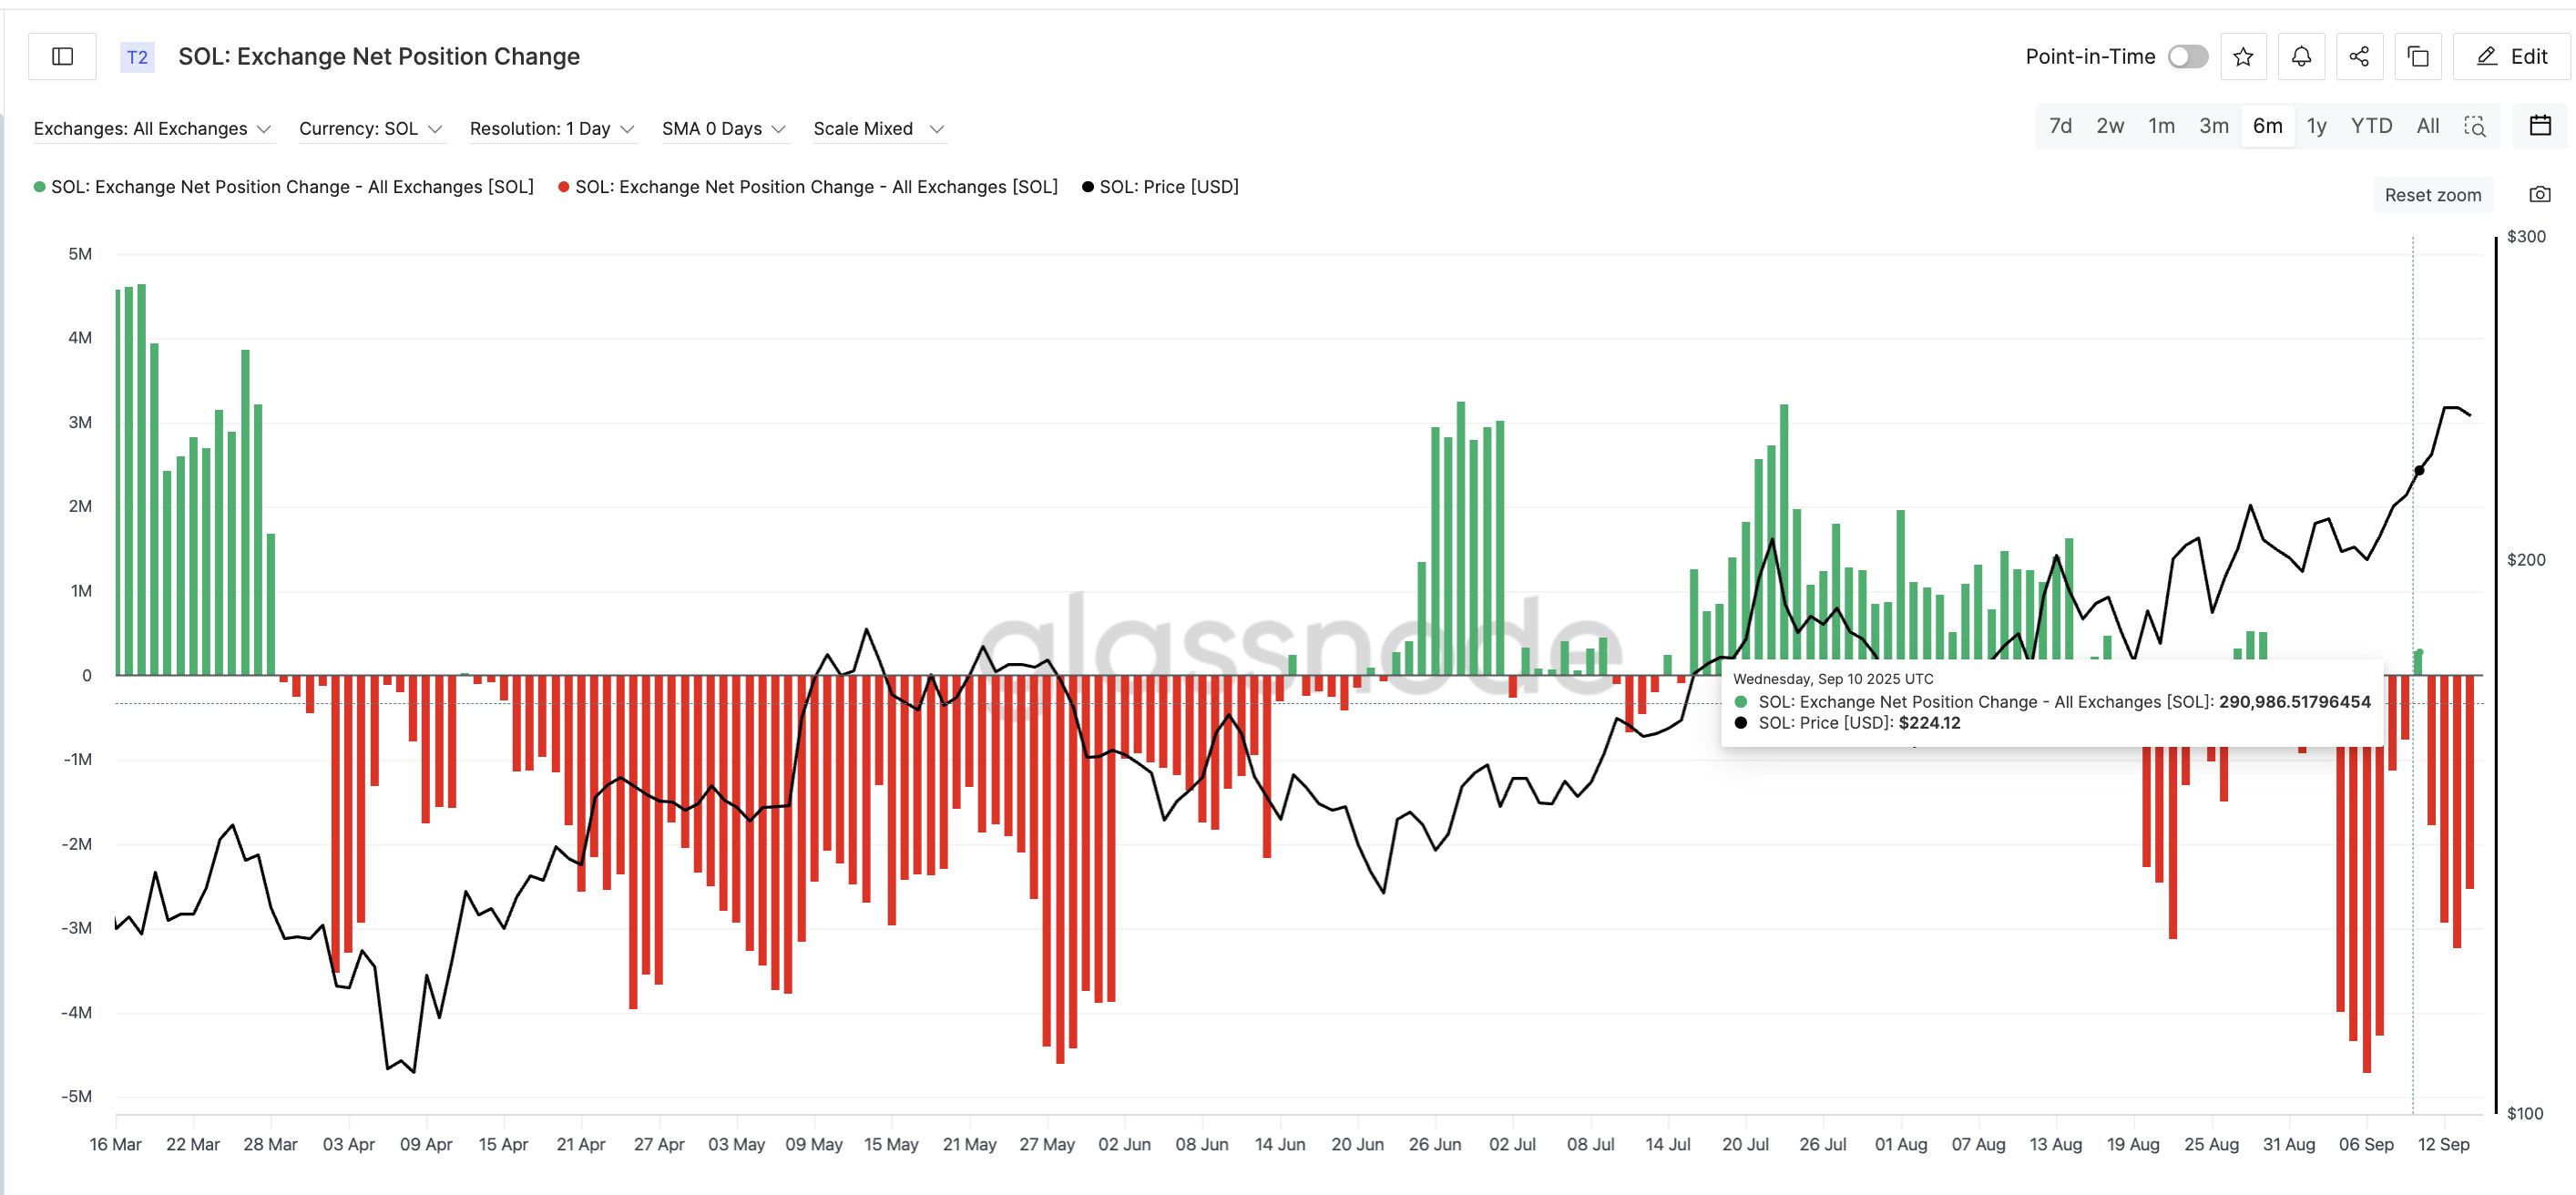
During those earlier local top-induced drops, the exchange net position change turned strongly positive, showing tokens being sent onto exchanges, adding selling pressure.
 SOL Accumulation Continues:
Glassnode
SOL Accumulation Continues:
Glassnode
This time, the opposite is true. Since September 10, exchange balances have been deep in the red, meaning SOL continues to flow off exchanges. Persistent outflows suggest accumulation, not panic selling, which may cushion any pullback.
Bearish Pattern Hints at a Solana Price Dip, but the $284 Path Remains Intact
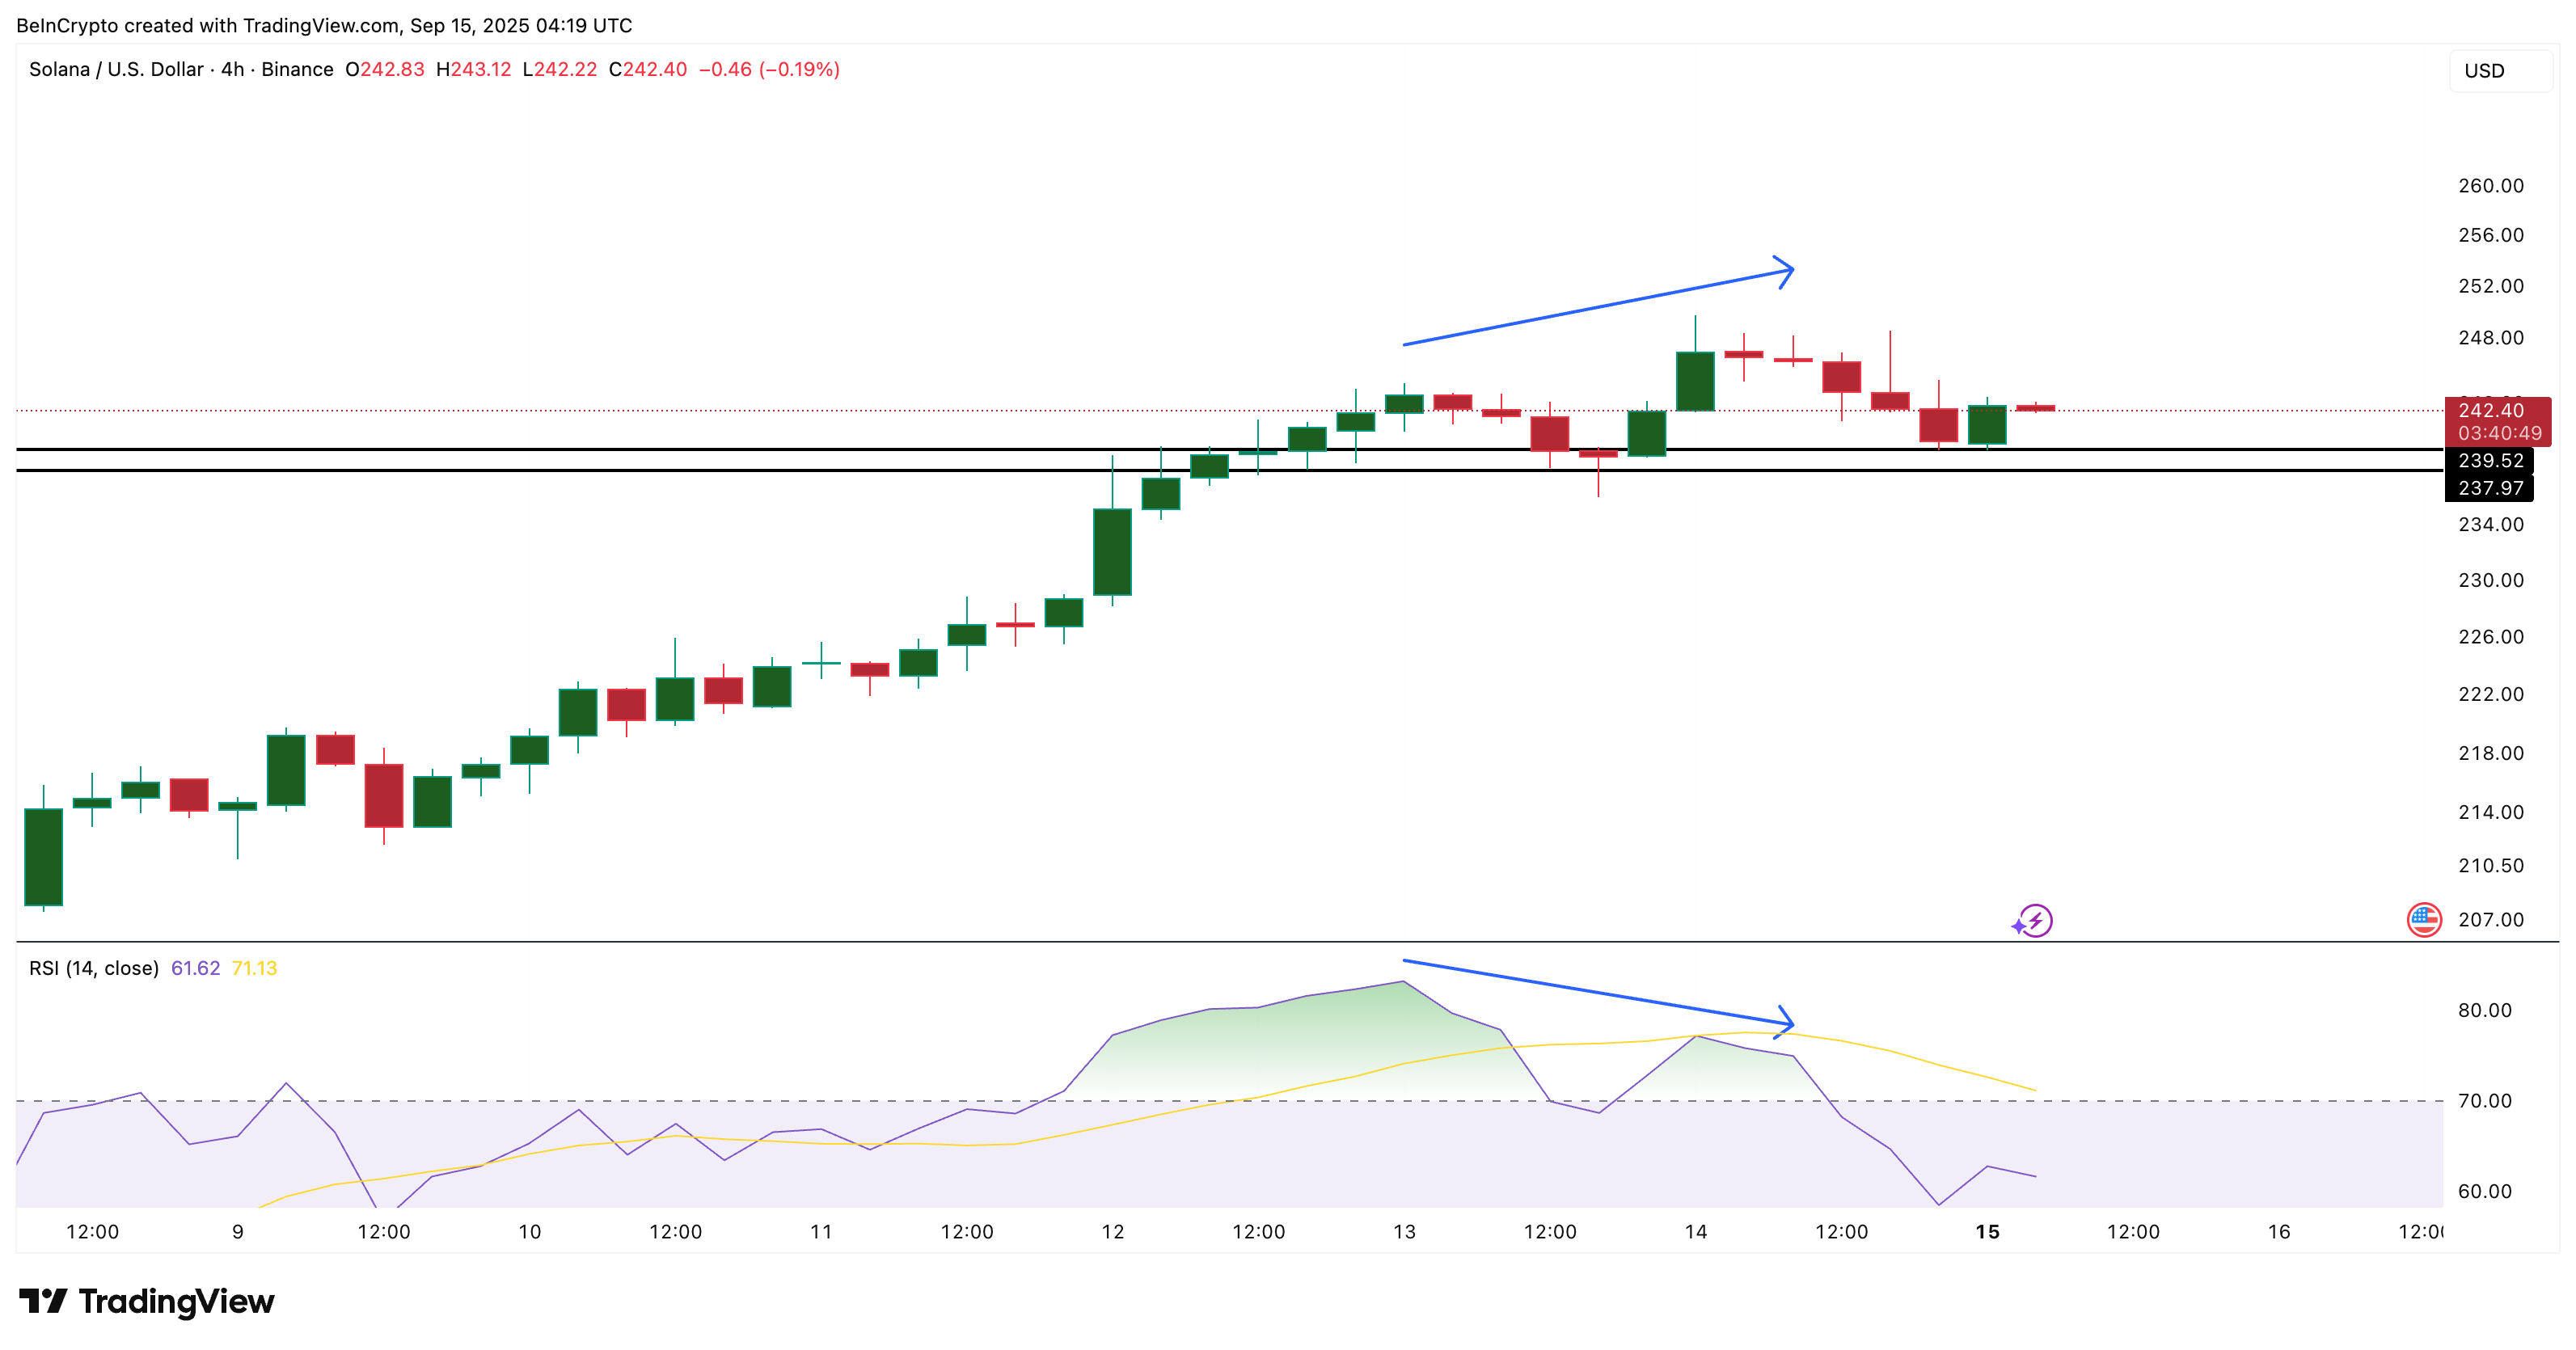
Technical charts add another layer. On the 4-hour chart, Solana shows bearish divergence — price made higher highs, while the RSI (Relative Strength Index), which tracks momentum, made lower highs. On higher timeframes, this pattern often signals trend reversal, but on shorter charts, it usually points to a pullback.
 Solana Price Chart Shows Bearish Divergence:
TradingView
Solana Price Chart Shows Bearish Divergence:
TradingView
The levels to watch are $239 and $237, which align as supports on both 4-hour and daily charts. Now that the MVRV-Z spike and RSI divergence point to a pullback, it is time to check the daily chart closely for key levels.
 Solana Price Analysis:
TradingView
Solana Price Analysis:
TradingView
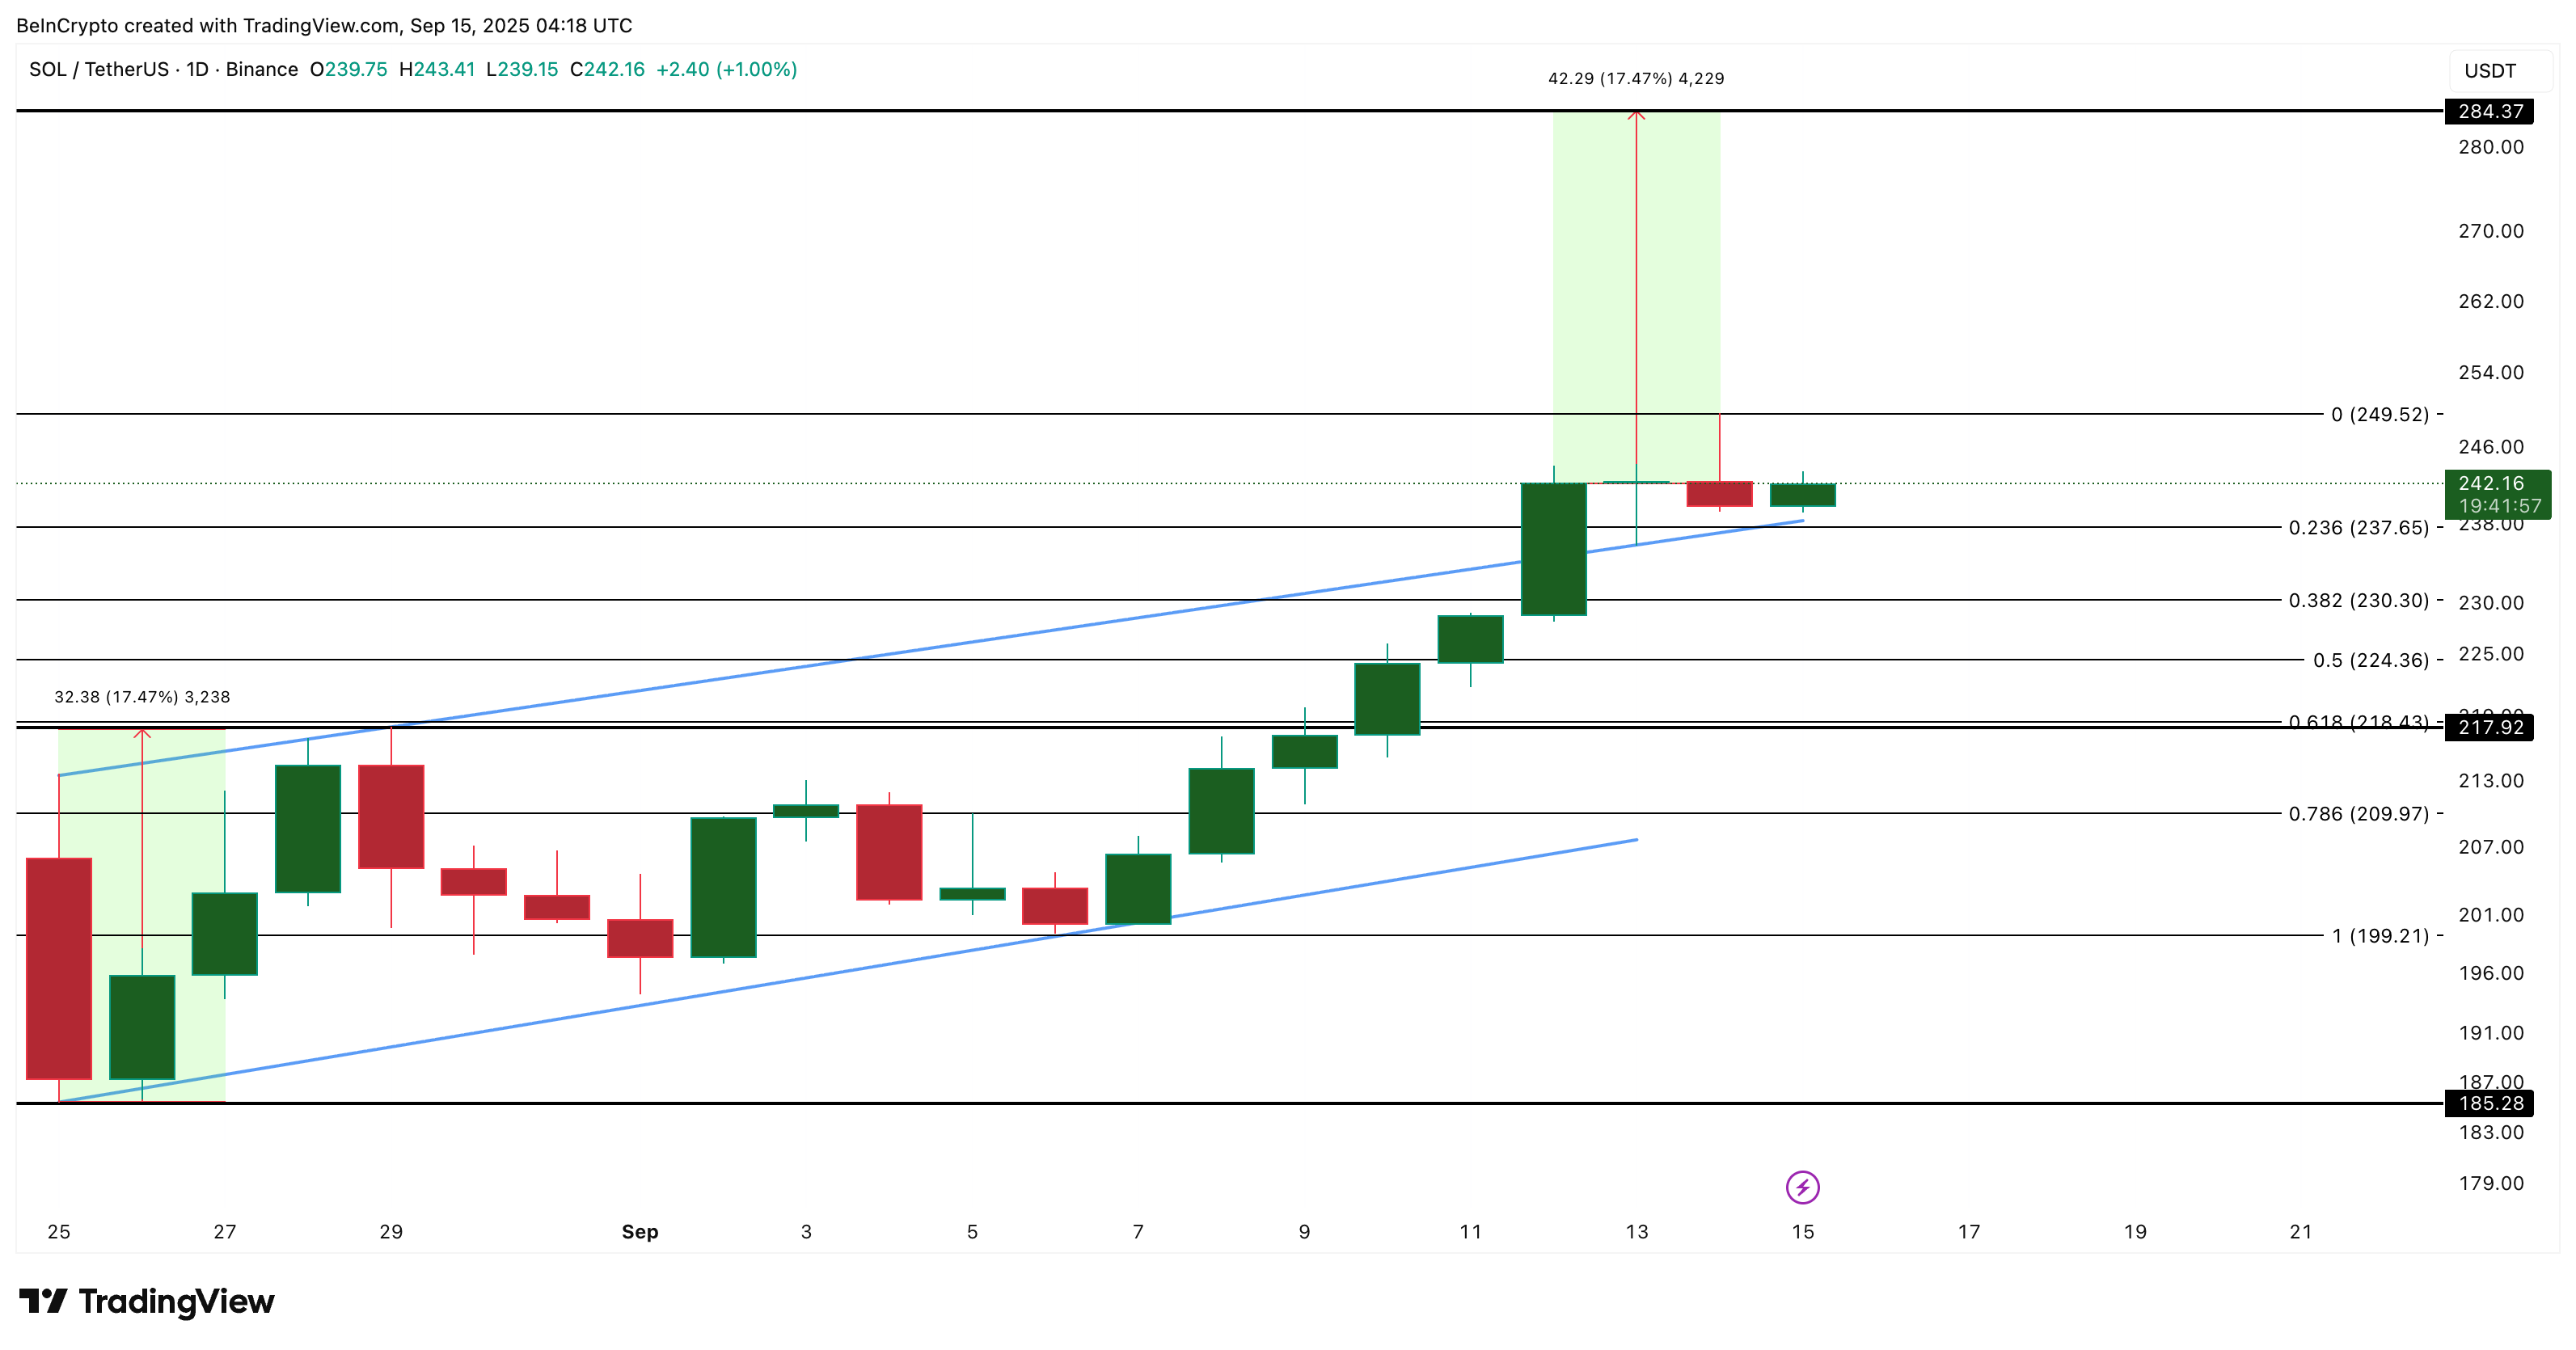
A slip under $237 could bring $230 and $224 into play. Still, the larger breakout remains valid. The Solana price already broke cleanly above its channel, validating the bullish setup we tracked earlier.
The breakout target sits near $284 per the ascending channel target (a 17% rise from the current levels), and unless SOL falls below $199, that target remains intact.
In other words, a dip here may be less of a threat and more of a reset. For now, Solana’s short-term momentum appears to be strained, but the broader rally toward $284 still looks on track.
Disclaimer: The content of this article solely reflects the author's opinion and does not represent the platform in any capacity. This article is not intended to serve as a reference for making investment decisions.
You may also like
Hong Kong’s HKMA Launches Fintech 2030 to Drive Future Financial Innovation

Balancer DeFi Hack: $70.9M in Crypto Stolen
DeFi protocol Balancer suffers a major exploit with $70.9M in crypto drained. Team yet to respond.Funds Moved to New WalletWhat’s Next for Balancer and DeFi Security?

Dogecoin Price Prediction Targets November Surge, While BullZilla Steals the Spotlight Among Best Meme Coin Presales in 2025
BullZilla and Dogecoin battle for investor attention among the best meme coin presales in 2025 as BullZilla’s presale explodes and Dogecoin eyes a recovery from recent declines.Dogecoin Price Prediction: A Chance for a Strong ComebackBullZilla: Exploding Ahead in the Best Meme Coin Presales in 2025Conclusion
Bitcoin Dips as Whale Sales Trigger $414M in Liquidations
Crypto markets dip as whales sell $2B in BTC, leading to $414M in liquidations amid rising geopolitical risks.Liquidations Top $414M as Sentiment Turns FearfulMarket Cap Falls Amid Uncertainty