- Pepe fell 4.8, and hit its $0.00001066 support, which supports the significance of this level in short-term positioning.
- Price is kept at $0.00001168 and repeated tests indicate that the price is the main ceiling impeding the upward movement.
- The RSI around 34.96 and the bearish MACD values are indications of over selling hence there could be accumulation of a breakout when the momentum changes.
Pepe posted a strong decline in its latest trading session, pulling back while remaining in accordance with set technical levels. The token currently trades at $0.00001066, which is 4.8% down over the last 24 hours. Price action is still confined to a close range, with short-term support at $0.00001066 and resistance at $0.00001168. Market analysts continue to observe the existing interaction with these levels, particularly with short-term indicators that reflect increased volatility and probable directional shifts.
Price Pullback Defines Immediate Market Tone
The 4.8% drop over 24 hours put Pepe right on its support base at $0.00001066, and the significance of the level. The fact that the support and current prices are close to each other shows that pressure is exerted on the lower end of the trading range.
Nevertheless, even with the fall, the action in the day has been within the set range of 24 hours, which symbolizes consolidation as opposed to an imminent fracture. It is still the correlation of current levels and the predetermined support that defines the market positioning in the nearest future.
Resistance Remains the Key Market Barrier
On the upper end, resistance at $0.00001168 persists as the ceiling for short-term movements. This level has restricted upward progress in recent sessions, holding price within a compressed structure. Notably, repeated tests near this area underscore its significance in shaping future moves. The inability to close above this barrier has confined Pepe to a narrow path, maintaining a balance between short-term selling and buying activity. The contrast between pressure at support and resilience at resistance outlines the current tight structure.
Technical Structure Suggests Possible Breakout Setup
Charts illustrate a longer descending trendline that Pepe has approached multiple times during recent months. The most recent move toward this line coincides with heightened attention to momentum indicators.
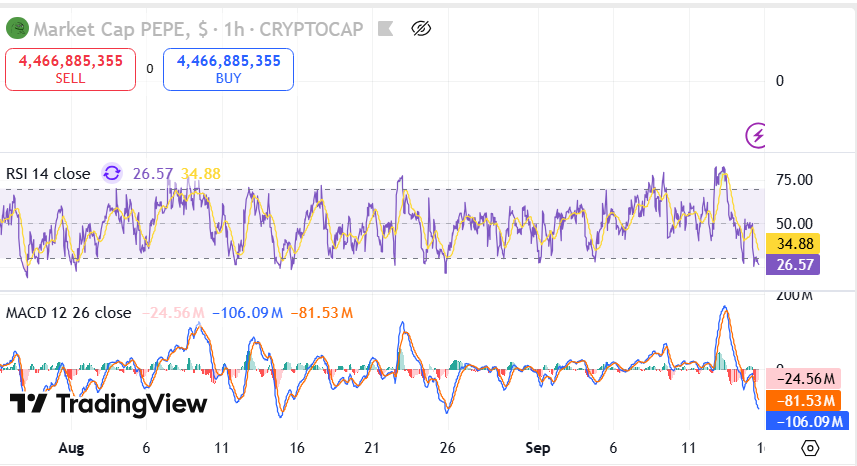 Source: TradingView
The Relative Strength Index (RSI) is currently near 34.88, with lower dips reaching 27.66, reflecting oversold conditions in shorter intervals. Additionally, the MACD chart shows notable negative values, including -23.2M on the histogram, reinforcing the pullback sentiment.
Despite the short-term weakness, the broader setup indicates consolidation near critical thresholds. Market commentary highlights that “When $PEPE breaks out, it will go vertical. Position or watch it happen.” This outlook emphasizes the structural alignment between defined support, resistance, and long-term trend levels that continue to shape trader focus.