Nervousness still pervades the market ahead of a US interest rate cut on Wednesday. Despite this, $XRP, $SUI, and $AVAX are among the first to emerge for a possible altcoin rally.
$XRP triangle breakout continues
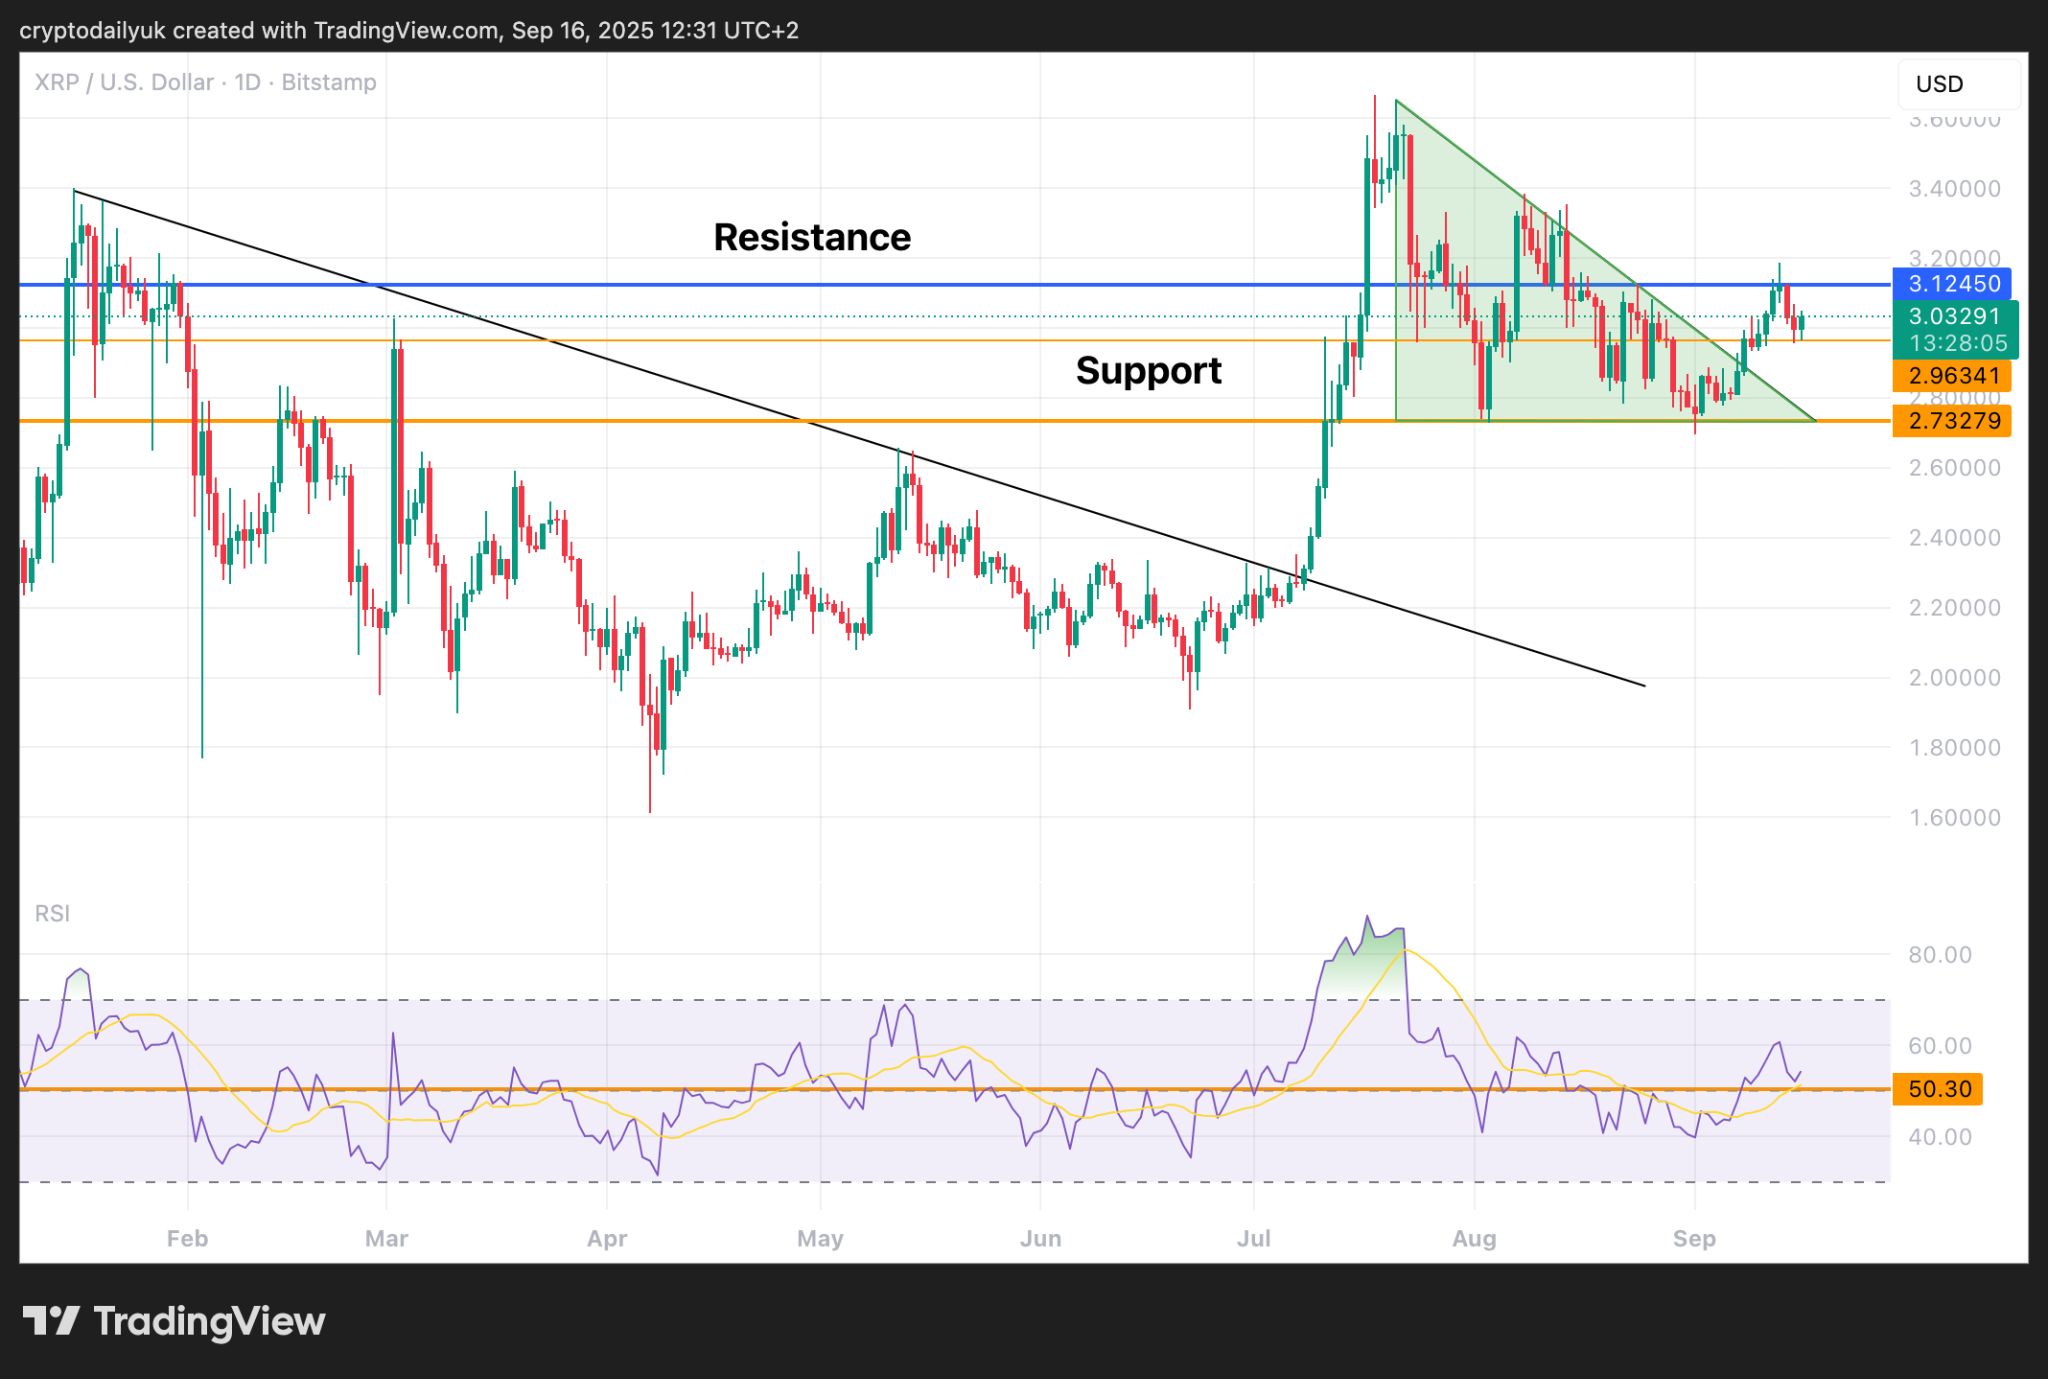
Source: TradingView
The daily chart for $XRP reveals that the price has potentially bottomed at the $2.96 horizontal support level. A small bounce has occurred from there, and it might be expected that this continues at least up to the $3.12 resistance level. Having not long emerged from a descending triangle formation (green triangle) the price is still possibly in the process of heading up to the measured move of the triangle, which would be close to the all-time high of $3.66.
At the bottom of the chart, the RSI shows that the indicator line is bouncing from the 50.00 level, which has acted many times as support and resistance. As long as the indicator line stays above this level the bounce should continue.
Three tasks for $SUI bulls
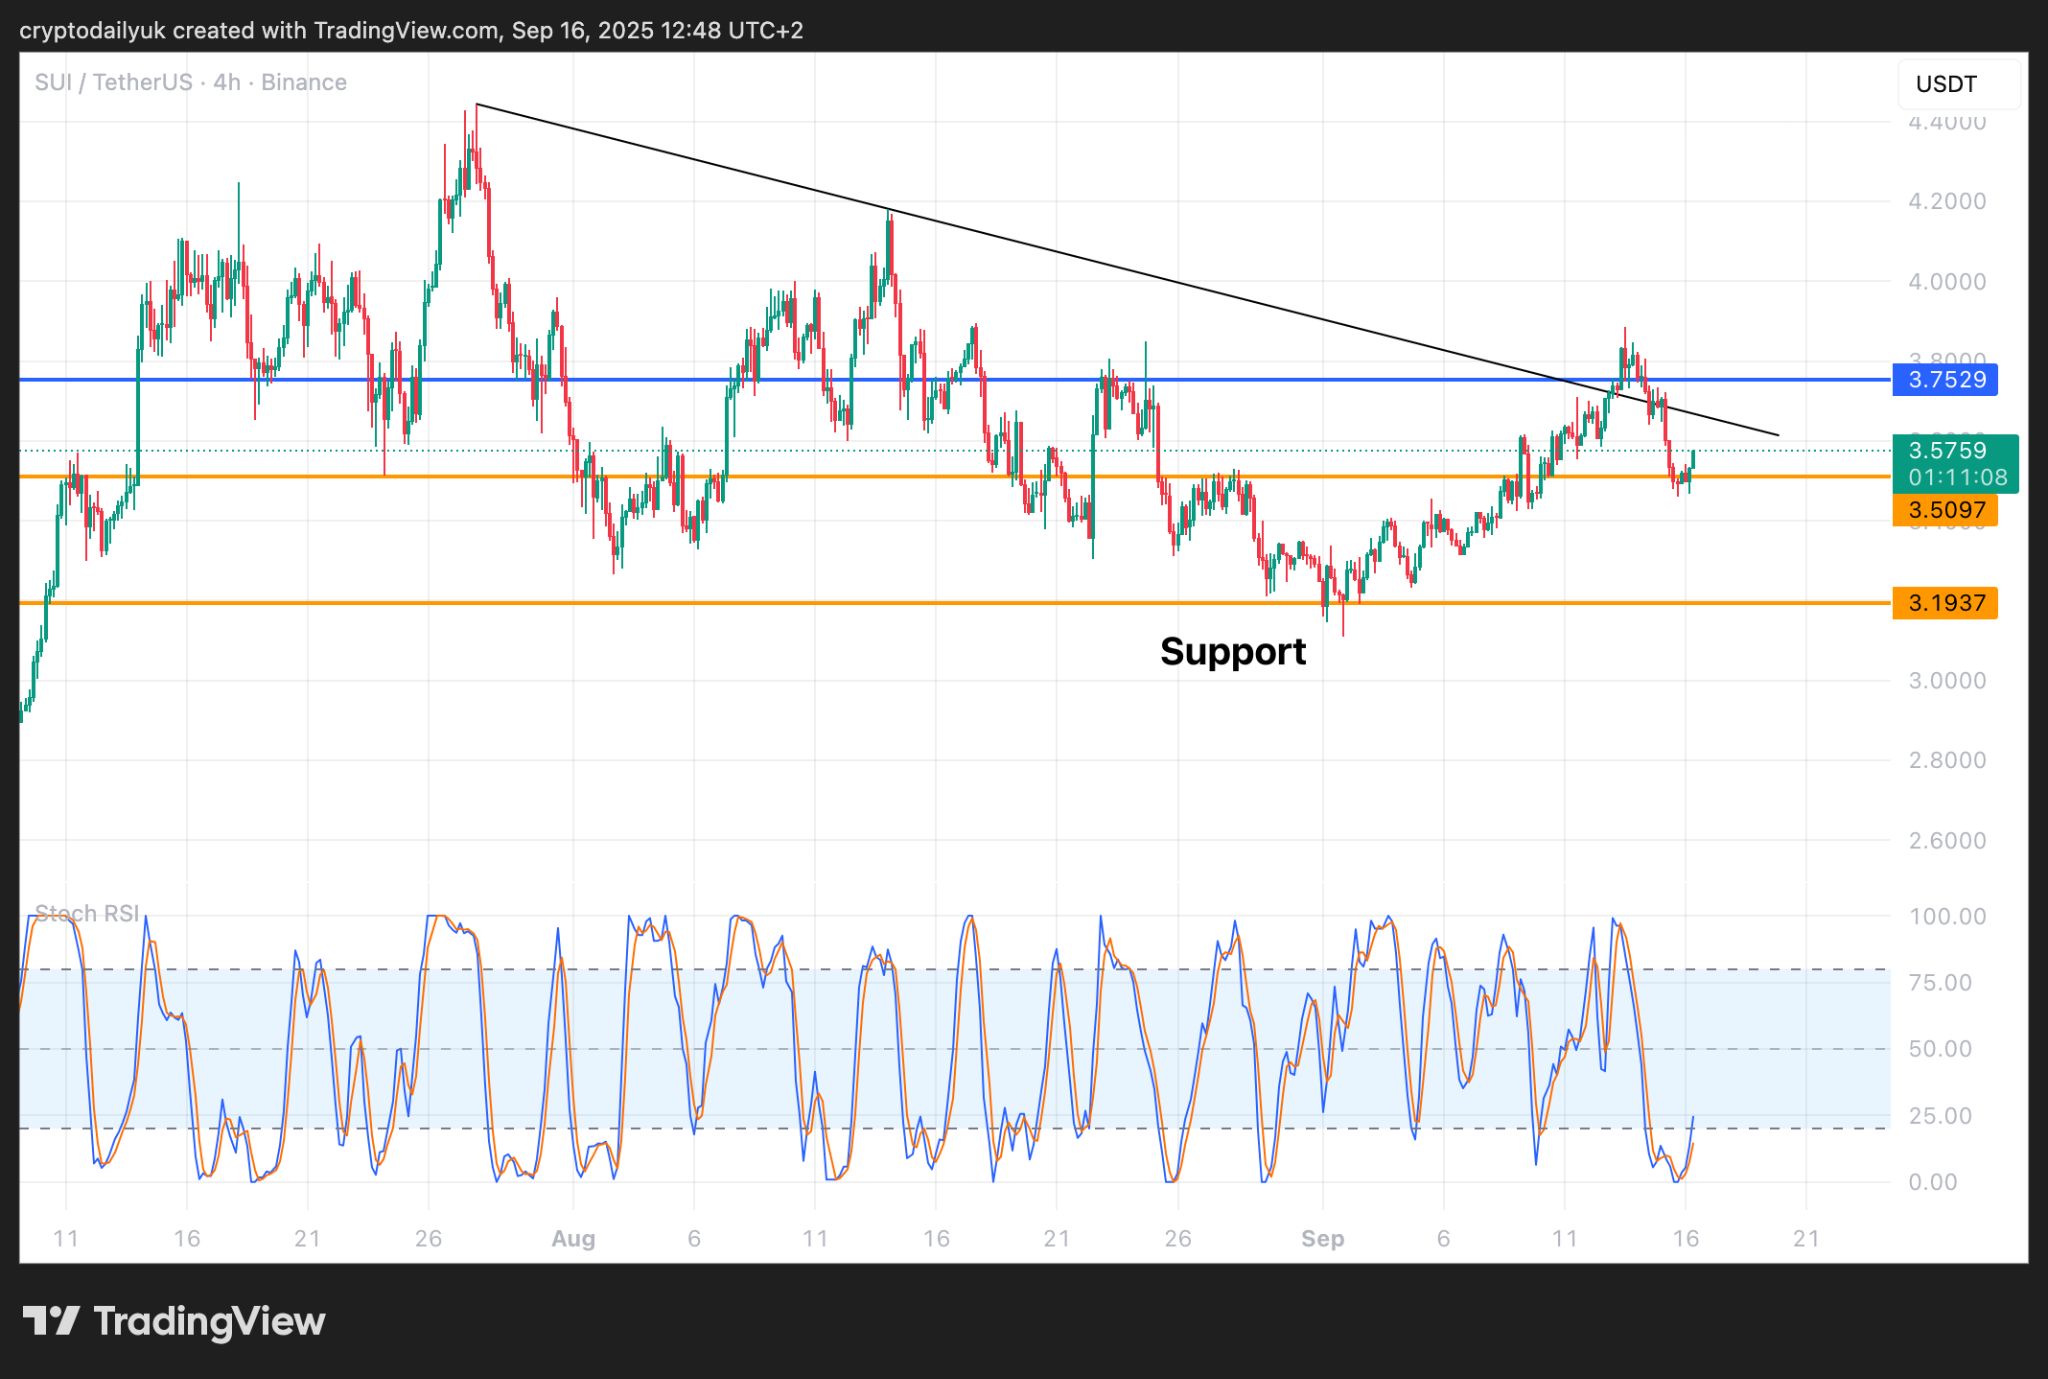
Source: TradingView
The $SUI price has recently bounced from a good level of support at $3.50. The price should head back to the descending trendline where a fakeout occurred over the weekend.
Three tasks now confront the $SUI bulls. First one is to confirm above the ascending trendline. Second, a confirmation is needed above the $3.75 horizontal resistance, and thirdly, a higher high above $3.88 needs to take place. This is also a horizontal resistance level.
At the bottom of the chart, the Stochastic RSI indicators are in prime position to signal the upside price momentum needed to take the $SUI price through these obstacles. Also, the 8-hour and 12-hour Stochastic RSIs are also at the bottom - a bullish setup.
$AVAX at key resistance
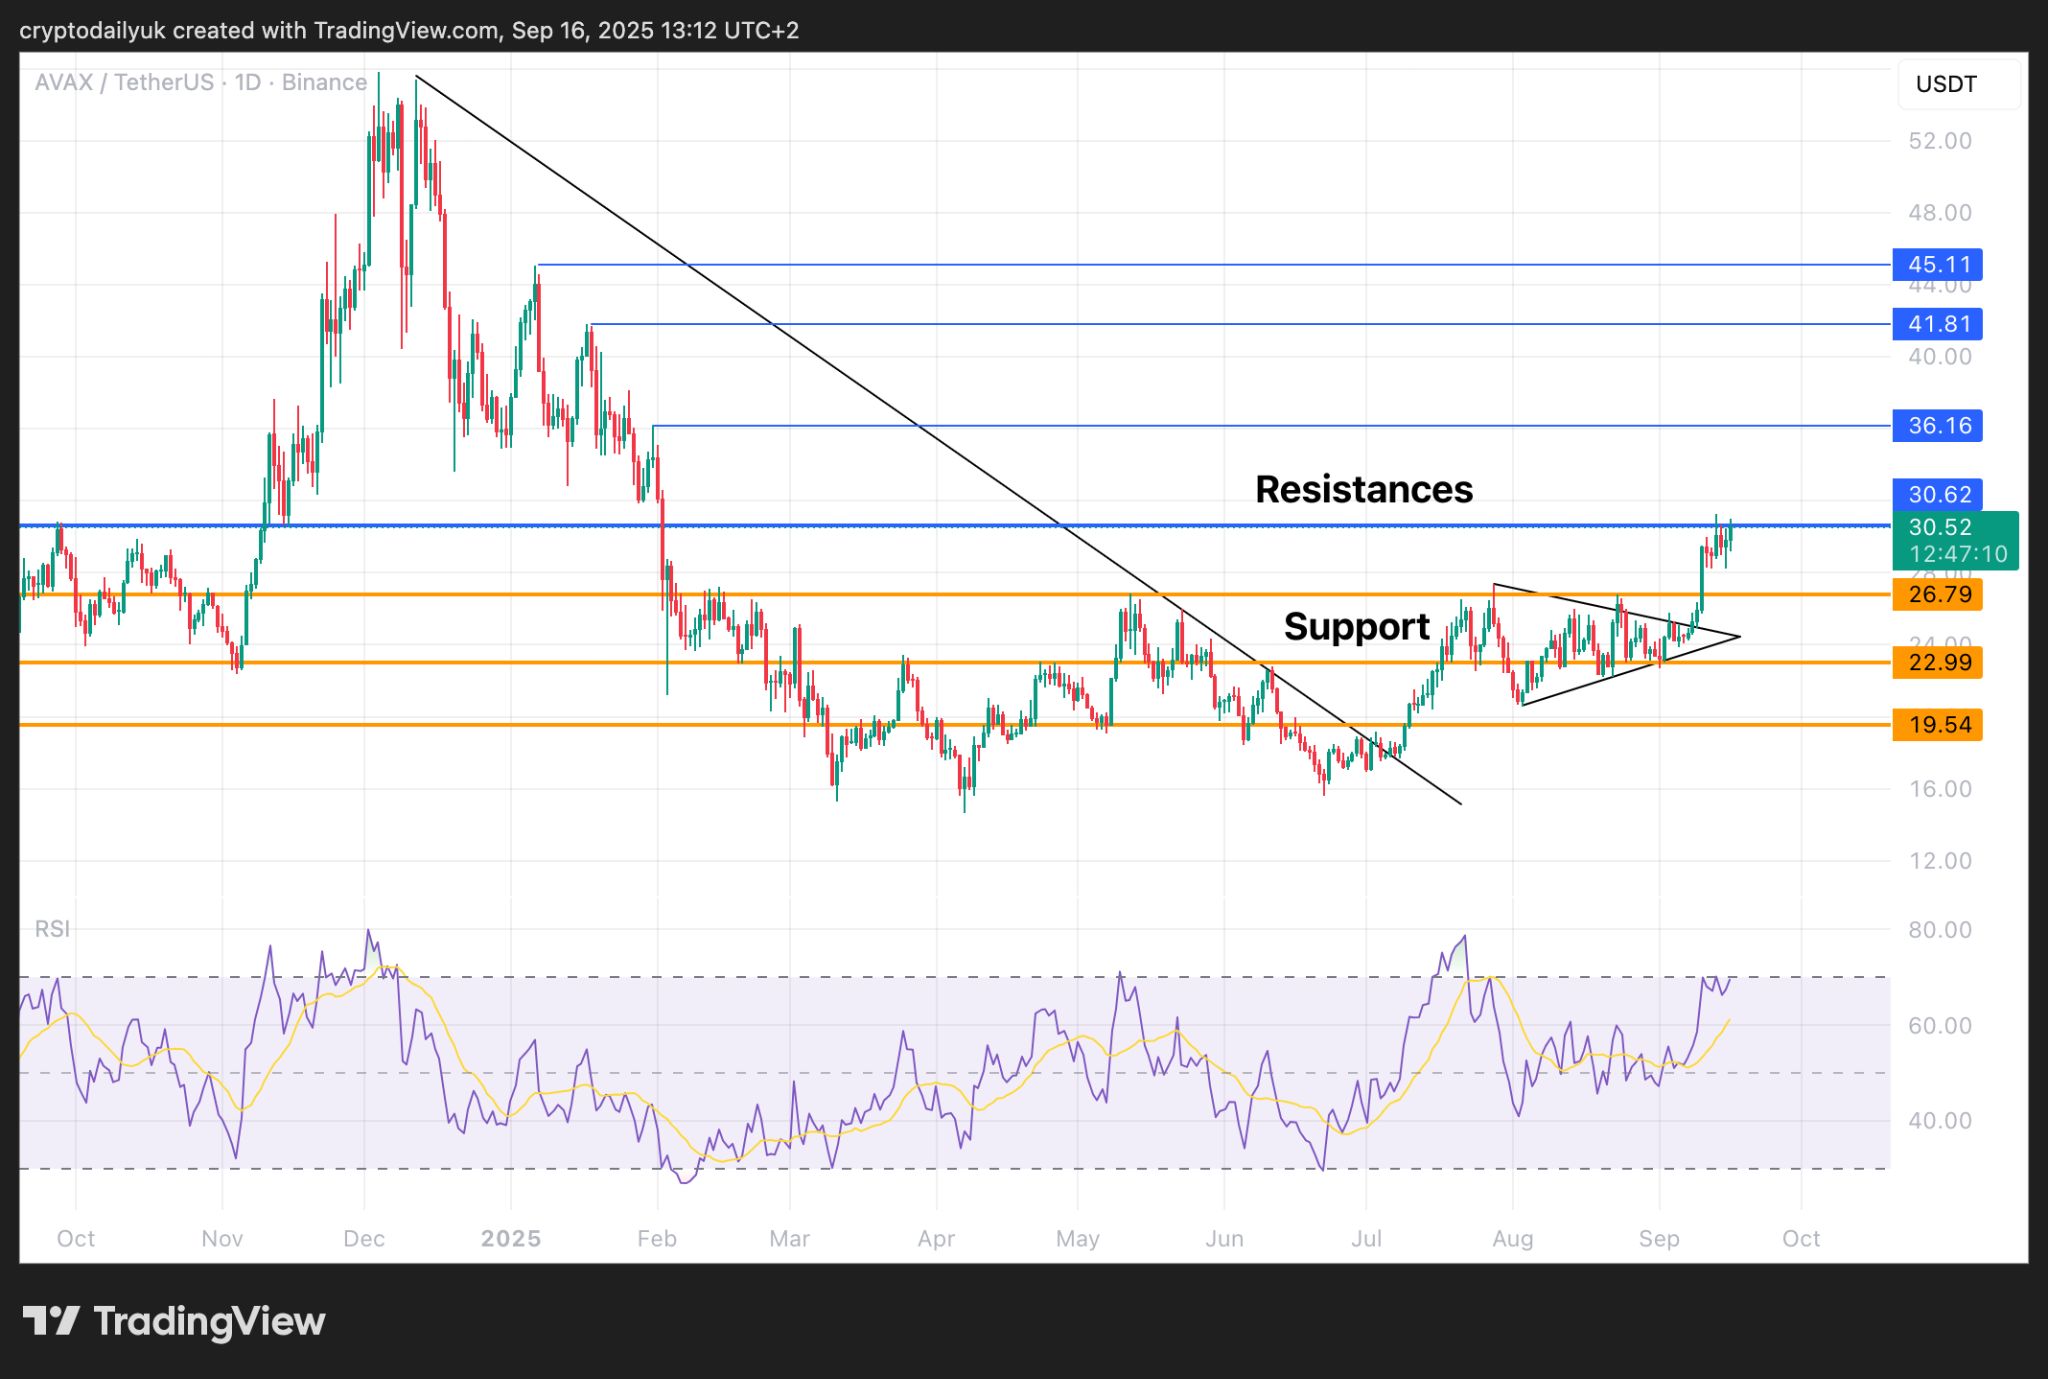
Source: TradingView
The $AVAX price is in an uptrend after breaking out of a downtrend that had been in force since December 2024. The $AVAX price now finds itself up against a strong level of resistance at $30. Breaking through here and confirming above would leave the path open to further gains. The targets for these are in the chart above.
At the bottom of the chart, the RSI indicator is tapping at the 70.00 level which generally holds as resistance. A breakout here would likely coincide with a breakout in the price action. The indicator would need to get above the last high at 78.60 in order to annul bearish divergence.