Bitcoin “Flag” Flies High as Price Eyes $122,000 — But There’s a Catch

Bitcoin price is trading near $115,700 after a 3.2% weekly gain. A bull flag breakout points toward $122,000, but on-chain data shows a 714,302 BTC supply wall could slow momentum. Holder buying alongside heavy exchange outflows adds conviction, yet $115,000 remains the key invalidation level.
Bitcoin’s price is currently trading near $115,700 after a steady climb of 3.2% over the past seven days. A key bullish pattern has just flashed on the charts, hinting at higher levels ahead.
But the move may not be straightforward — hurdles remain that could slow the momentum.
Exchange Outflows Build, but One Key Group Surprises
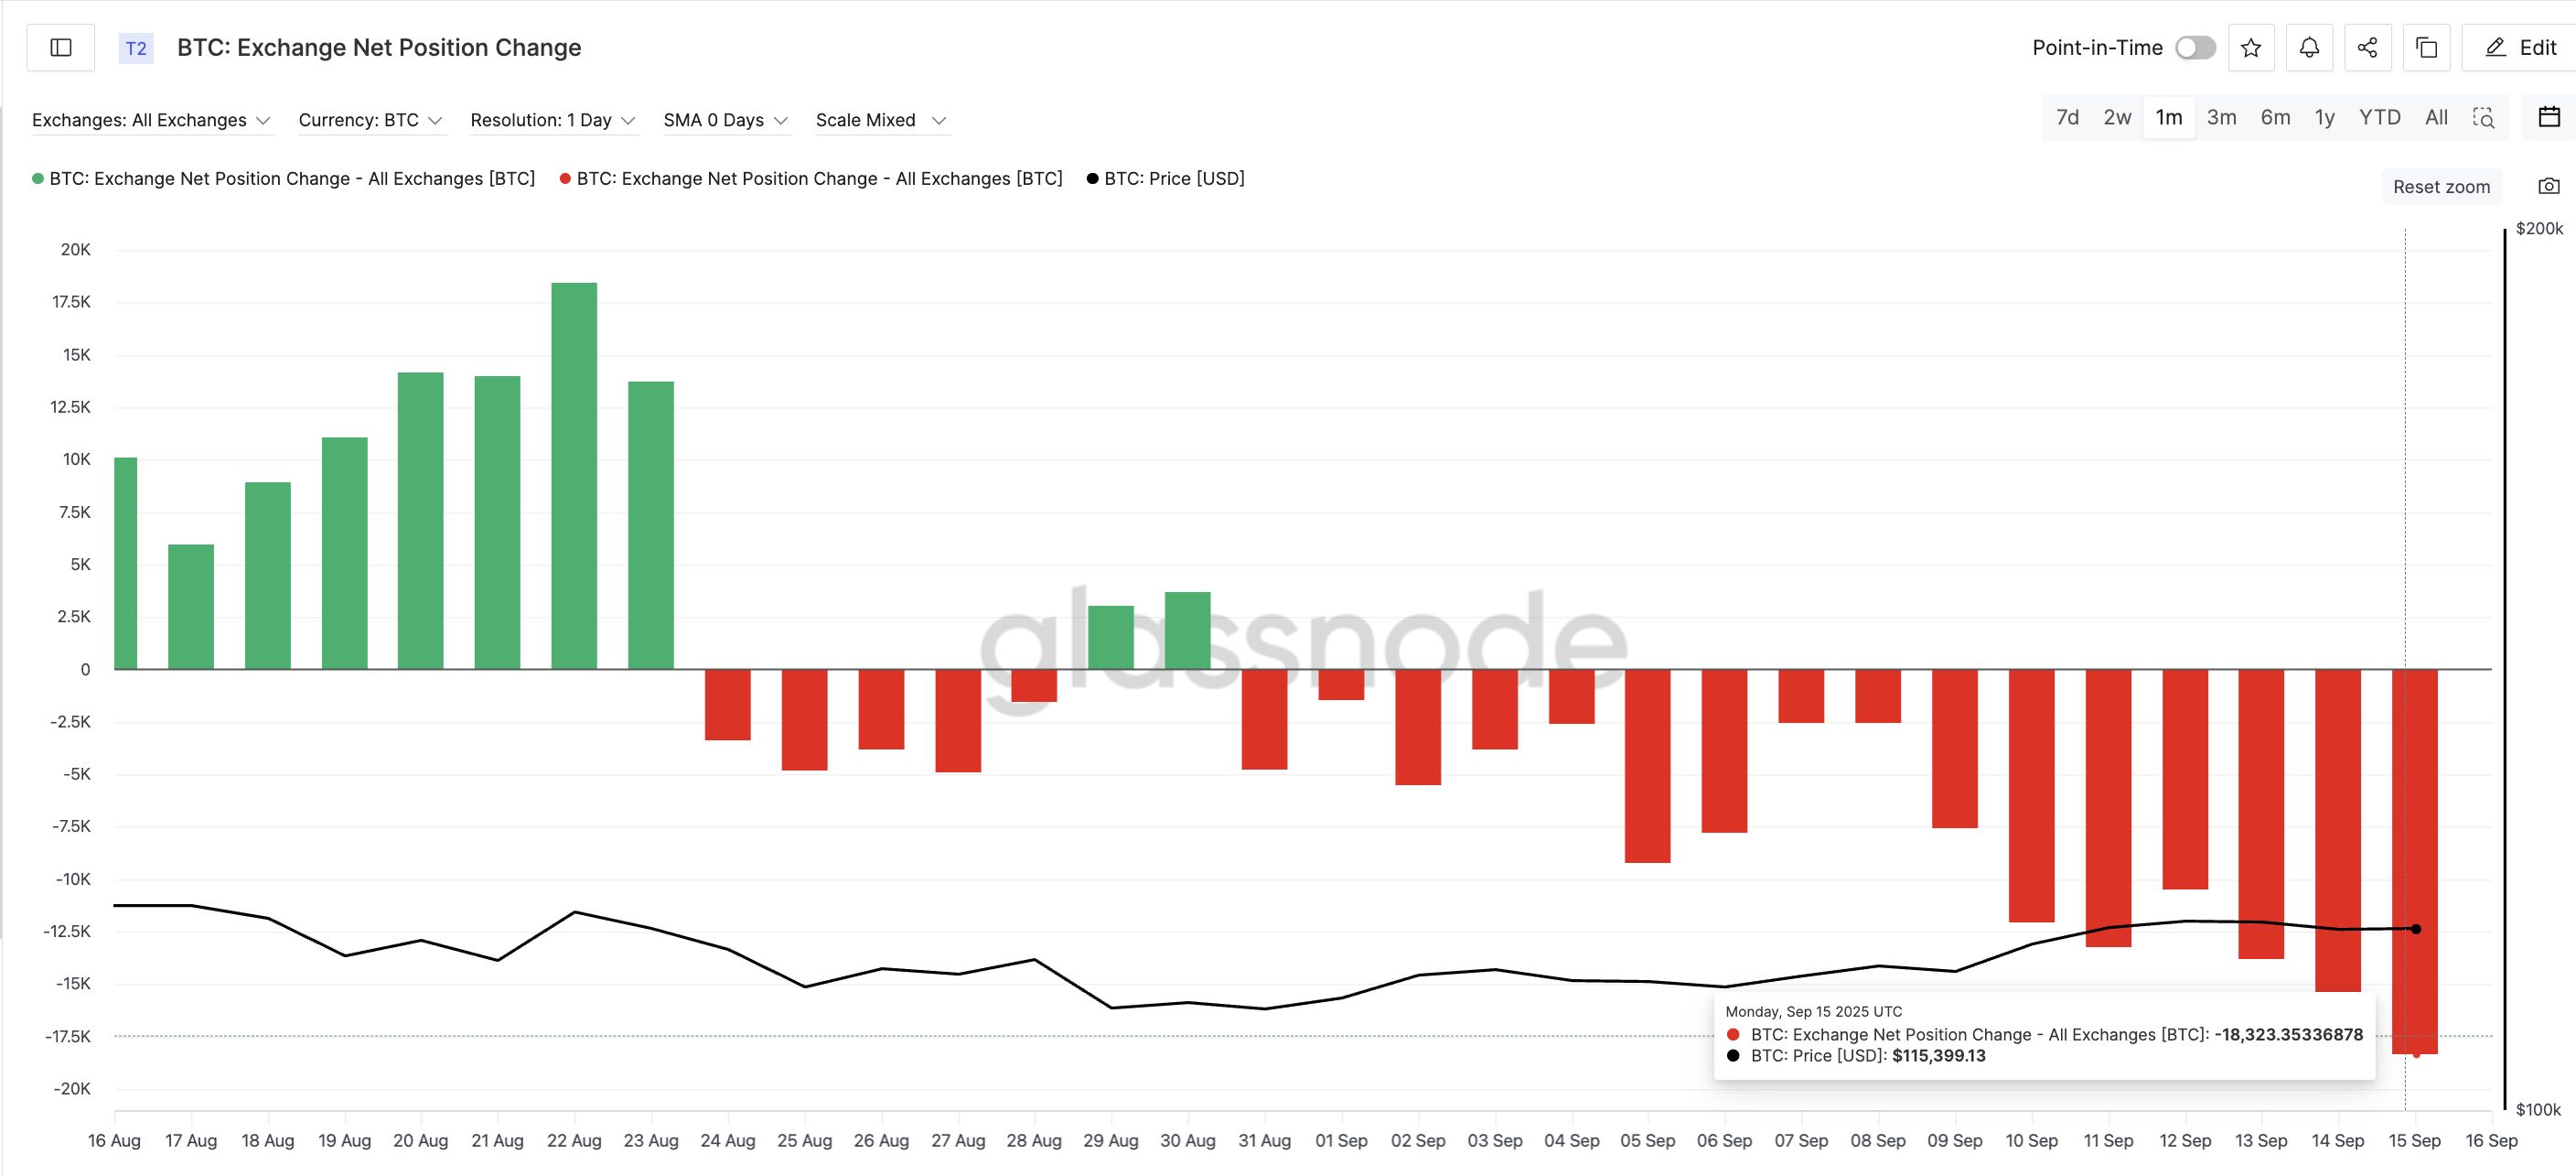
On-chain data shows strong accumulation running in parallel with the recent uptrend. Exchange net position change — which tracks the flow of coins in and out of trading platforms — turned sharply negative over the past week.
It fell from –2,531 BTC on September 8 to –18,323 BTC on September 15, a more than 620% increase in outflows. Negative values mean more Bitcoin is leaving exchanges, often a sign that coins are being moved into storage rather than prepared for sale.
Want more token insights like this? Sign up for Editor Harsh Notariya’s Daily Crypto Newsletter
 Bitcoin Buying Pressure Intensifies:
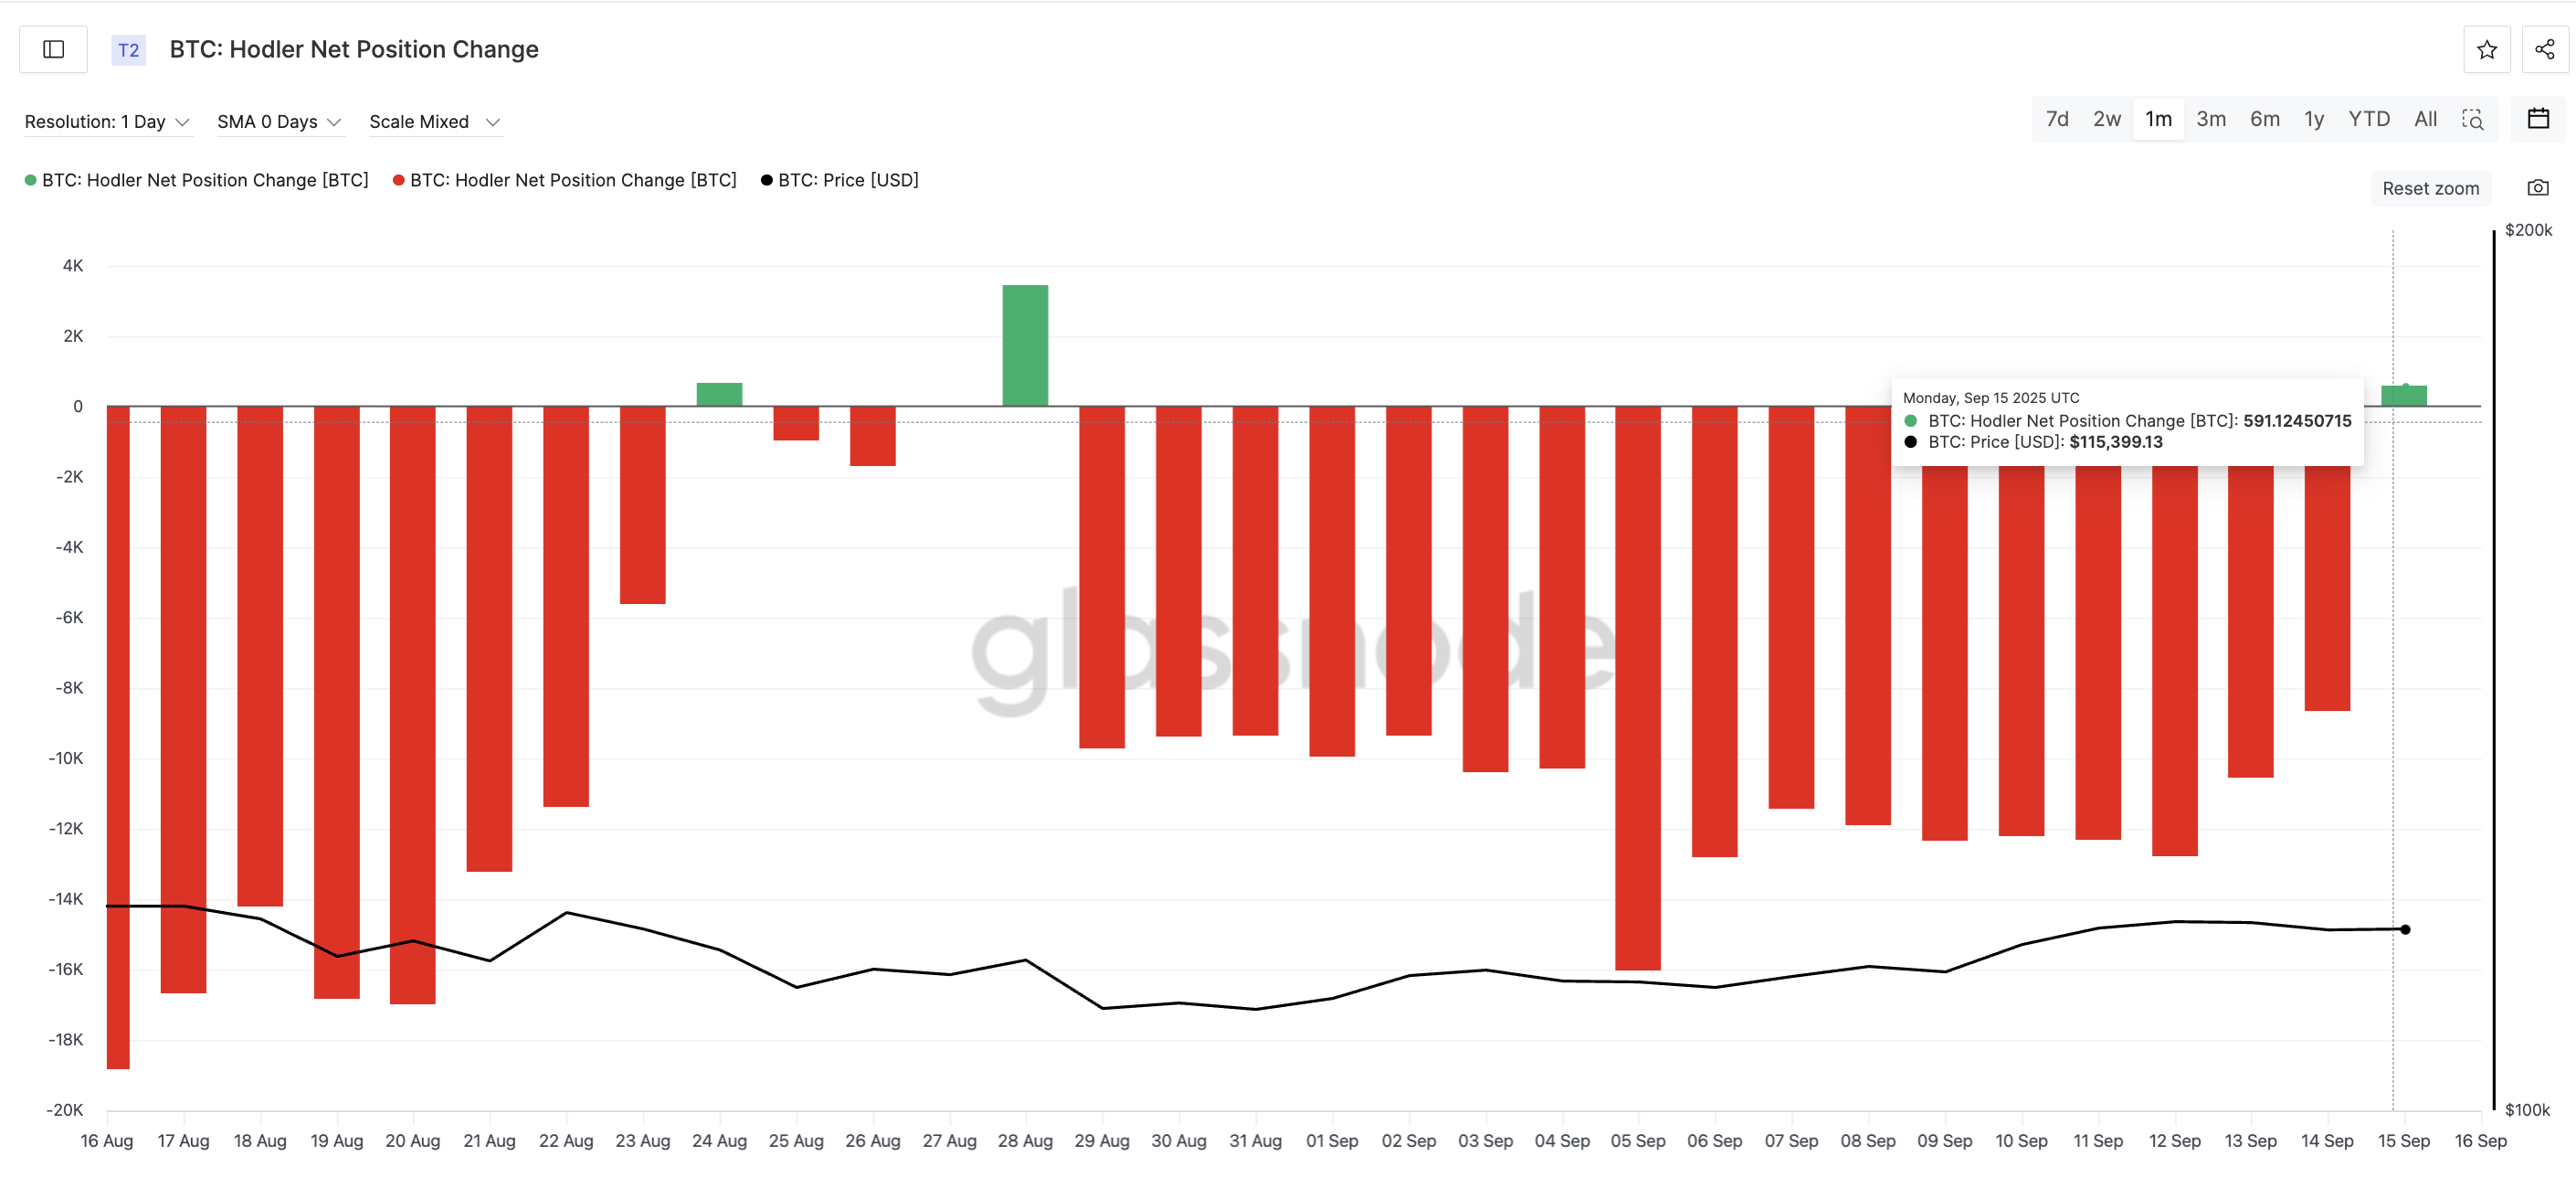
What makes this unusual is that long-term holders have also stepped in. The Hodler net position change metric, which shows the supply held by long-term investors, flipped from –8,652 BTC to +591 BTC between September 14 and September 15, exactly as the price pattern began shaping up. More about the bullish pattern later in the piece.
 Long-Term Holders Are Finally Buying:
This positive flip is significant because long-term holders are usually in profit at these levels and tend to sell.
Their decision to add instead of sell shows conviction in the expected breakout theory and complements the broader outflow trend. Together, the two metrics point to stronger market confidence than retail buying alone could suggest. And this level of confidence right before the expected Fed rate cuts isn’t purely coincidental.
Bitcoin Price Flag Hints at Breakout — But Not Without Hurdles
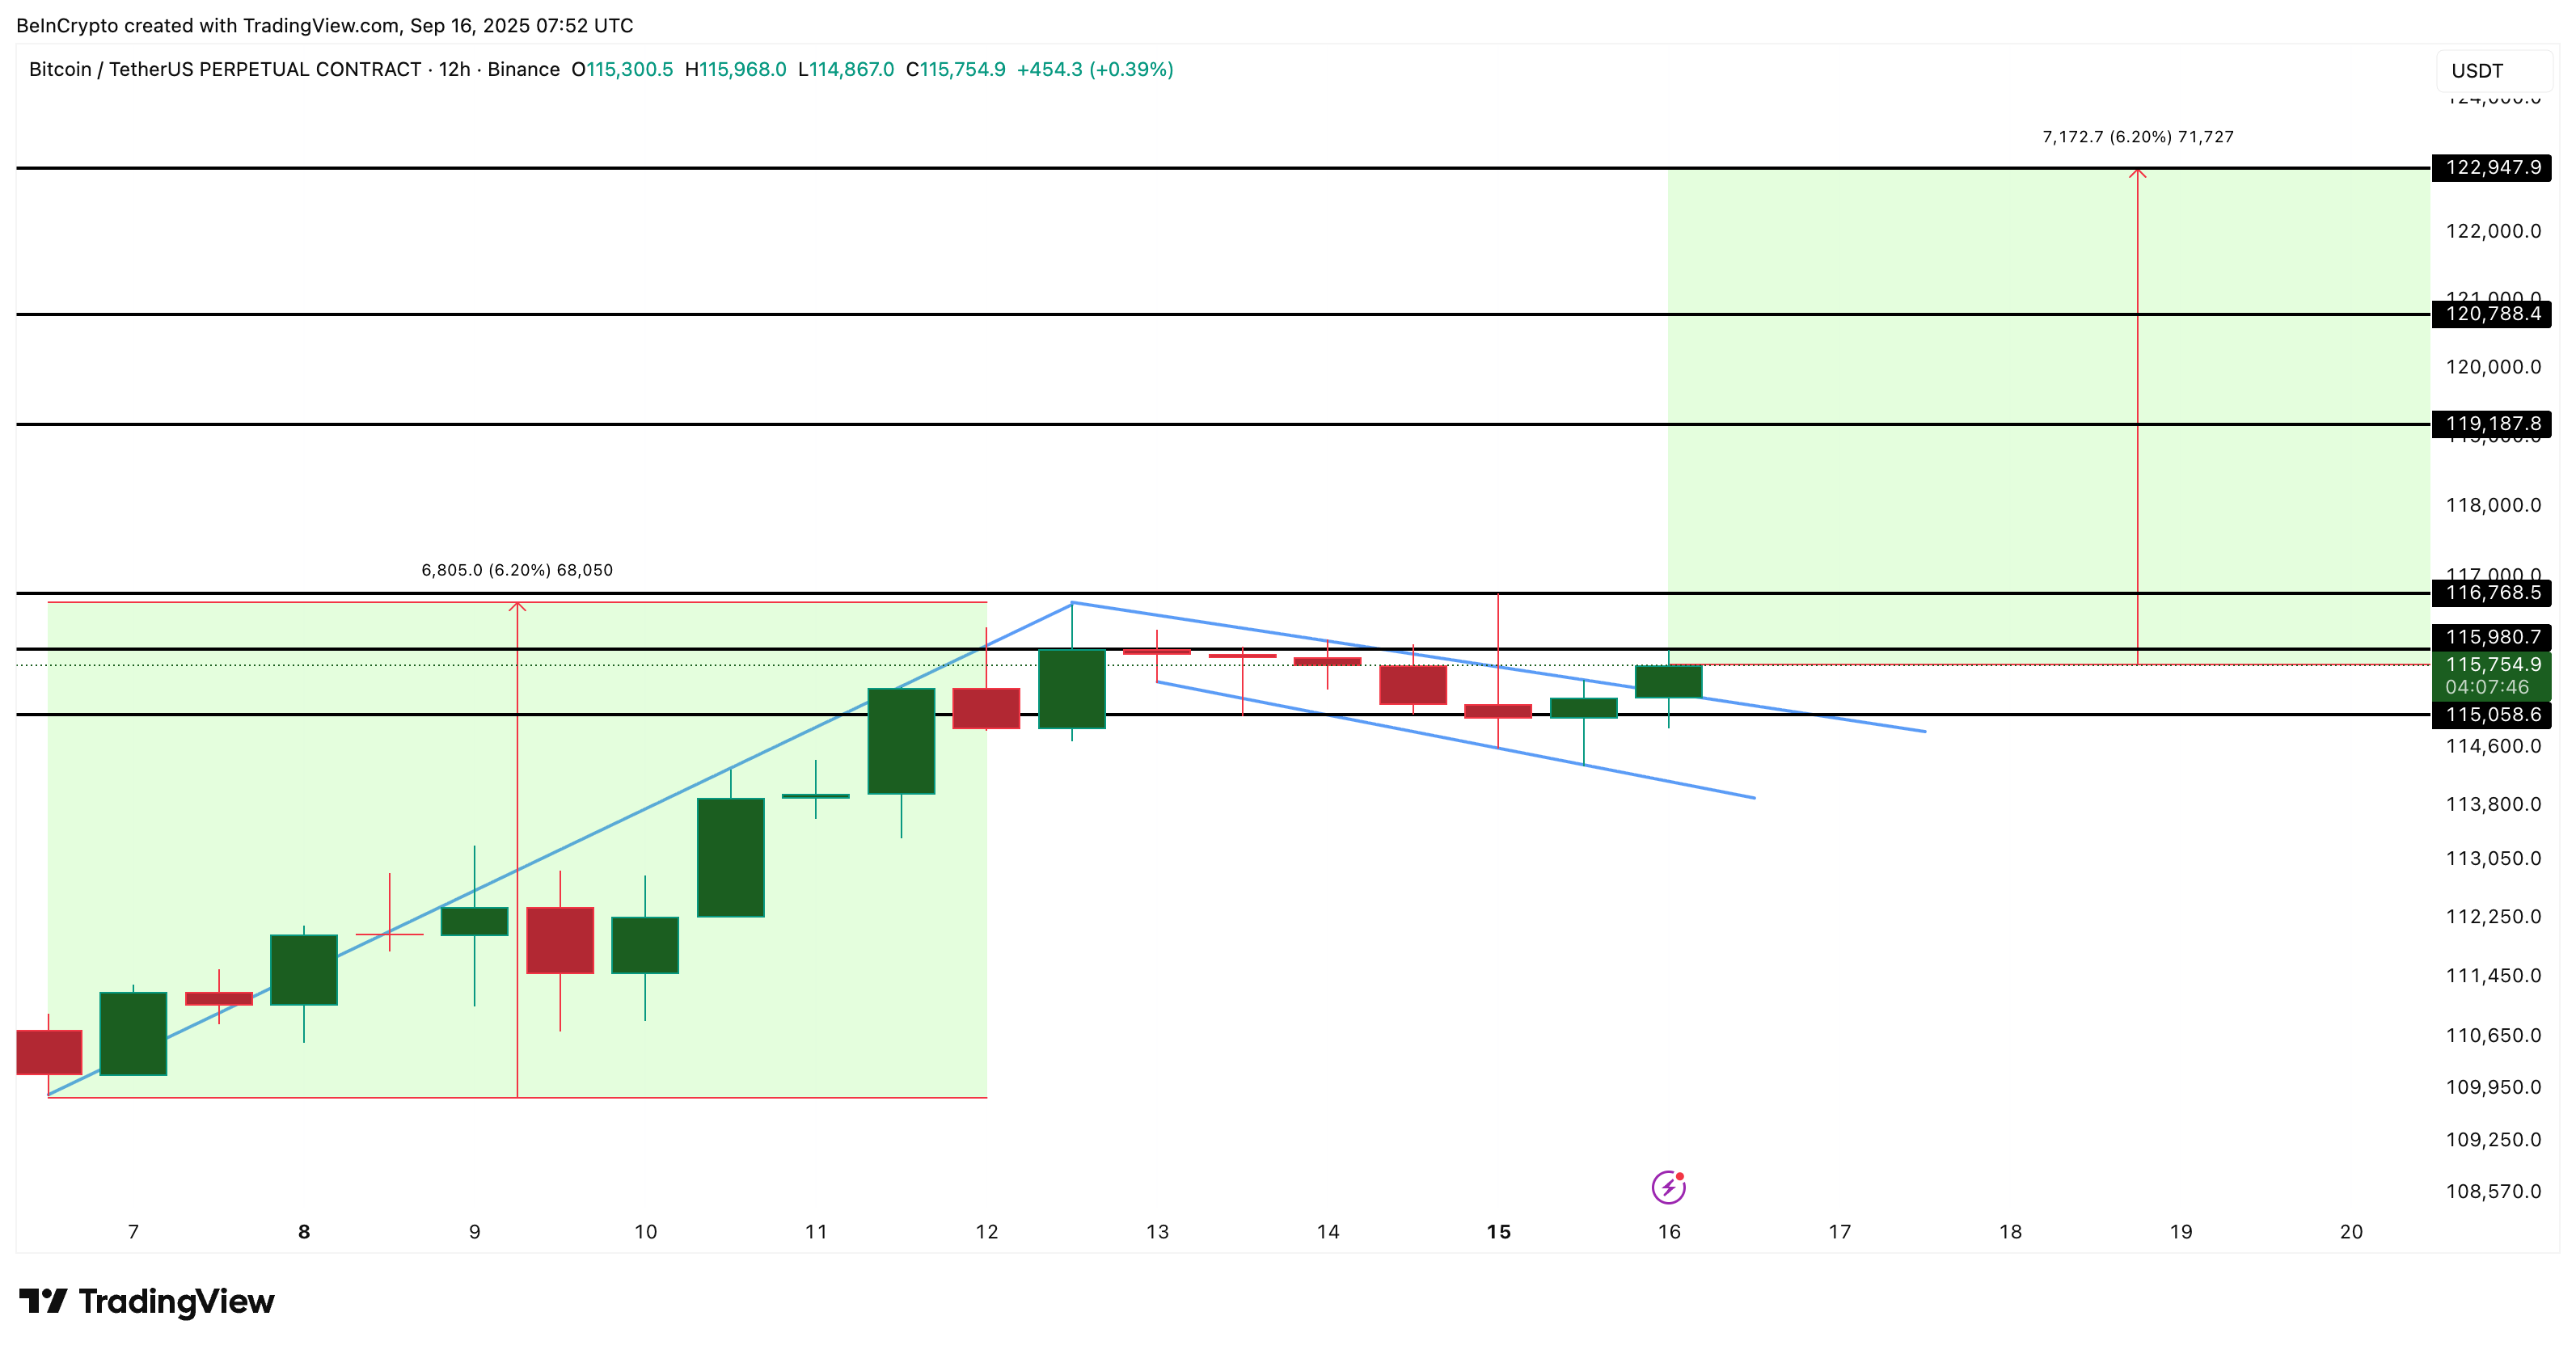
The chart pattern in play is a bull flag, a classic continuation signal. Bitcoin recently touched $115,900 on the 12-hour chart, setting the stage for a potential breakout, before pulling back to $115,700 at press time.
If confirmed with a strong close above the upper trendline of the flag (which currently holds at press time), the measured target projects to over $122,000. Intermediate resistance levels include $116,700 and $120,700.
 BTC Price Analysis:
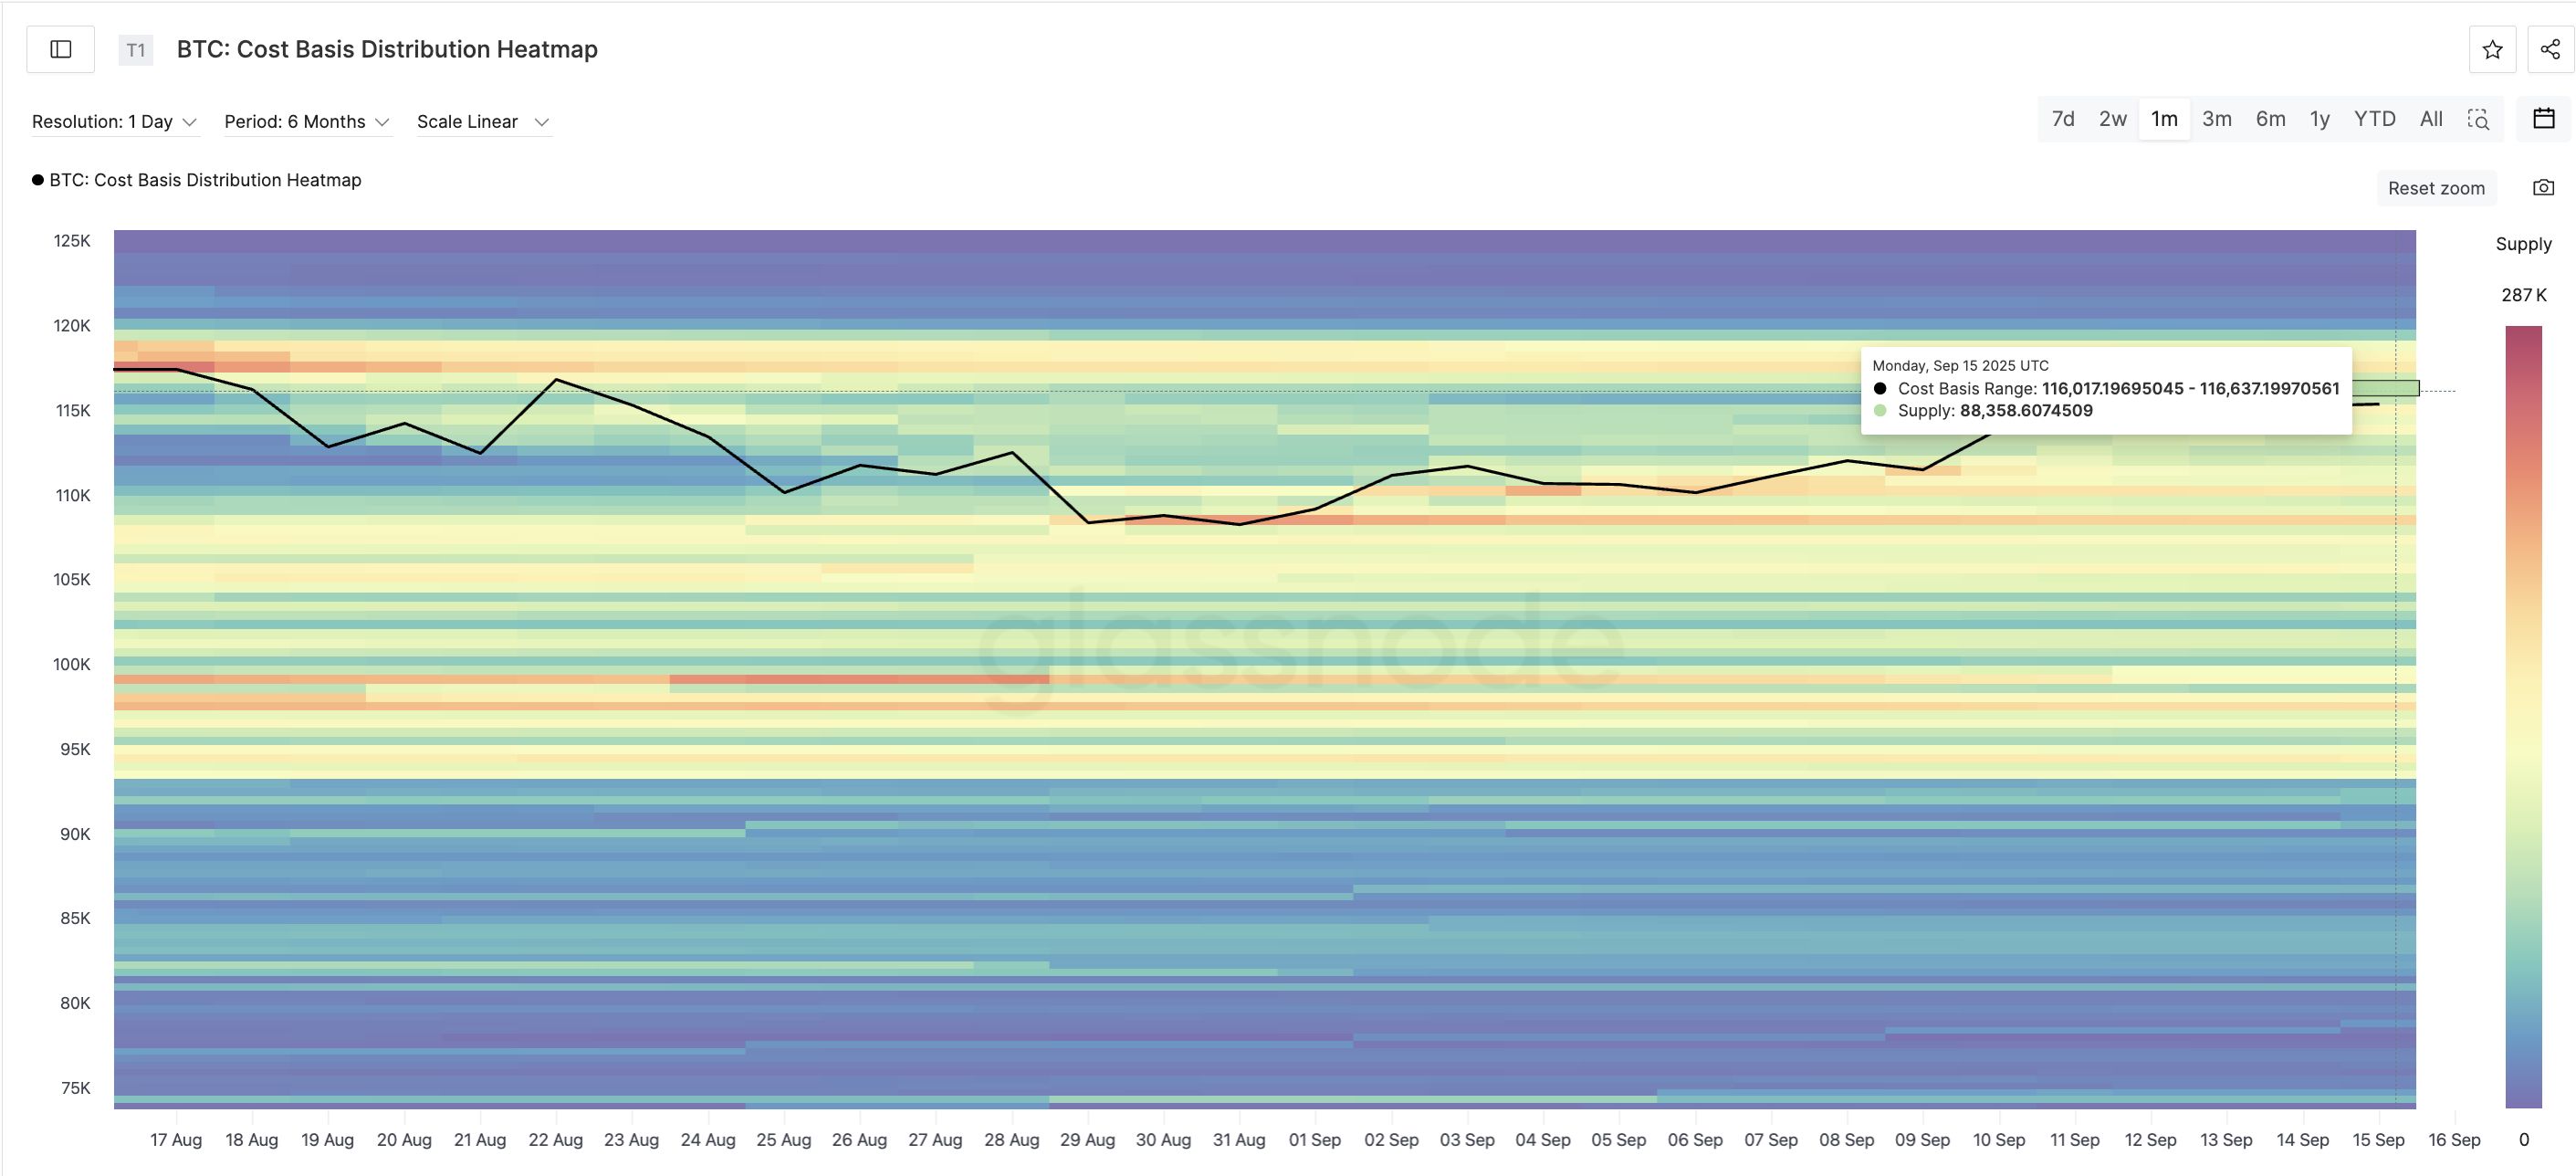
Still, the path might not be as smooth. On-chain cost basis heat maps reveal a heavy supply wall between $115,900 and $120,700, where large amounts of Bitcoin previously changed hands, 714,302 BTC to be exact. These clusters often act as resistance, as sellers who bought higher may look to exit at break-even.
 First BTC Cluster Beyond Key Resistance:
Invalidation sits at $115,000. If sellers push the Bitcoin price back below this level, the flag setup loses momentum, and the bullish case weakens for now.
But as long as the breakout holds above $115,900, bulls remain in control, with $122,900 still in play — provided the supply wall can be absorbed.
Disclaimer: The content of this article solely reflects the author's opinion and does not represent the platform in any capacity. This article is not intended to serve as a reference for making investment decisions.
You may also like
Price predictions 12/10: BTC, ETH, XRP, BNB, SOL, DOGE, ADA, BCH, LINK, HYPE

Ether vs. Bitcoin: ETH price poised for 80% rally in 2026

Prediction markets bet Bitcoin won’t reach $100K before year’s end

Bitcoin rallies fail at $94K despite Fed policy shift: Here’s why