Date: Tue, Sept 16, 2025 | 09:20 AM GMT
The cryptocurrency market is showing slight volatility ahead of the US Federal Reserve meeting this week, with Bitcoin (BTC) and Ethereum (ETH) both trading flat today. Meanwhile, altcoins are delivering mixed performances — and Render (RENDER) is one of the tokens catching attention due to a key pattern emerging on its chart.
After wiping out its weekly gains, RENDER has turned back to green today. More importantly, its price action is shaping into a harmonic structure that could be signaling a larger upside move in the near term.
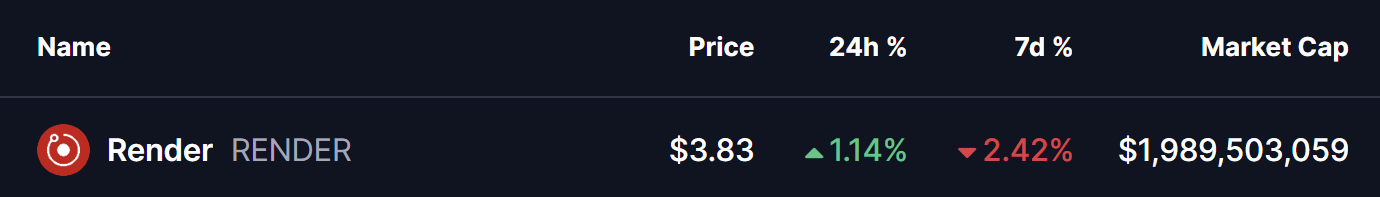 Source: Coinmarketcap
Harmonic Pattern Hints at Potential Upside
On the daily chart, RENDER has formed a Bearish Butterfly harmonic pattern. While the name suggests caution, this setup often shows bullish continuation during the “CD leg” as price heads toward the Potential Reversal Zone (PRZ).
The pattern began at Point X ($5.52), dropped to Point A, rebounded to Point B, and retraced lower to Point C near $3.26. From there, RENDER regained momentum, reaching as high as $4.15 before facing rejection at a descending resistance (black line). That pullback tested the 100-day moving average (MA) near $3.68, where buyers quickly stepped in, lifting the price back to current level of $3.83.
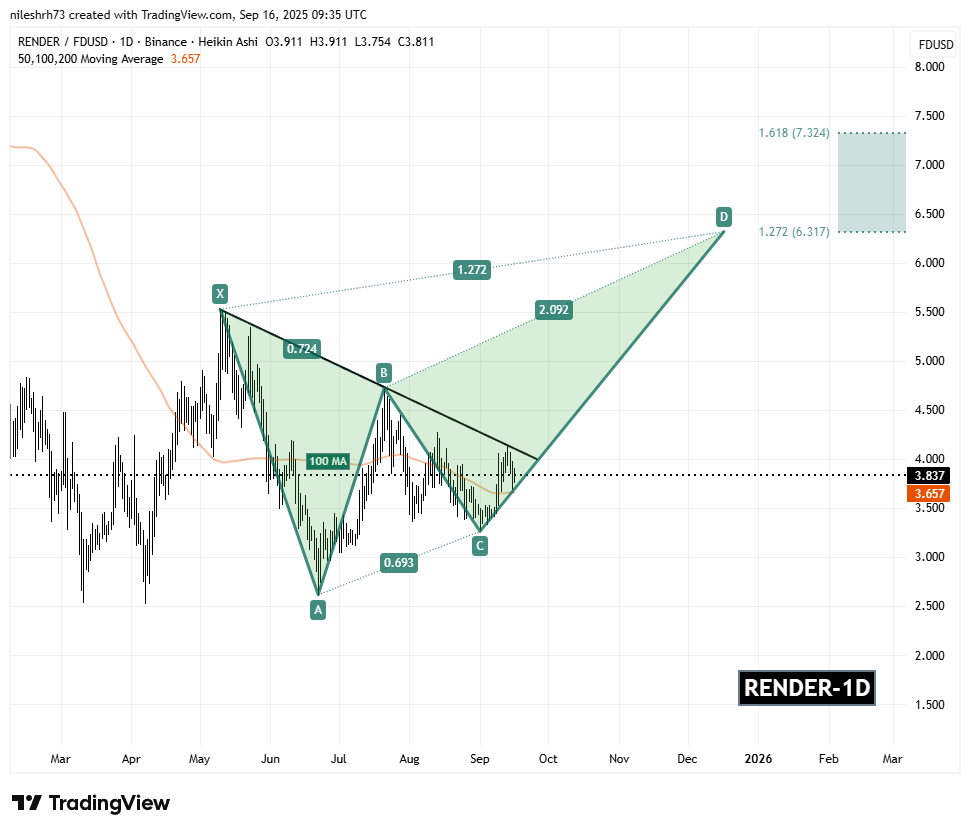 Render (RENDER) Daily Chart/Coinsprobe (Source: Tradingview)
Now, all eyes are on the descending resistance trendline that has capped RENDER’s moves in recent weeks.
What’s Next for RENDER?
If bulls hold the line above the 100-day MA and manage to break above the descending resistance, RENDER could accelerate toward the PRZ, with targets at $6.31 (1.272 Fib extension) and $7.32 (1.618 Fib extension). These levels align with the completion of the Butterfly pattern and represent potential upside zones.
On the flip side, if RENDER falls back below its 100-day MA support at $3.65, the bullish momentum could weaken and delay the upside breakout.