Solana is outperforming Ethereum because capital is rotating on-chain into SOL, off‑exchange accumulation is rising, and transaction costs remain microscopic—SOL’s low $0.005 fees plus a 135% MTD volume surge have driven large inflows and a sharp SOL/ETH ratio spike.
-
Capital rotation from Ethereum to Solana: on‑chain metrics show significant outflows from exchanges into SOL wallets.
-
SOL’s daily token volume is up ~135% MTD versus ETH’s ~20%, reflecting heavier trading and activity on Solana.
-
Exchange supply and fee divergence: exchange supply down ~0.57 percentage points and fees at ~$0.005 for SOL versus <$3 for ETH.
Solana outperforming Ethereum: on-chain flows, low fees, and off-exchange accumulation are fueling SOL gains — read the full analysis and outlook.
What is driving Solana outperforming Ethereum?
Solana outperforming Ethereum is driven by on‑chain capital rotation, off‑exchange accumulation, and far lower transaction fees on Solana. These factors are producing outsized daily volume and a rising SOL/ETH ratio, translating into stronger short‑term price performance for SOL relative to ETH.
How does SOL’s on‑chain activity compare to ETH?
On‑chain indicators show SOL attracting significantly more flow. Exchange supply for SOL fell from 5.29% to 4.72% since September 9, implying roughly 9.06 million SOL left exchanges. SOL’s daily token volume rose ~135% month‑to‑date while ETH’s daily volume is ~+20% MTD, aligning with SOL’s stronger monthly returns.
Why is Solana seeing off‑exchange accumulation?
Off‑exchange accumulation indicates holders are moving SOL into custody or cold storage, reducing circulating exchange supply. Since September 9, Solana’s on‑exchange supply fell from 5.29% to 4.72%, equivalent to ~9.06 million SOL exiting exchanges. Reduced exchange inventory often precedes stronger price momentum when demand persists.
How big is the SOL/ETH ratio move?
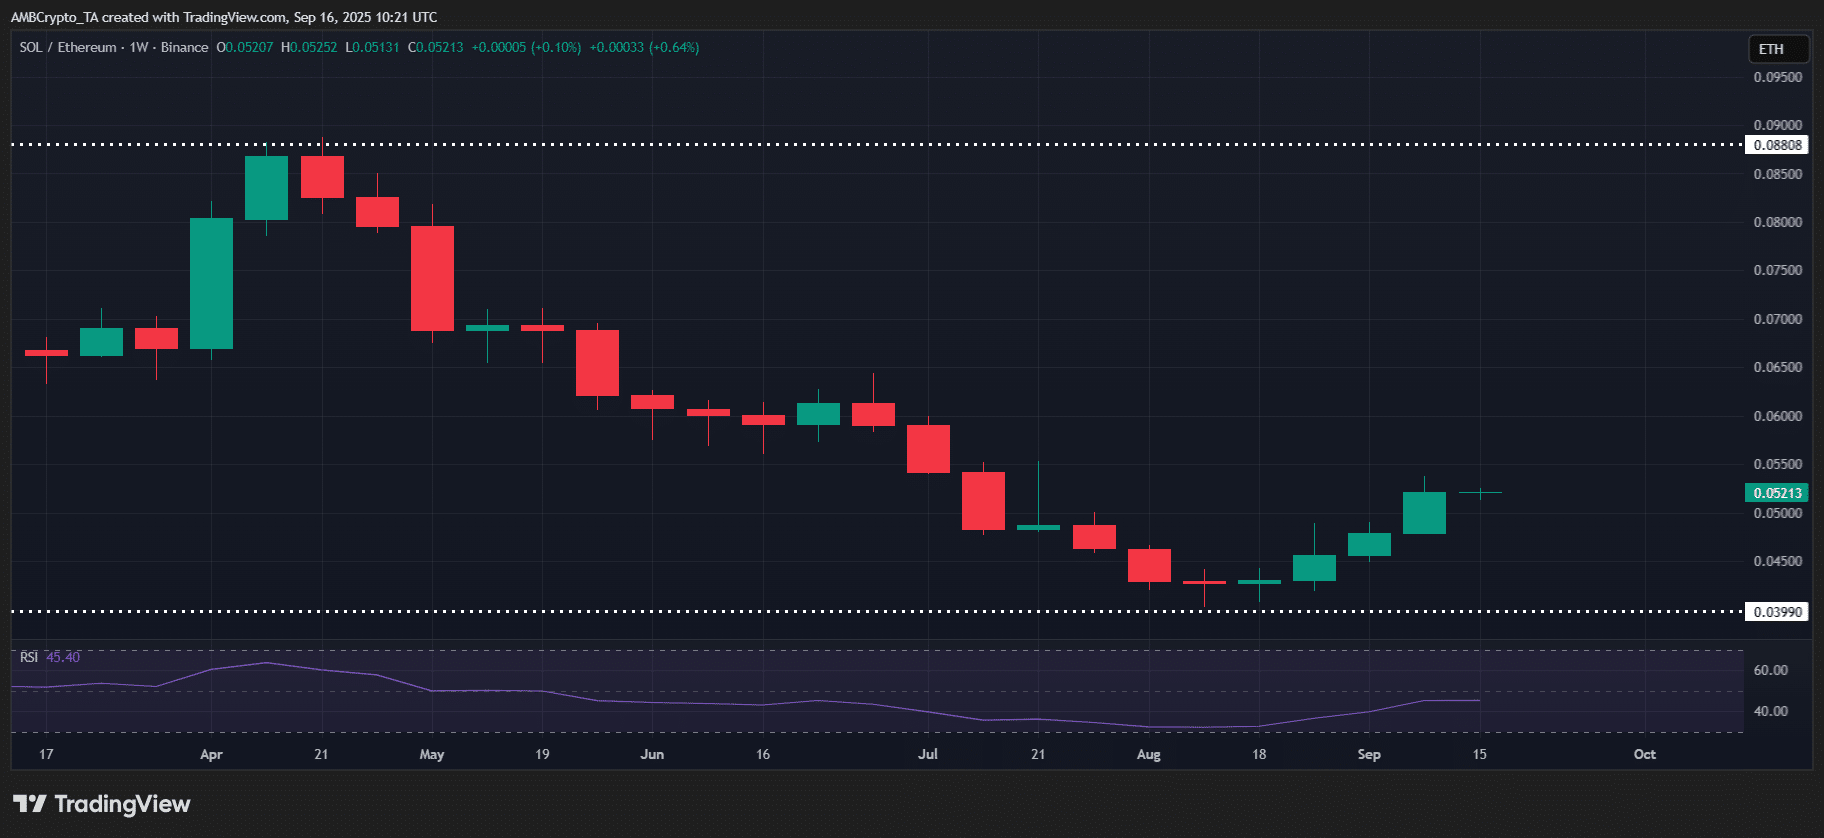
The SOL/ETH ratio rose ~8.66% at press time — its largest weekly jump since early April. This reflects faster relative gains for SOL and heavier trading flows into Solana compared with Ethereum.

Source: TradingView (SOL/ETH)
How do fees and user economics compare between SOL, ETH and BTC?
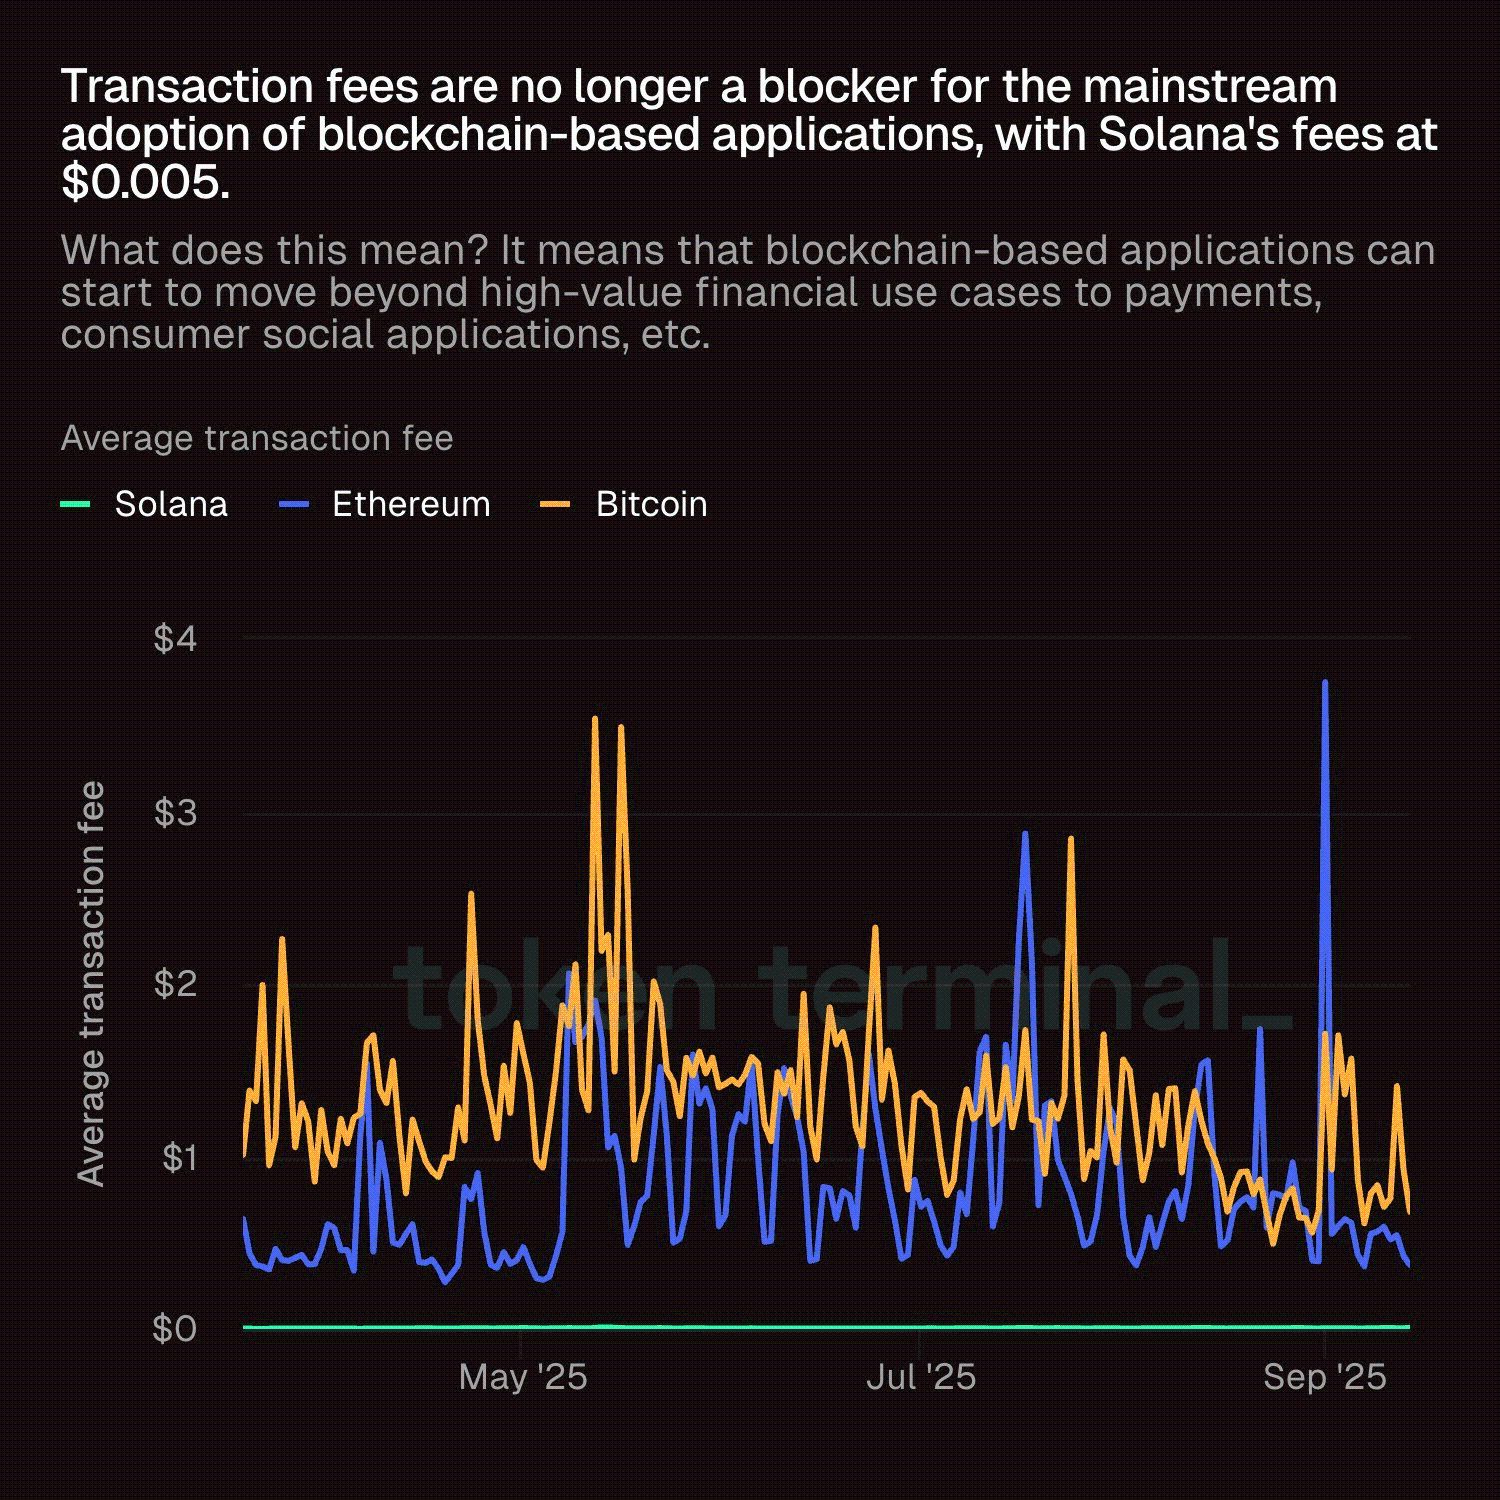
Fee economics are a driving L1 use‑case differentiator. In September, typical transaction fees spiked near <$3 for ETH and <$1 for BTC, while SOL fees remained around $0.005, keeping Solana cheaper for high‑frequency activity and smaller transactions.
| Solana (SOL) | $0.005 | +135% | Off‑exchange accumulation; strong L1 activity |
| Ethereum (ETH) | <$3 | +20% | Higher fees; some inflows to exchanges |
| Bitcoin (BTC) | <$1 | — | Higher settlement cost vs SOL for micro‑tx |

Source: Token Terminal
When could this rotation affect Q4 market structure?
If current rotation and accumulation persist into Q4, liquidity and yield seekers may increase allocations to Solana‑native projects, potentially amplifying on‑chain activity. Market structure impact will depend on sustained demand, macro conditions, and broader crypto inflows.
Frequently Asked Questions
Is the SOL/ETH ratio a reliable indicator of rotation?
The SOL/ETH ratio is a useful short‑to‑medium term gauge of relative performance. Rapid ratio spikes often signal heavier allocation into SOL versus ETH, but should be used with volume and exchange supply data for confirmation.
How should investors read exchange supply declines?
Exchange supply declines suggest holders are removing assets from sellable liquidity pools, which can precede price appreciation if buying pressure continues. Confirm with volume and on‑chain transfer patterns.
Key Takeaways
- Capital is rotating: SOL is seeing fund flows from ETH, reflected in exchange supply drops and ratio gains.
- Activity and fees matter: SOL’s ~135% MTD volume and ~$0.005 fees boost its utility and attractiveness for transactions.
- Watch confirmation signals: Combine exchange supply, volume, and ratio moves for a clearer view of durable rotation into SOL.
Conclusion
Solana’s current outperformance versus Ethereum is grounded in measurable on‑chain trends: exchange supply declines, substantial MTD volume gains, and significantly lower fees. Together these signals show smart‑money repositioning and higher L1 activity. Watch these metrics into Q4 to track whether SOL’s leadership is sustained; COINOTAG will monitor developments and provide ongoing analysis.


