- Solana rebounded from an intraday low of $235.98, climbing steadily to $247.89 with strong trading volume.
- Market cap rose 5.43% to $134.63 billion, while daily volume increased 48.09% to $11.36 billion.
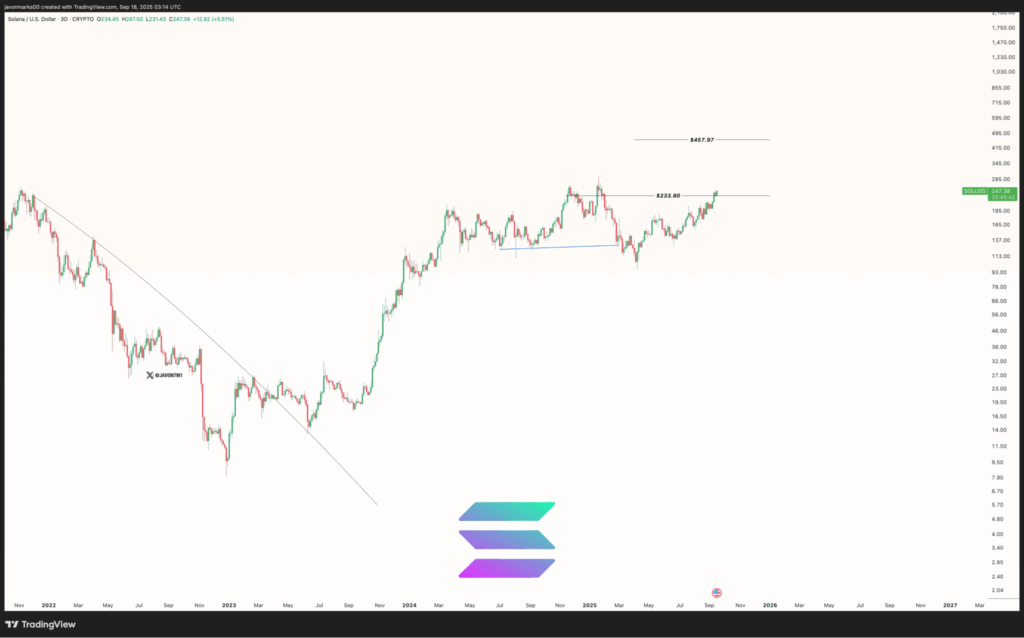
- Chart data identifies $233.80 as a key level, with an upside projection toward $457.97, an 82% potential move.
Solana is a high-performance blockchain known for its scalability, low fees, and fast transaction speeds. Through its native token SOL, the recent trading sessions have placed the asset above $247. The token recovered quickly from an intraday dip to $235.98, regaining strength and consolidating above $240 before advancing further.
What is Solana’s Current Market Action?
Tracking the ongoing price trend at the time of press, data from CoinMarketCap reveals that Solana (SOL) traded at $247.89 , recording a 5.41% daily gain. The session opened with a dip to $235.98, marking the intraday low. After this decline, the token reversed course and entered a strong upward move, climbing past $240 overnight.
Source: CoinMarketCapThrough the morning session, Solana advanced further, crossing $245 and holding steady within a narrow range. The chart shows multiple consolidations during midday trading, mostly between $242 and $246, before the asset resumed its rise.
By late afternoon, the token reached its peak at $247.8, the highest point of the day. The increase represented nearly a $12 rebound from earlier lows. Market activity expanded in parallel with the price. Market cap rose 5.43% to $134.63 billion, while daily volume surged 48.09% to $11.36 billion, reflecting strong liquidity.
Solana Regains $233.80 With Chart Target at $457.97
According to an observation prepared by Javon Marks, Solana (SOL) has regained a critical level following a steady recovery from the extended decline seen in 2022. The chart reflects a clear transition, showing higher lows across 2023 and 2024, with price action now anchored at $233.80. This point has emerged as a structural marker in the ongoing trend, forming the basis for the next charted target of $457.97.
 Source: X
The $233.80 zone has acted as a pivotal boundary in Solana’s market structure. After a consolidation period, the token reclaimed this price and bounced directly from it. This recovery came after several rejections in higher ranges, reinforcing the significance of the reclaim in building momentum.
Charted Projection Toward $457.97
Data indicates that the next major resistance rests at $457.97, almost double the reclaimed level. The distance between the two points represents an 82% potential move. The projection follows established chart mapping, with boundaries clearly defined in the ongoing channel. Historical price action shows cyclical movements with recoveries from lows and phases of consolidation shaping Solana’s structure.
The upward channel now frames the bounce from $233.80 and confirms its place as a key level for market tracking. The chart illustrates Solana’s broader recovery from prolonged decline, identifying $233.80 and $457.97 as central points within the current structure. These levels mark the market’s critical boundaries based on charted data.