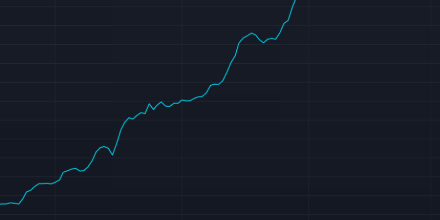
- COTI is at $0.05359, gaining 5.6% in 24h, with support and resistance at $0.05069 and $0.05599 respectively.
- The coin is approaching the upper Bollinger Band which is a technical zone that could likely trigger higher volatility.
- Breaking over the downward trendline would be confirmed by a break over at $0.05599 and the support at $0.05069 is important.
COTI is nearing an important price zone as the token gathers around one of the key resistance levels in the daily chart. COTI was traded at the present price of $0.05359, which is a 5.6% growth over the last 24 hours. Having an under-price of $0.05069 and an over-price of $0.05599, traders are greatly watching the chances of a breakout by a decisive move. It is interesting to note that the token has been trading the upper Bollinger band which is a technical indicator that usually indicates higher volatility.
Price Structure and Key Levels
The daily framework demonstrates continued consolidation in a diminishing range, which generates a pressure around the falling trendline. The support is consistent at $0.05069, which contributes to the bullish momentum. In the meantime, the line of resistance at $0.05599 has become the obstacle to the additional progress.
If the token sustains movement above this threshold, the chart suggests a breakout attempt may unfold. Importantly, the narrowing structure indicates that price action is nearing a decision point.
COTI Approaches Upper Bollinger Band as Volatility Builds
The Bollinger Bands provide additional context for COTI’s current behavior. The token is nearing the upper band, which often precedes notable volatility shifts . Historically, when similar assets broke above this range, sharp upward movements followed.
The last time a comparable breakout occurred, a significant 80% rally was recorded in a related sector. Traders now await confirmation of whether this historical setup could re-emerge with COTI’s latest price action.
COTI Tests Key Levels as Market Awaits Breakout or Reversal
As the level of resistance and support are well established, the market outlook is whether COTI can close above the upper band. Breaking through $0.05599 would ensure the trendline of decline is broken, and possibly the rally might become more energetic.
However, if the asset retreats, support at $0.05069 becomes the immediate defense zone. This price activity underscores how the coming sessions could determine the token’s short-term direction, keeping market participants focused on the evolving chart structure.


