
Ethereum: Bullish Recovery Ahead? Technical Outlook for October 1, 2025

Ethereum regains some stability after a correction phase. Find our complete analysis and the current technical outlook for ETH.

In Brief
- Technical analysis: ETH moves within a long-term bullish trend but remains fragile in the short term.
- Key levels: Major supports at $3,825 and $3,355; key resistances at $4,394 and $4,956.
- Derivatives analysis: Overall neutral positioning with moderate funding and stabilized CVD.
- Forecasts: Possible rise towards $4,956 if $3,355 holds, decline towards $2,900 if $3,825 breaks.
ETH/USD Technical Analysis
The Ethereum spot price stands around $4,290, rebounding after a cumulative drop of nearly 17%. Weekly change remains negative at -7.4%, confirming a still fragile market but supported by renewed interest. Weekly volumes reach $27.6 billion, a 32% increase, reflecting a return of activity after several weeks of decline.
The long-term trend, represented by the 200 SMA, remains bullish, confirming the market’s foundational structure. Medium-term (50 SMA) trend stabilizes after the post-rally correction phase. Finally, short-term dynamics (20 SMA) oscillate between neutrality and bearish bias, in line with recent volatility. Momentum shows a rebound after a sharp contraction, suggesting an ongoing recovery attempt.
Key Ethereum Levels
Immediate resistances are at $4,394, followed by the all-time high (ATH) at $4,956, representing critical distribution zones. Major supports are at $3,825 and $3,355, defensive thresholds likely attracting accumulation in case of selling pressure. The last daily breakout at $4,000 illustrates a quick price recovery after a brief support loss. The monthly pivot point at $4,245 currently plays a balancing role around the spot price. Lastly, volume profile highlights a high value area at $4,305, marking an upper equilibrium boundary, while the low value area is at $2,511, signaling an extreme threshold where the market might seek liquidity.
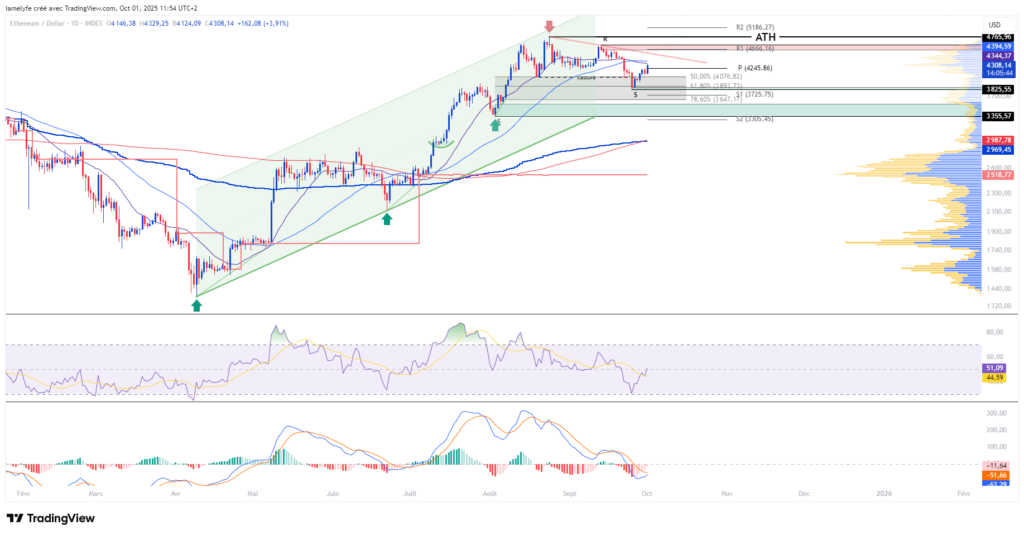 ETHUSD Daily Chart
The current technical analysis was conducted in collaboration with Elyfe , an investor and crypto market educator.
Derivatives Analysis (ETH/USDT)
Derivative indicators depict a generally neutral market. Open interest remains stable, reflecting cautious speculative positioning, slightly bearish before a recent rebound. The CVD confirms balanced flow after a retracement phase, with no clear dominance of buyers or sellers. Liquidation activity, after a notable episode on long positions, has stabilized, with a relative balance between buyers and sellers. Finally, the funding rate, slightly positive, indicates a moderate bullish bias favoring long positions, but significantly lower compared to previous excesses.
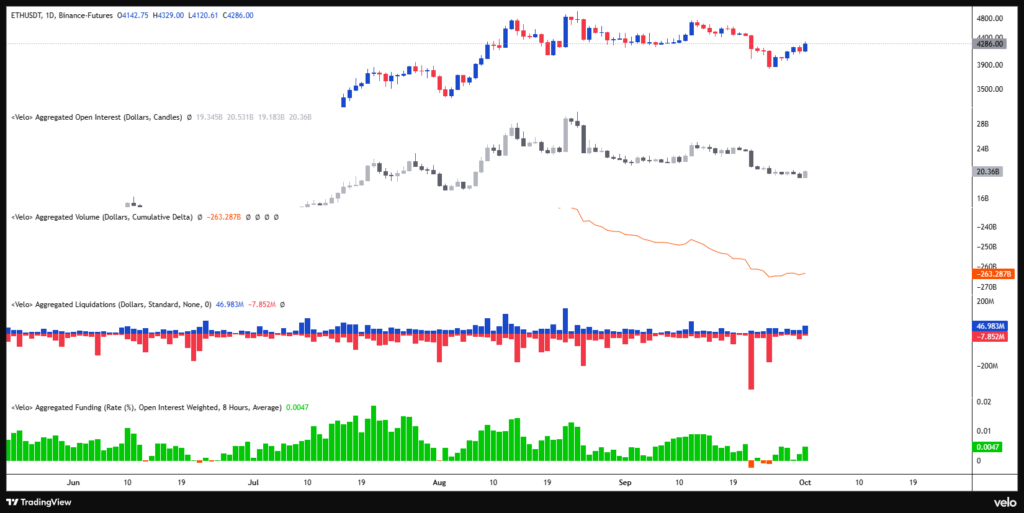 Open Interest / Liquidations / CVD & Funding rate
The seller liquidation zone near $4,500 appears as a critical threshold: crossing it could strengthen bullish momentum, but it could also serve as a distribution zone if demand weakens. Conversely, buyer zones between $3,800 and $3,900, as well as between $3,600 and $3,700, remain vulnerable to a break, potentially triggering a bearish acceleration, while representing points of interest for strategic accumulation.
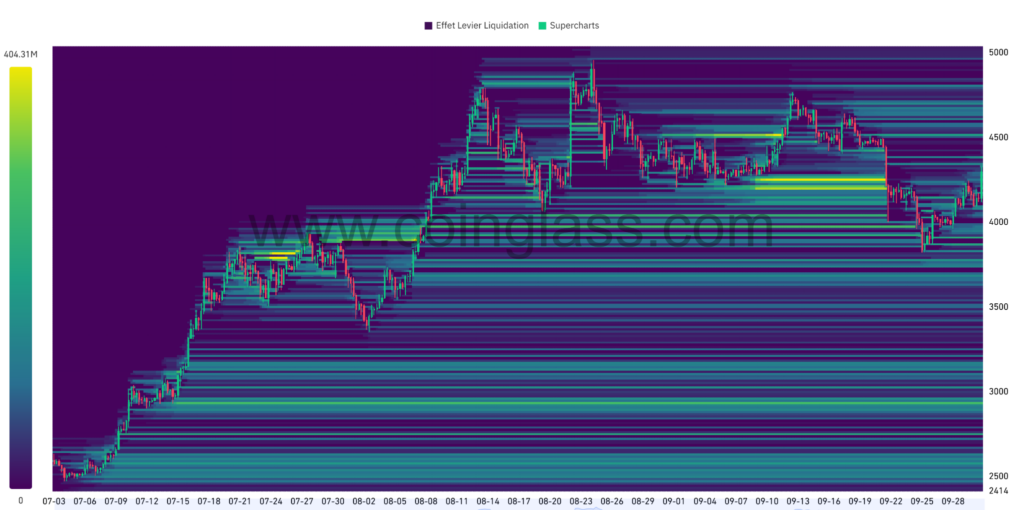 ETH Liquidation Heatmap
Forecasts for Ethereum Price (ETH)
Bullish scenario:
- If ETH holds above $3,355, a recovery toward $4,394 then the ATH at $4,956 remains possible. This scenario would represent about +15% potential from current levels.
Bearish scenario:
- If the support at $3,825 breaks, an acceleration toward $3,355 then $2,900 is likely, a decline of about -33% from current levels.
Conclusion
Ethereum is in a rebalancing phase after a significant correction, with a rebound supported by rising volumes. Long-term trends remain bullish, but the short term retains notable fragility. Liquidation zones indicate sensitive thresholds on both buyer and seller sides, potentially triggering additional volatility.
In this context, it will be essential to closely monitor price reactions at strategic levels to confirm or adjust current forecasts. Finally, remember that these analyses are based solely on technical criteria, and the cryptocurrency market can evolve rapidly according to other more fundamental factors.
Did you find this study interesting? Check out our latest Bitcoin analysis .
Disclaimer: The content of this article solely reflects the author's opinion and does not represent the platform in any capacity. This article is not intended to serve as a reference for making investment decisions.
You may also like
Bankless | Hyperliquid's Battle for Supremacy in 2025: Can It Hold On in 2026?

How does x402 V2 make autonomous payments by AI agents possible?

![[Bitpush Daily News Selection] JPMorgan issues Galaxy short-term bonds on the Solana network; New York court sentences Terraform Labs founder Do Kwon to 15 years in prison; US Financial Stability Oversight Council (FSOC) annual report removes digital asset risk warning; OpenAI launches a more advanced model, GPT-5.2, to compete with Google](https://img.bgstatic.com/multiLang/image/social/35029d7d430a8303837232285bb190721765555021864.jpg)