Key Notes
- BCH achieved a rising wedge breakout with technical indicators pointing toward a potential $1,000 price target in the near term.
- Open interest in Bitcoin Cash derivatives increased 4.5% as fresh capital entered the market, validating the rally's strength beyond rotation.
- The altcoin benefited from broader risk appetite as US equities turned positive and traders anticipated another Federal Reserve rate reduction.
Bitcoin Cash BCH $605.0 24h volatility: 2.7% Market cap: $12.09 B Vol. 24h: $360.18 M price traded as high as $609 on October 3, benefitting from increased investor risk appetite, amid positive US stock market performance and expectations of a second consecutive Fed rate cut. This brings BCH price gains over the last five days to 14.2%.
In comparison, Bitcoin BTC $122 556 24h volatility: 2.5% Market cap: $2.45 T Vol. 24h: $82.21 B price only gained 3% intraday, consolidating below all-time highs near $124,000 at press time. BCH also mildly outperformed Ethereum ETH $4 503 24h volatility: 1.1% Market cap: $545.12 B Vol. 24h: $45.34 B , XRP XRP $3.05 24h volatility: 0.1% Market cap: $182.86 B Vol. 24h: $7.94 B , and Solana SOL $232.4 24h volatility: 1.8% Market cap: $126.84 B Vol. 24h: $10.34 B on October 3. This shows that higher risk appetite has seen investors turn to mid-cap altcoins as US equity markets flipped green around mid-week.
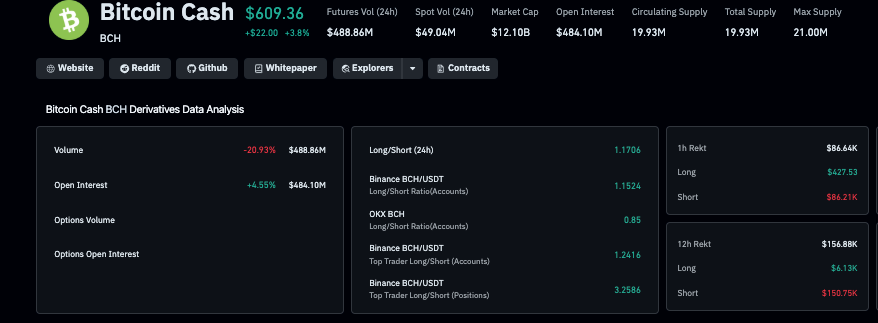
Bitcoin Cash Derivatives Market Analysis | Source: Coinglass, October 3, 2025
Capital flows within Bitcoin Cash derivatives markets over the last 24 hours further emphasize the bullish stance. As seen in the Coinglass chart above , BCH open interest grew by 4.5%, keeping pace with the intraday spot price uptick, while 24-hour trading volume declined 20.9%. This confirms that the latest leg of the rally was propelled by new capital, not mere rotation of existing funds.
BCH Price Forecast: Rising Wedge Breakout Targets $1,000
Bitcoin Cash price has staged a strong rebound from September lows. Technical indicators suggest BCH could be set for more upside with its latest leg above $600 confirming a rising wedge breakout on October 3. As seen below, the rising wedge pattern hints at a long-term target at $1,000.
The MACD indicator on the weekly timeframe also shows bullish outlook with the MACD line crossing above the signal line, currently printing 49.5 versus 47.9.
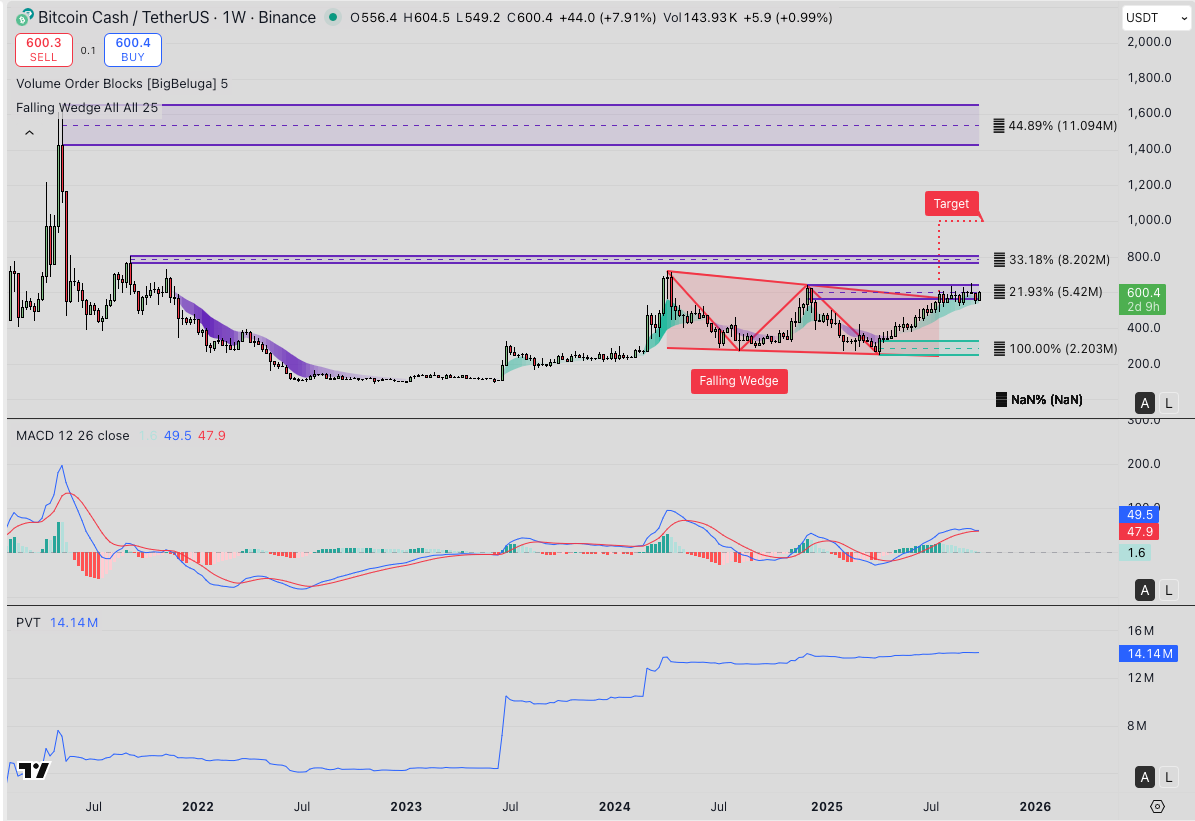
Bitcoin Cash Technical Price Forecast | October 3, 2025
Meanwhile, Price Volume Trend (PVT) data reveals a steady increase in capital inflows since mid-2024, validating the breakout as more than a recent short squeeze event.
In the bullish scenario, a sustained rally could see BCH price clear the $800 supply zone.
However, in a bearish scenario, failure to hold the $580 support zone could trigger a retest of $450. On the flip side, a breakdown below $450 would invalidate the wedge breakout signal.