
- Bitcoin is currently hovering at the $123K mark.
- The BTC market is now in the greed zone.
The broader market cap has reached $4.24 trillion, with neutral sentiment enduring in the market. All the major crypto token prices are charted, with a few painted in green. Notably, Bitcoin (BTC), the largest asset, has been slowly attempting to gain momentum. With a series of ups and downs, the price has broken the $125K mark.
In the early hours, BTC traded at a high range of $125,190, and with the bearish encounter in the market, the asset fell back to a low, at its former support at around $122,459. As per CoinMarketCap data , at the time of writing, Bitcoin traded within the $123,757 after posting a loss of 1.09%.
Meanwhile, the asset has entered the greed zone as the Fear and Greed Index value of BTC holds at 71. Furthermore, the daily trading volume of Bitcoin is up by over 6.49%, reaching $59.82 billion. As reported by the Coinglass data , the market has faced a liquidation of $66.38 million worth of Bitcoin in the last 24 hours.
Bitcoin Outlook: Will it Continue on the Downside or Reverse?
On the 4-hour price chart of the BTC/USDT pair, the bearish trading pattern . The red candlesticks have formed, and the bears might pull the price back to the $123,747 support. Further correction on the downside could send the asset’s price even lower. If a reversal occurs, the Bitcoin price may break above $123,770, and with the bullish correction, the uptrend could continue to gain momentum.
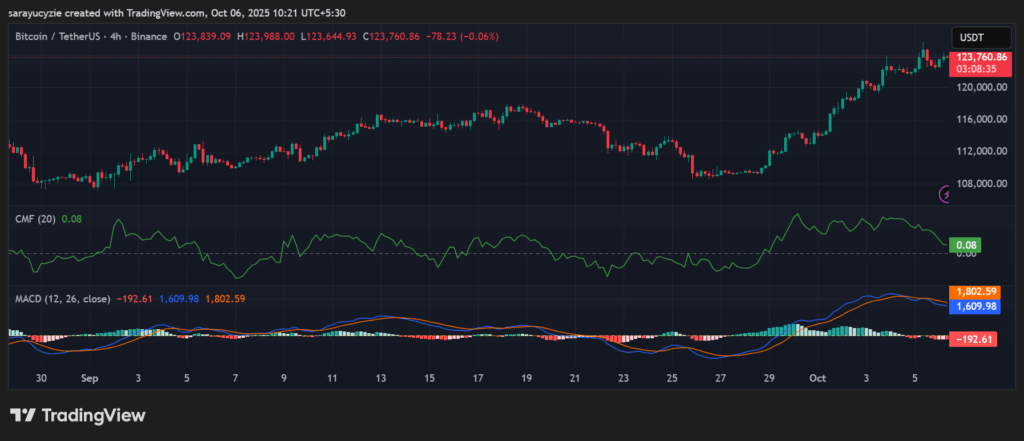 BTC chart (Source: TradingView )
The technical analysis of Bitcoin exhibits that the MACD line has moved below the signal line, indicating bearish momentum in the market. This crossover hints that selling pressure is increasing, and the price may continue to trend downward. Besides, the CMF value of 0.08 indicates mild buying pressure in the market, and the money is flowing into the asset. The buying strength is not very strong, thus a neutral to slightly bullish sentiment is lingering.
Additionally, the daily Relative Strength Index (RSI) found at 66.77 signals that the asset is showing strong bullish momentum, and may approach the overbought zone . There is a chance of a potential pullback if it crosses 70. Bitcoin’s Bull Bear Power (BBP) reading of 1,492.41 implies a strong bullish dominance in the market. With the positive value, buyers are overpowering sellers, and pushing prices upward.
The broader signs of downward pressure have occurred. Only a sturdy bullish trend could repair the loss and regain the momentum. For more detailed insights into where BTC could be headed, check out our Bitcoin (BTC) Price Prediction 2025, 2026-2030.
Top Updated Crypto News
Bill Morgan Expresses Confidence on XRP Price, Highlights Yearly Growth of Ripple Token