
Bitcoin Exchange Flows Hit Multi-Year Lows —Is $130,000 Next?

Bitcoin’s steady October climb may be more than momentum. With exchange net flows at multi-year lows and a key breakout pattern in play, on-chain data suggests $130,000 could be the next major milestone if bullish momentum holds.
Bitcoin has started October on a steady climb. It’s up nearly 9% week-on-week and still holding firm above $124,000, even after a mild cooldown from its recent all-time high. The Bitcoin price move isn’t just about momentum — it’s supported by deep shifts in on-chain activity that signal conviction from both long-term and short-term holders.
One number stands out: $130,000 — the next major target hinted by both pattern and data.
Exchange Net Flow Hits Multi-Year Low As Holders Step In
One of the clearest signs of confidence comes from Bitcoin’s exchange net flow, which measures the difference between coins entering and leaving centralized exchanges. A negative value means more BTC is being withdrawn than deposited — typically a sign that holders prefer to store, not sell.
As of October 4, Bitcoin’s 14-day Simple Moving Average (SMA) for net flow sits at –7,210 BTC, its lowest level in nearly three years. The last time net flows dropped this deep was in November 2022, just before Bitcoin began its massive rise from $16,000 to over $72,000 in the following months.
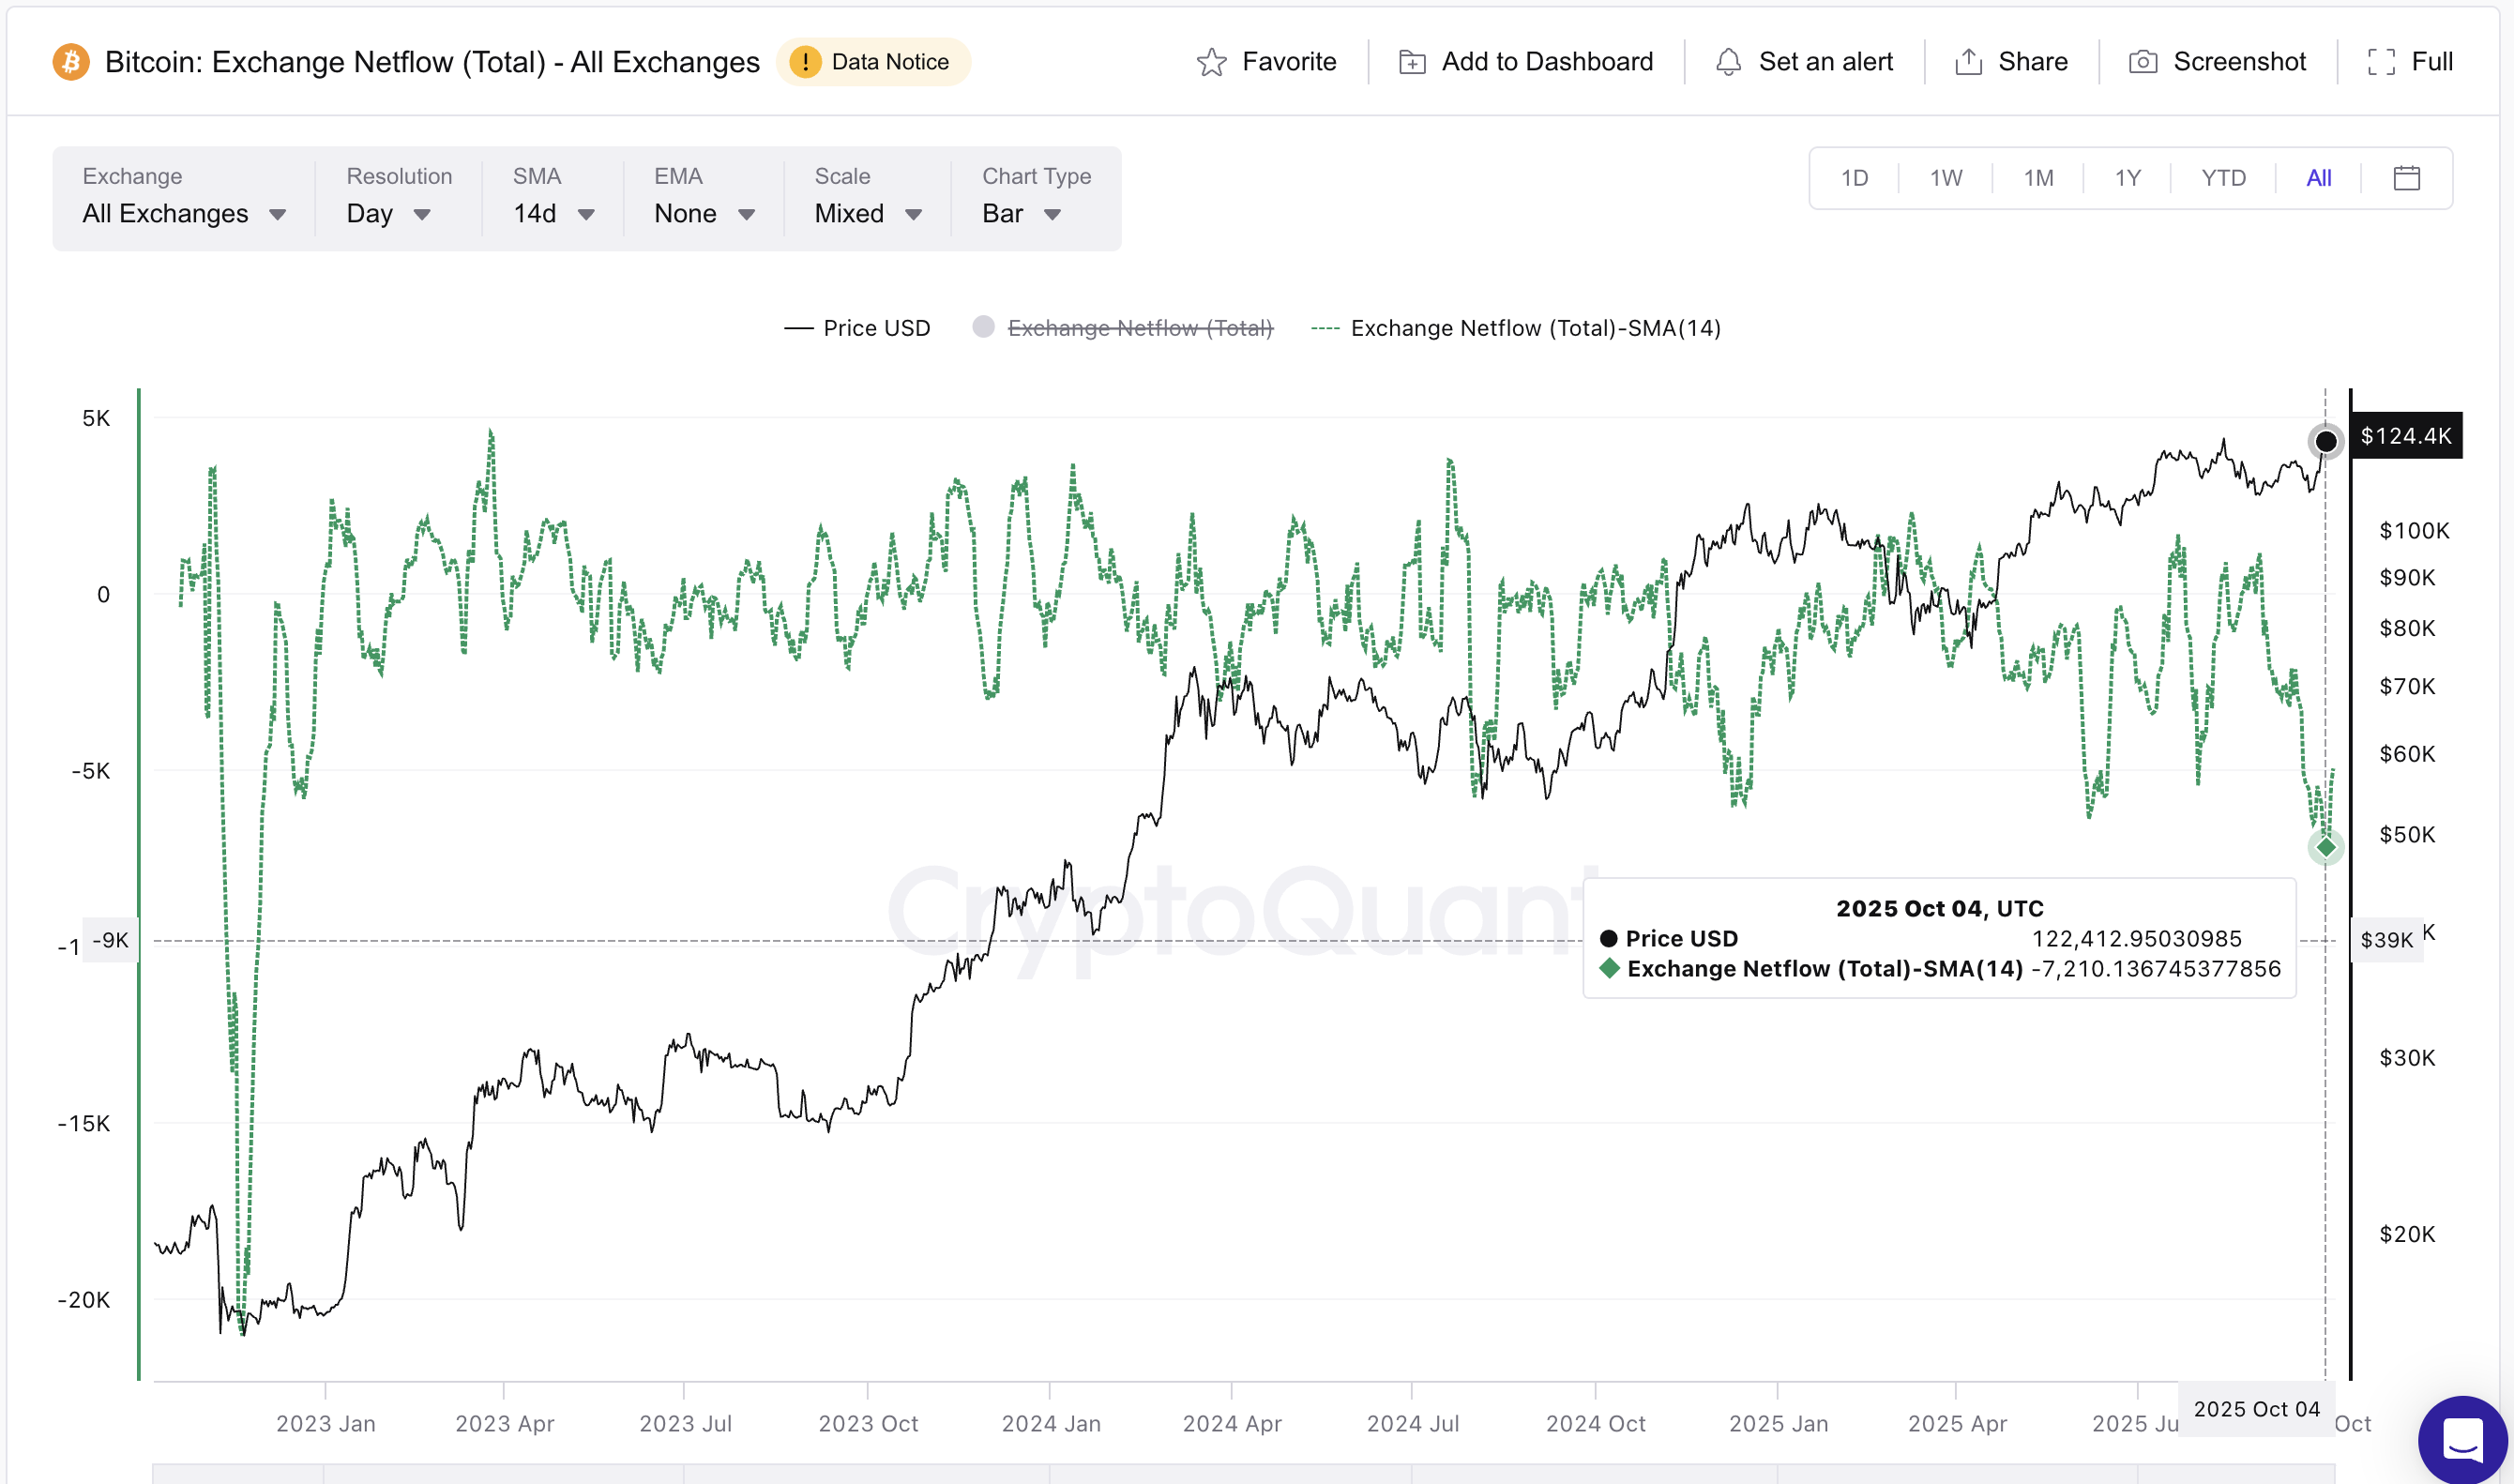 Bitcoin Exchange Netflow:
CryptoQuant
Bitcoin Exchange Netflow:
CryptoQuant
That backdrop makes the current reading even more compelling — it reflects a market quietly leaning toward accumulation, not distribution.
To confirm this, we look at HODL Waves, which show how long coins have stayed unmoved. Over the past month, both short-term and long-term holders have added to their holdings. The 1–3 month cohort grew from 8.75% to 9.59% of supply, while 2–3 year holders ticked up from 7.00% to 7.13%.
Want more token insights like this? Sign up for Editor Harsh Notariya’s Daily Crypto Newsletter.
Even though the 0.13% rise may look minor, it represents tens of thousands of BTC — a meaningful shift when viewed against Bitcoin’s total supply and a clear signal of renewed conviction from long-term holders.
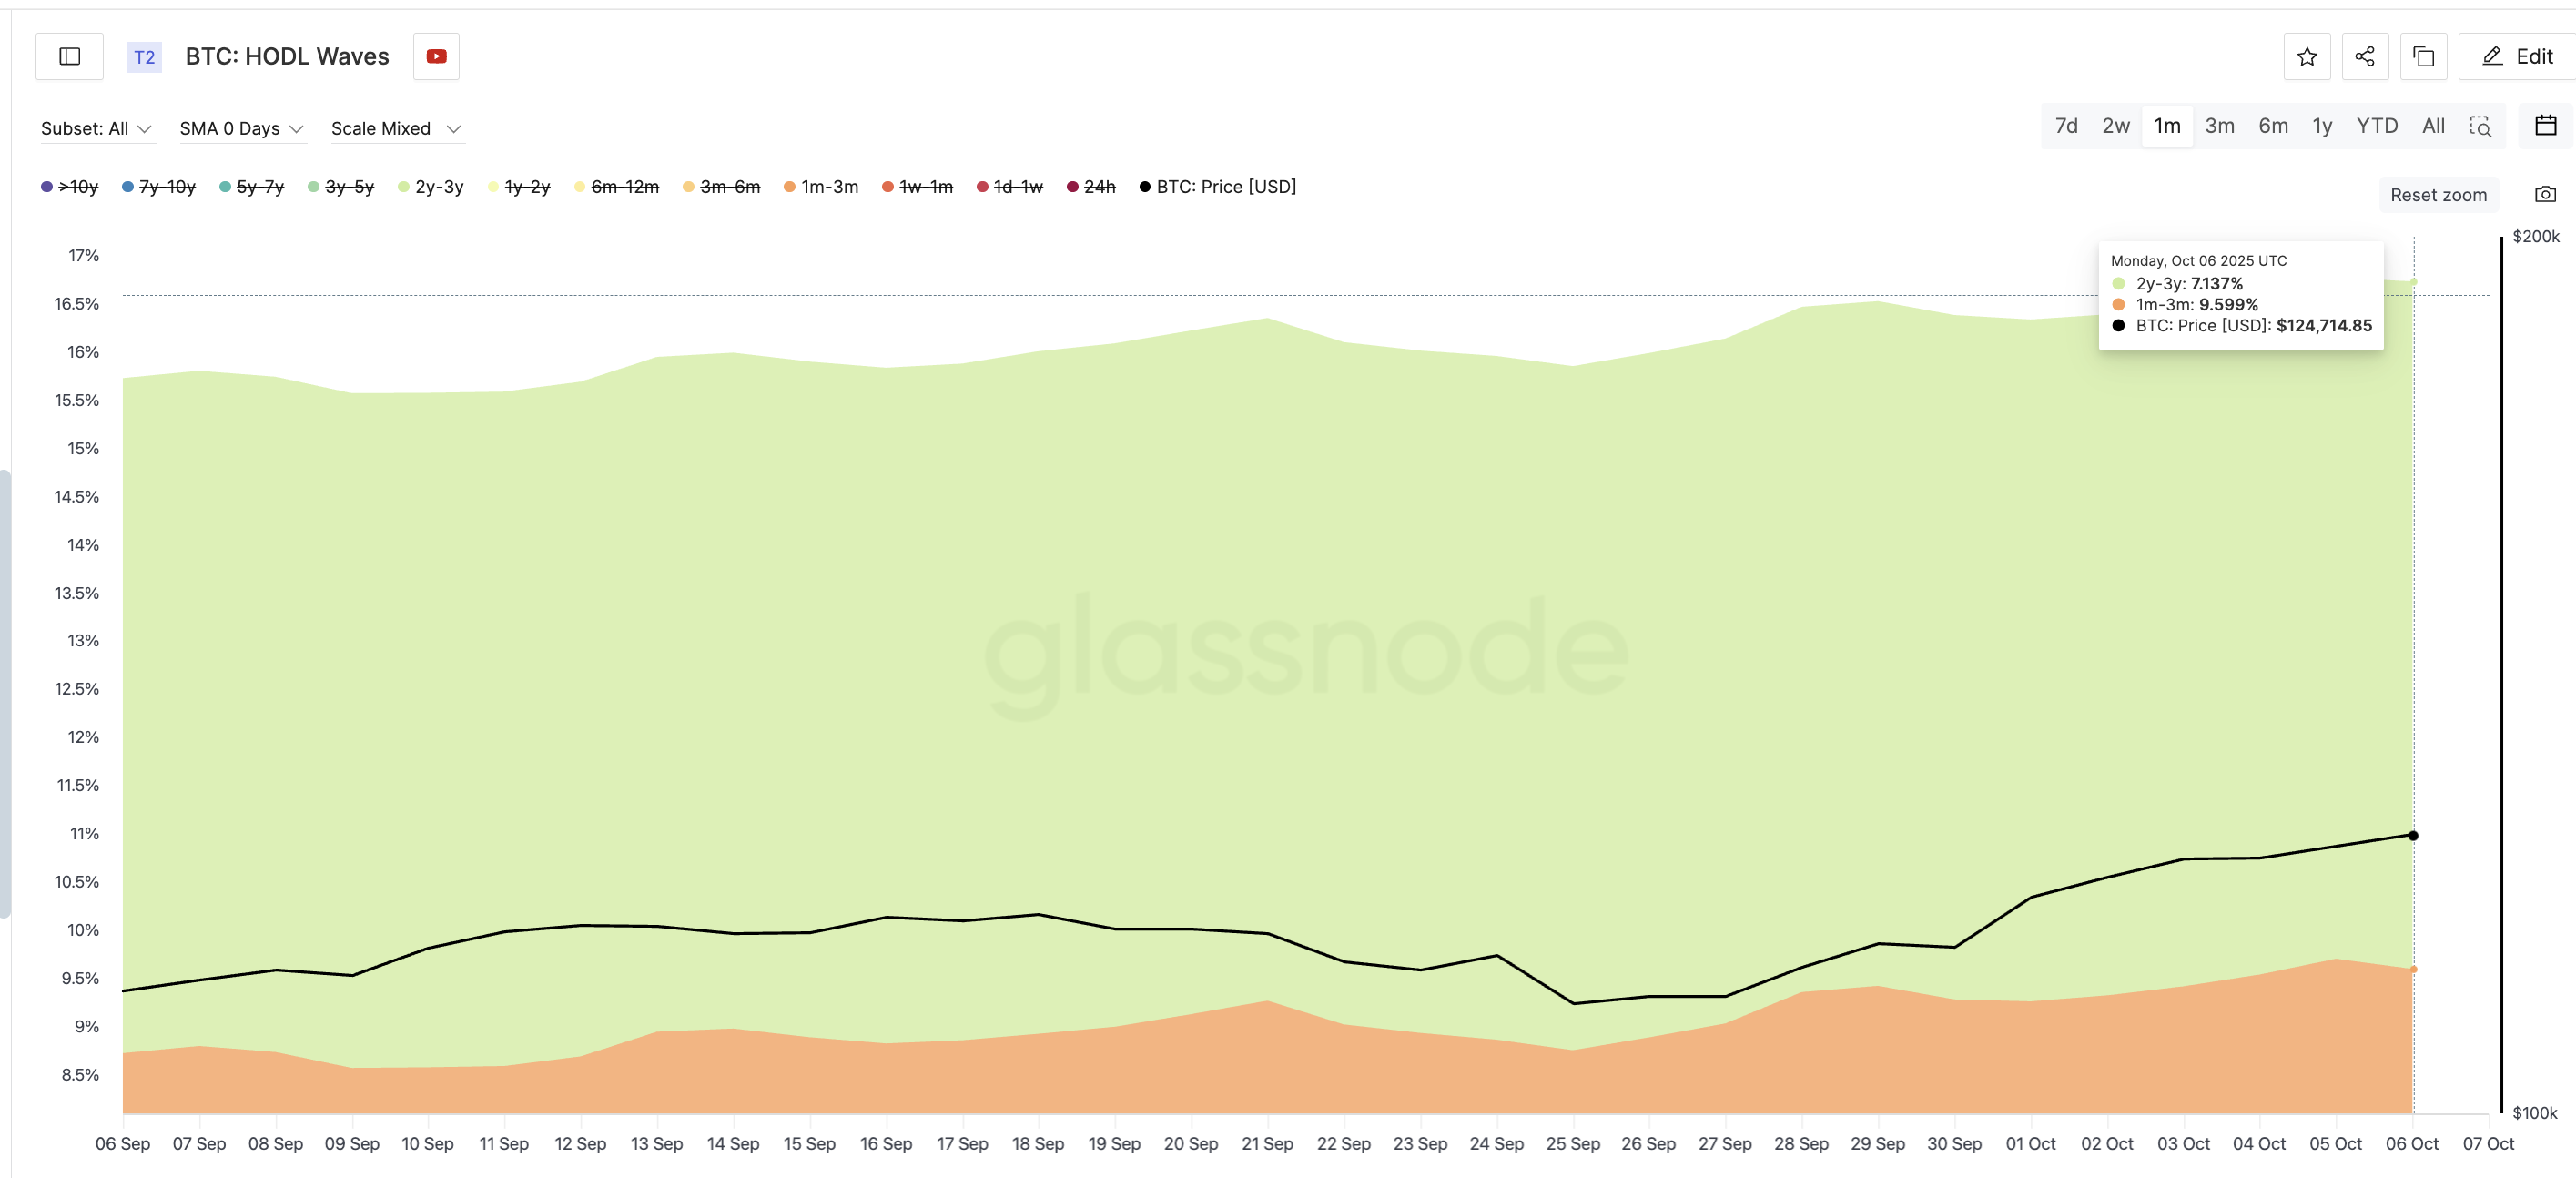 Key Bitcoin Cohorts Adding To Their BTC Stash:
Glassnode
Key Bitcoin Cohorts Adding To Their BTC Stash:
Glassnode
This dual participation matters — if only one side (short- or long-term) were accumulating, the rally would appear fragile. Instead, both are showing conviction, creating a stronger base for a sustained move higher.
Pattern Breakout Targets $130,100 As Volume Backs The Bitcoin Price Move
On the daily chart, the Bitcoin price recently confirmed an inverse head-and-shoulders breakout, closing firmly above the $122,100 neckline. The pattern projects an immediate upside target above $130,000 if momentum holds.
 Bitcoin Price Analysis:
TradingView
Bitcoin Price Analysis:
TradingView
The Wyckoff Volume indicator also adds context. This tool tracks whether buyers (blue bars) or sellers (orange bars) dominate trading sessions. During the last correction in September, a shift from blue to orange preceded a price dip from $117,900 to $108,400.
That shift hasn’t happened this time — blue bars still dominate, showing that buyer demand remains intact.
If the Bitcoin price manages to stay above the $122,100 level, the move to $130,100 looks highly likely. A breakout beyond that could open the door to fresh cycle highs later this quarter.
Still, a dip below $117,900 and $108,400 would temporarily invalidate this bullish setup, though on-chain metrics suggest the bias remains upward for now.
Disclaimer: The content of this article solely reflects the author's opinion and does not represent the platform in any capacity. This article is not intended to serve as a reference for making investment decisions.
You may also like
Smarter Web Buys 25 Bitcoin Worth £2.3M Under 10-Year Plan
Fidelity Purchases $112.3 Million Worth of Bitcoin to Expand Holdings
Strategic Bitcoin Reserve: Lummis Pushes for Early Funding Start
Christine Lagarde Questions Bitcoin’s Value as the Euro Weakens