Ethereum (ETH) price forms multi-month bull flag, can it hit a new all-time high?Ethereum price analysis

Ethereum price has formed a multi-month bull flag pattern on the weekly chart, which could position it for a potential 76% upside if a breakout is confirmed.
- Ethereum price is down 16.7% from its all-time high.
- A bull flag pattern has formed on the weekly chart.
- ETH could potentially rally over 70% based on the pattern’s projected target.
According to data from crypto.news, Ethereum ( ETH ) was trading at $4,120 on Wednesday morning, Asian time, dropping 6% from its Friday high of $4,382. At its current price, it is down 16.7% from its all-time high of $4,946 reached in late August this year.
Its price dipped to as low as $3,574 over the weekend, dragged down by a broader market sell-off that followed partly after U.S. President Donald Trump announced fresh tariffs on Friday, targeting Chinese goods. The goods included rare earth minerals and critical software, both essential components for emerging technologies and AI infrastructure.
Although U.S. officials note that talks are underway with the Chinese government ahead of the Nov. 1 tariff deadline, market sentiment is still on edge.
This cautious mood is clearly reflected in the Crypto Fear & Greed Index, which still shows a “fear” reading, suggesting that investors are still in risk-off mode, at least until further clarity or concrete developments emerge around the trade negotiations.
Despite the cautious sentiment across the broader crypto market, Ethereum’s price action on the weekly chart is telling a different story. From a technical standpoint, ETH appears to be carving out a highly bullish setup that, if confirmed, could pave the way toward a new all-time high.
Ethereum price analysis
Currently, Ethereum is trading within a bull flag pattern, a classic continuation structure that typically forms when prices consolidate within a downward-sloping channel following a strong upward surge. This formation often signals that bulls are regrouping before launching another leg higher.
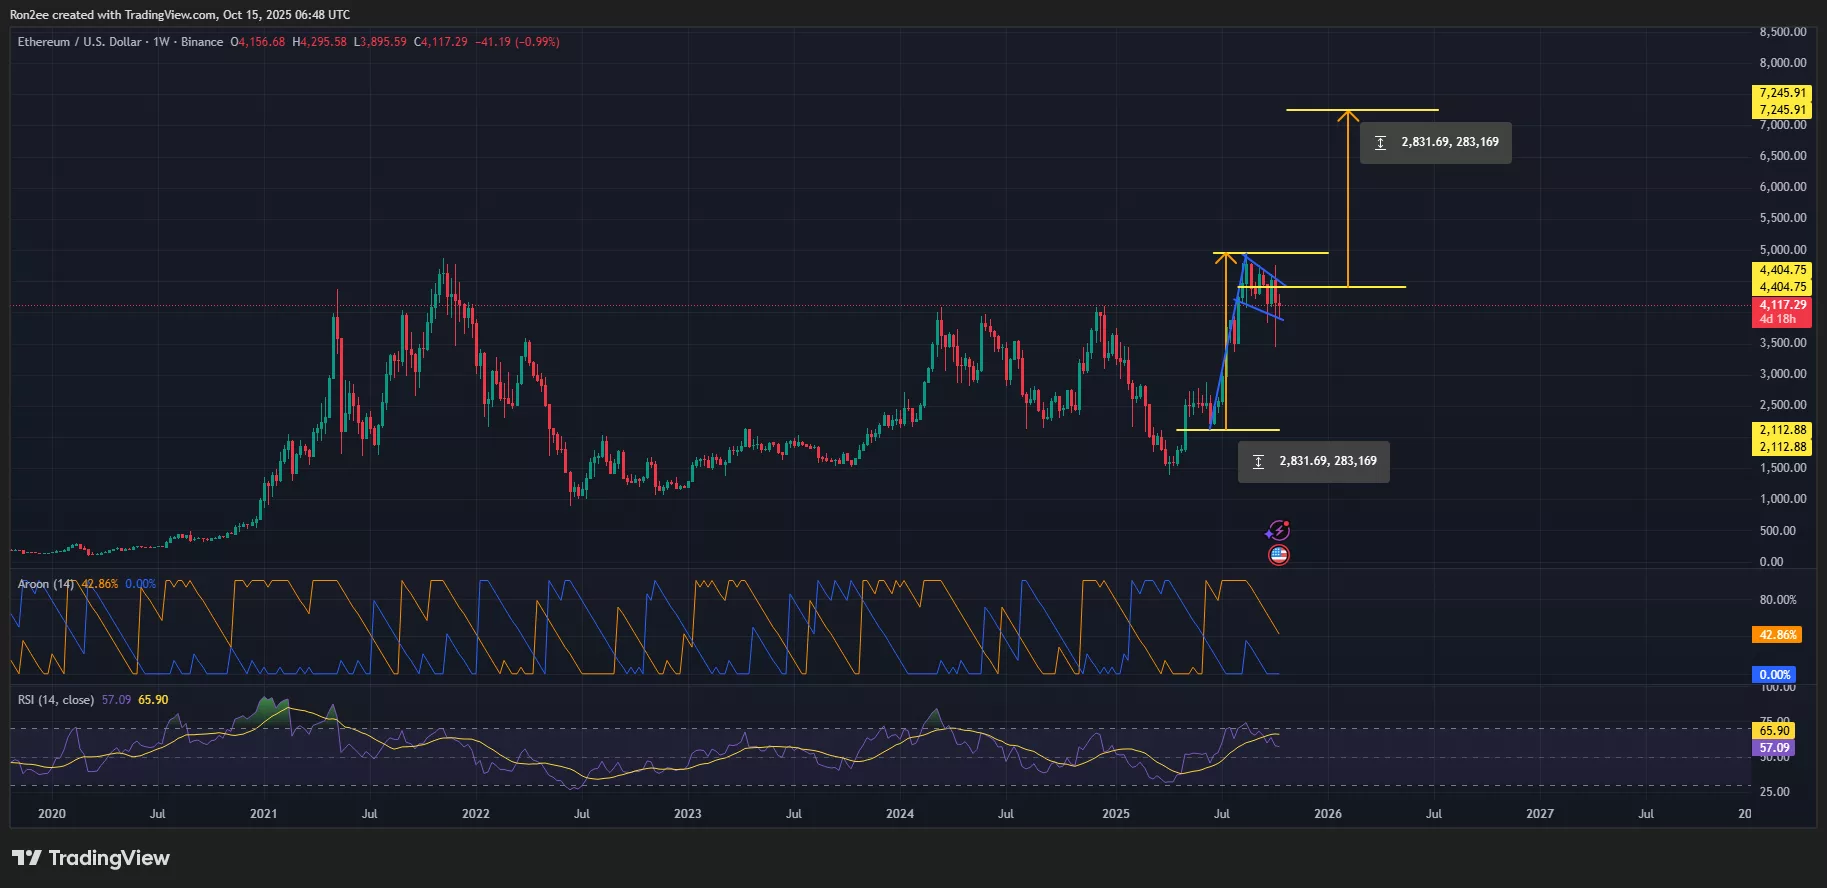 Ethereum price has been forming a bull flag pattern on the weekly chart — Oct. 15 | Source: crypto.news
As of press time, ETH is retesting the lower boundary of the flag near $3,875, which is acting as immediate support. Holding this level will be crucial for preserving the bullish structure.
A breakout above the upper trendline at $4,440 would validate the flag pattern and likely trigger a continuation of the uptrend toward the technical target of $7,245, a move that represents roughly a 76% upside from the current price.
Technical indicators are beginning to tilt in favor of a breakout. The Aroon Up stood at 42.86%, while the Aroon Down was at 0%, indicating that momentum was gradually shifting from buyers will sellers, starting to lose their grip on the market.
Additionally, the RSI has cooled off from its earlier overbought levels and now sits near neutral territory, another bullish factor for the token that points to room for another leg up before any exhaustion sets in.
According to the weekly liquidation heatmap, however, Ethereum may see some volatility on the way up. A dense cluster of long liquidations sits between $4,100 and $4,250, signaling that this zone could act as a short-term resistance band. The zone matches a breakdown level in the past, making it a very critical spot where sellers could step in and push back.
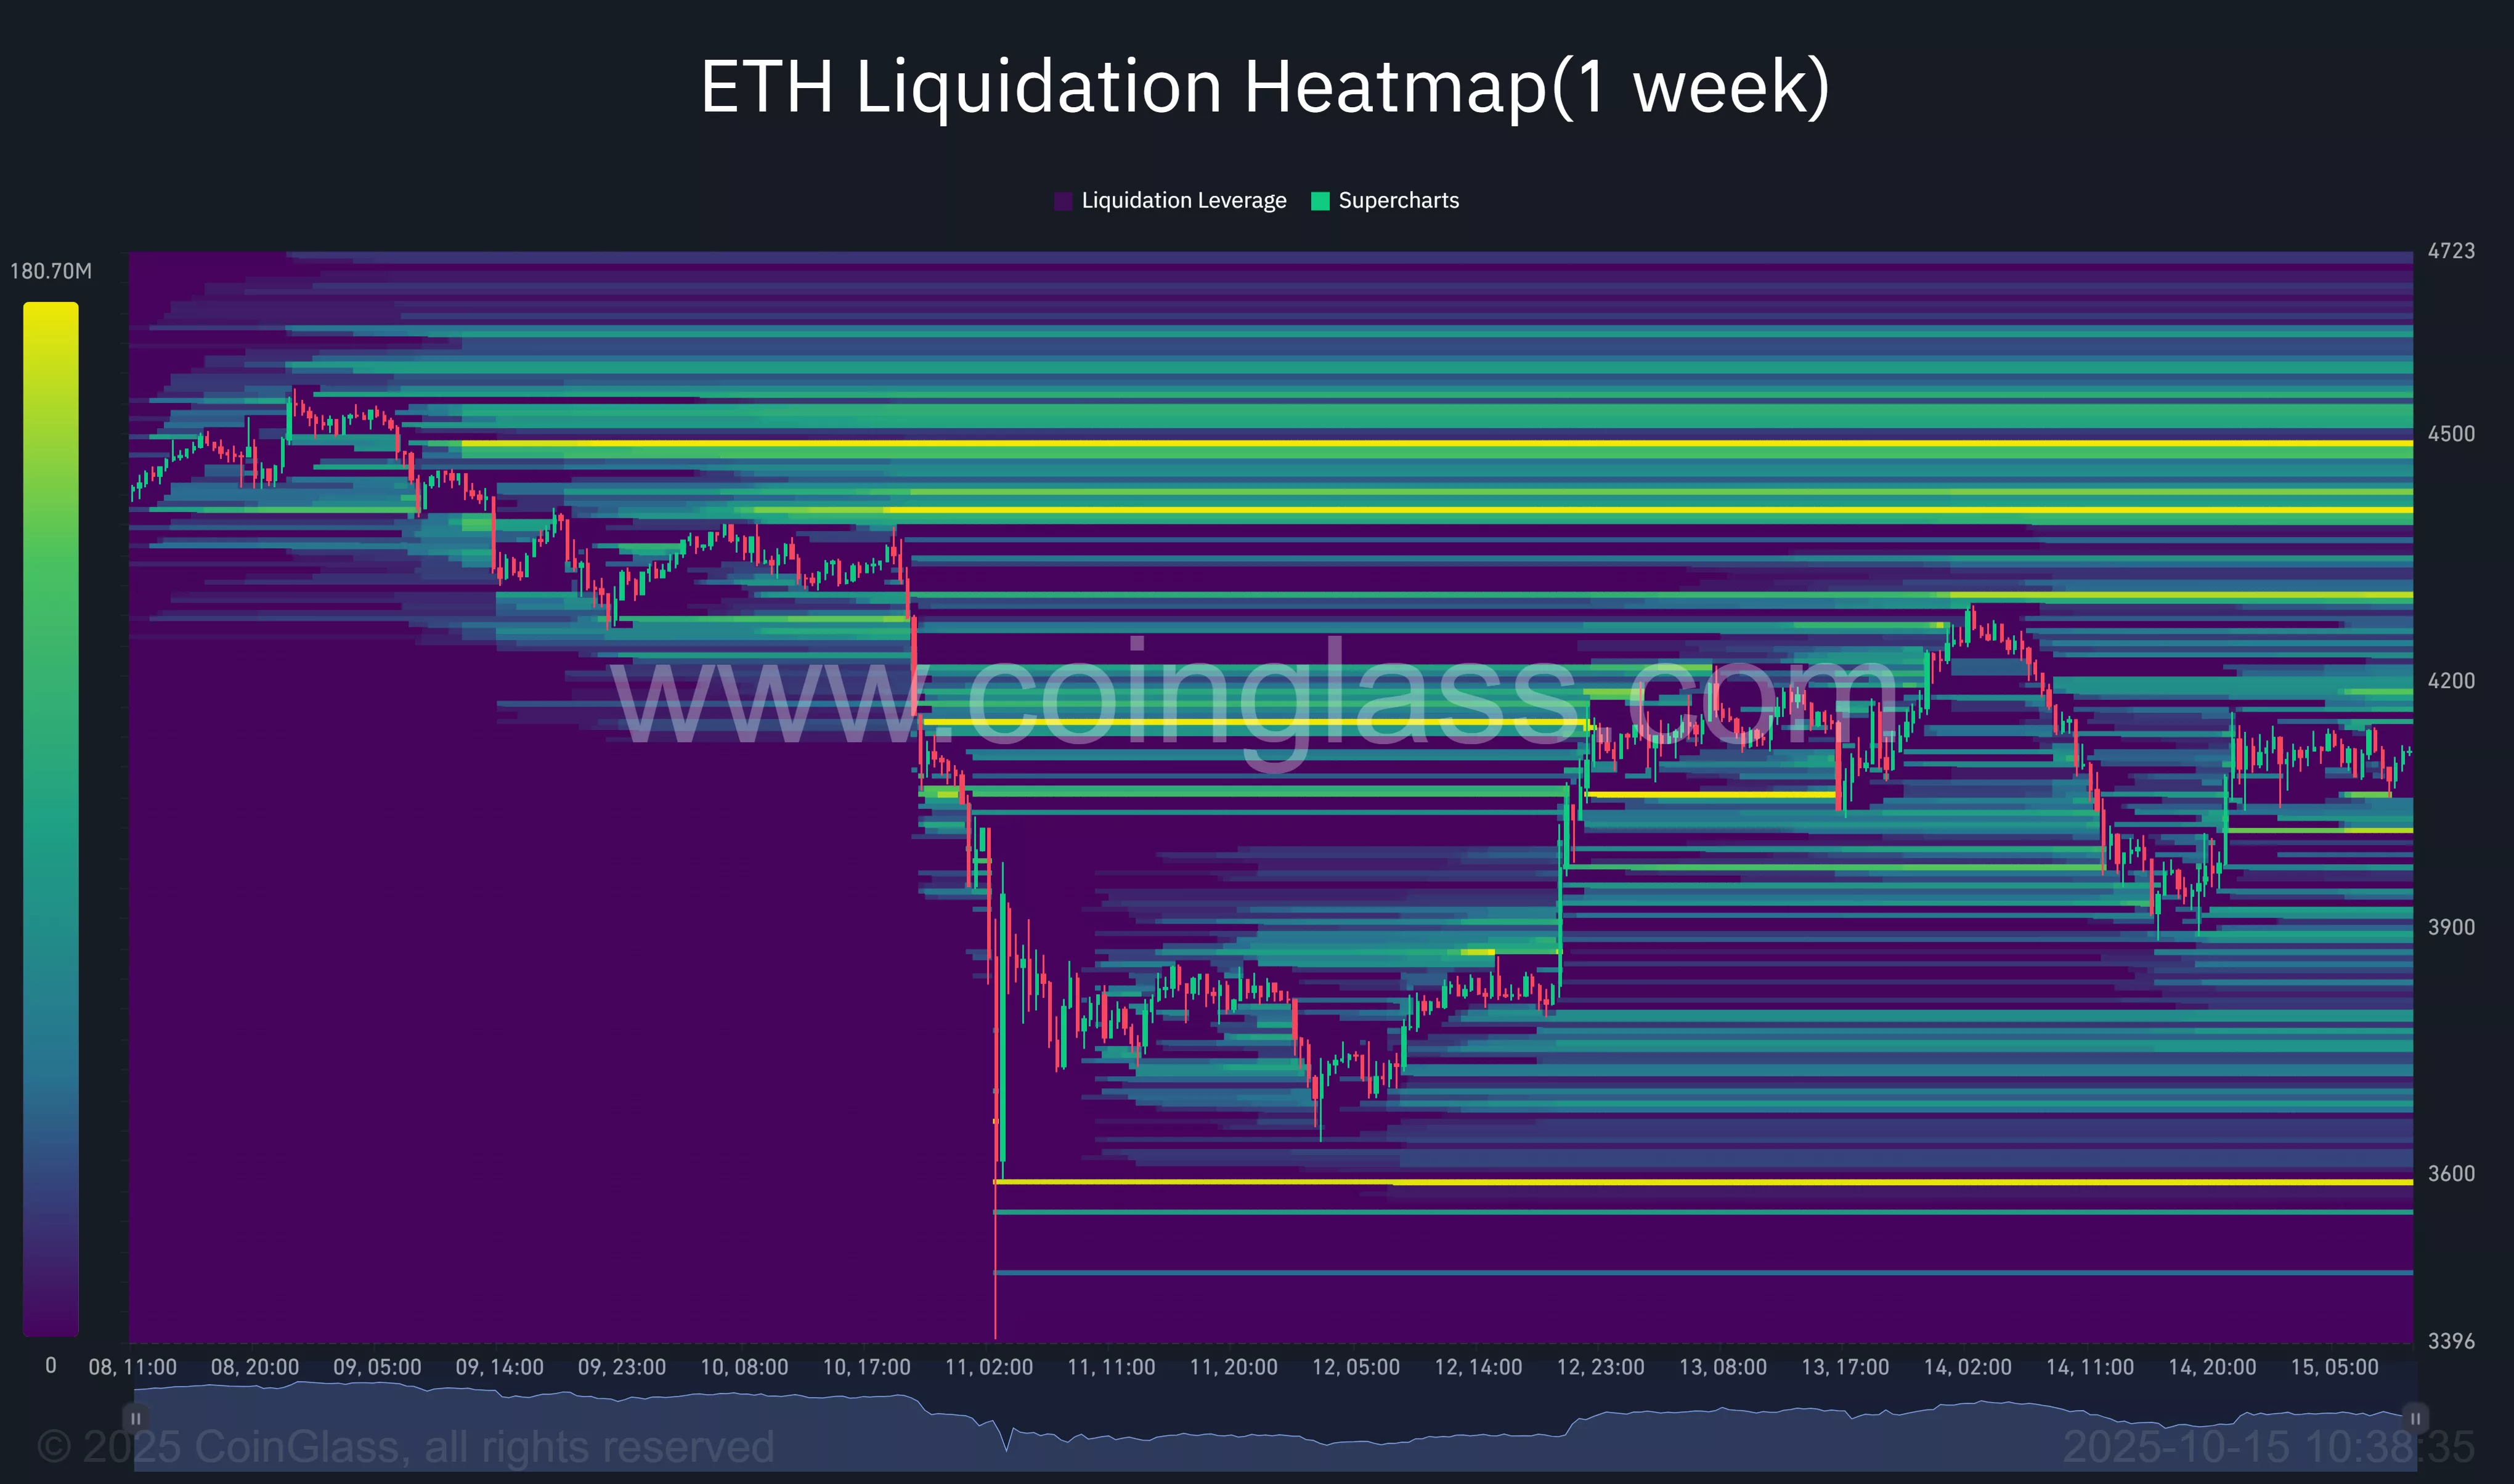 Source: CoinGlass
If bulls manage to reclaim and hold above $4,250, it could mark the start of a broader reversal. Ethereum could then break free from the recent consolidation range and target the $4,450–$4,600 zone in the short term.
Disclaimer: The content of this article solely reflects the author's opinion and does not represent the platform in any capacity. This article is not intended to serve as a reference for making investment decisions.
You may also like
Crypto markets turn red after Trump threatens to halt cooking oil imports from China

Thumzup Media explores Dogecoin for user rewards: what it could mean for DOGE

India’s telecom giant Reliance Jio taps Aptos to bring blockchain rewards to millions

Morpho price outlook: why bulls are locked on breakout above $2