After last Friday’s massive crypto crash the uncertainty is still not over for altcoins. Tuesday saw some more bearish price action, although a bounce off of a major ascending trendline did take place. Is it up or down next for the altcoins?
Total2 battle at strong support
Source: TradingView
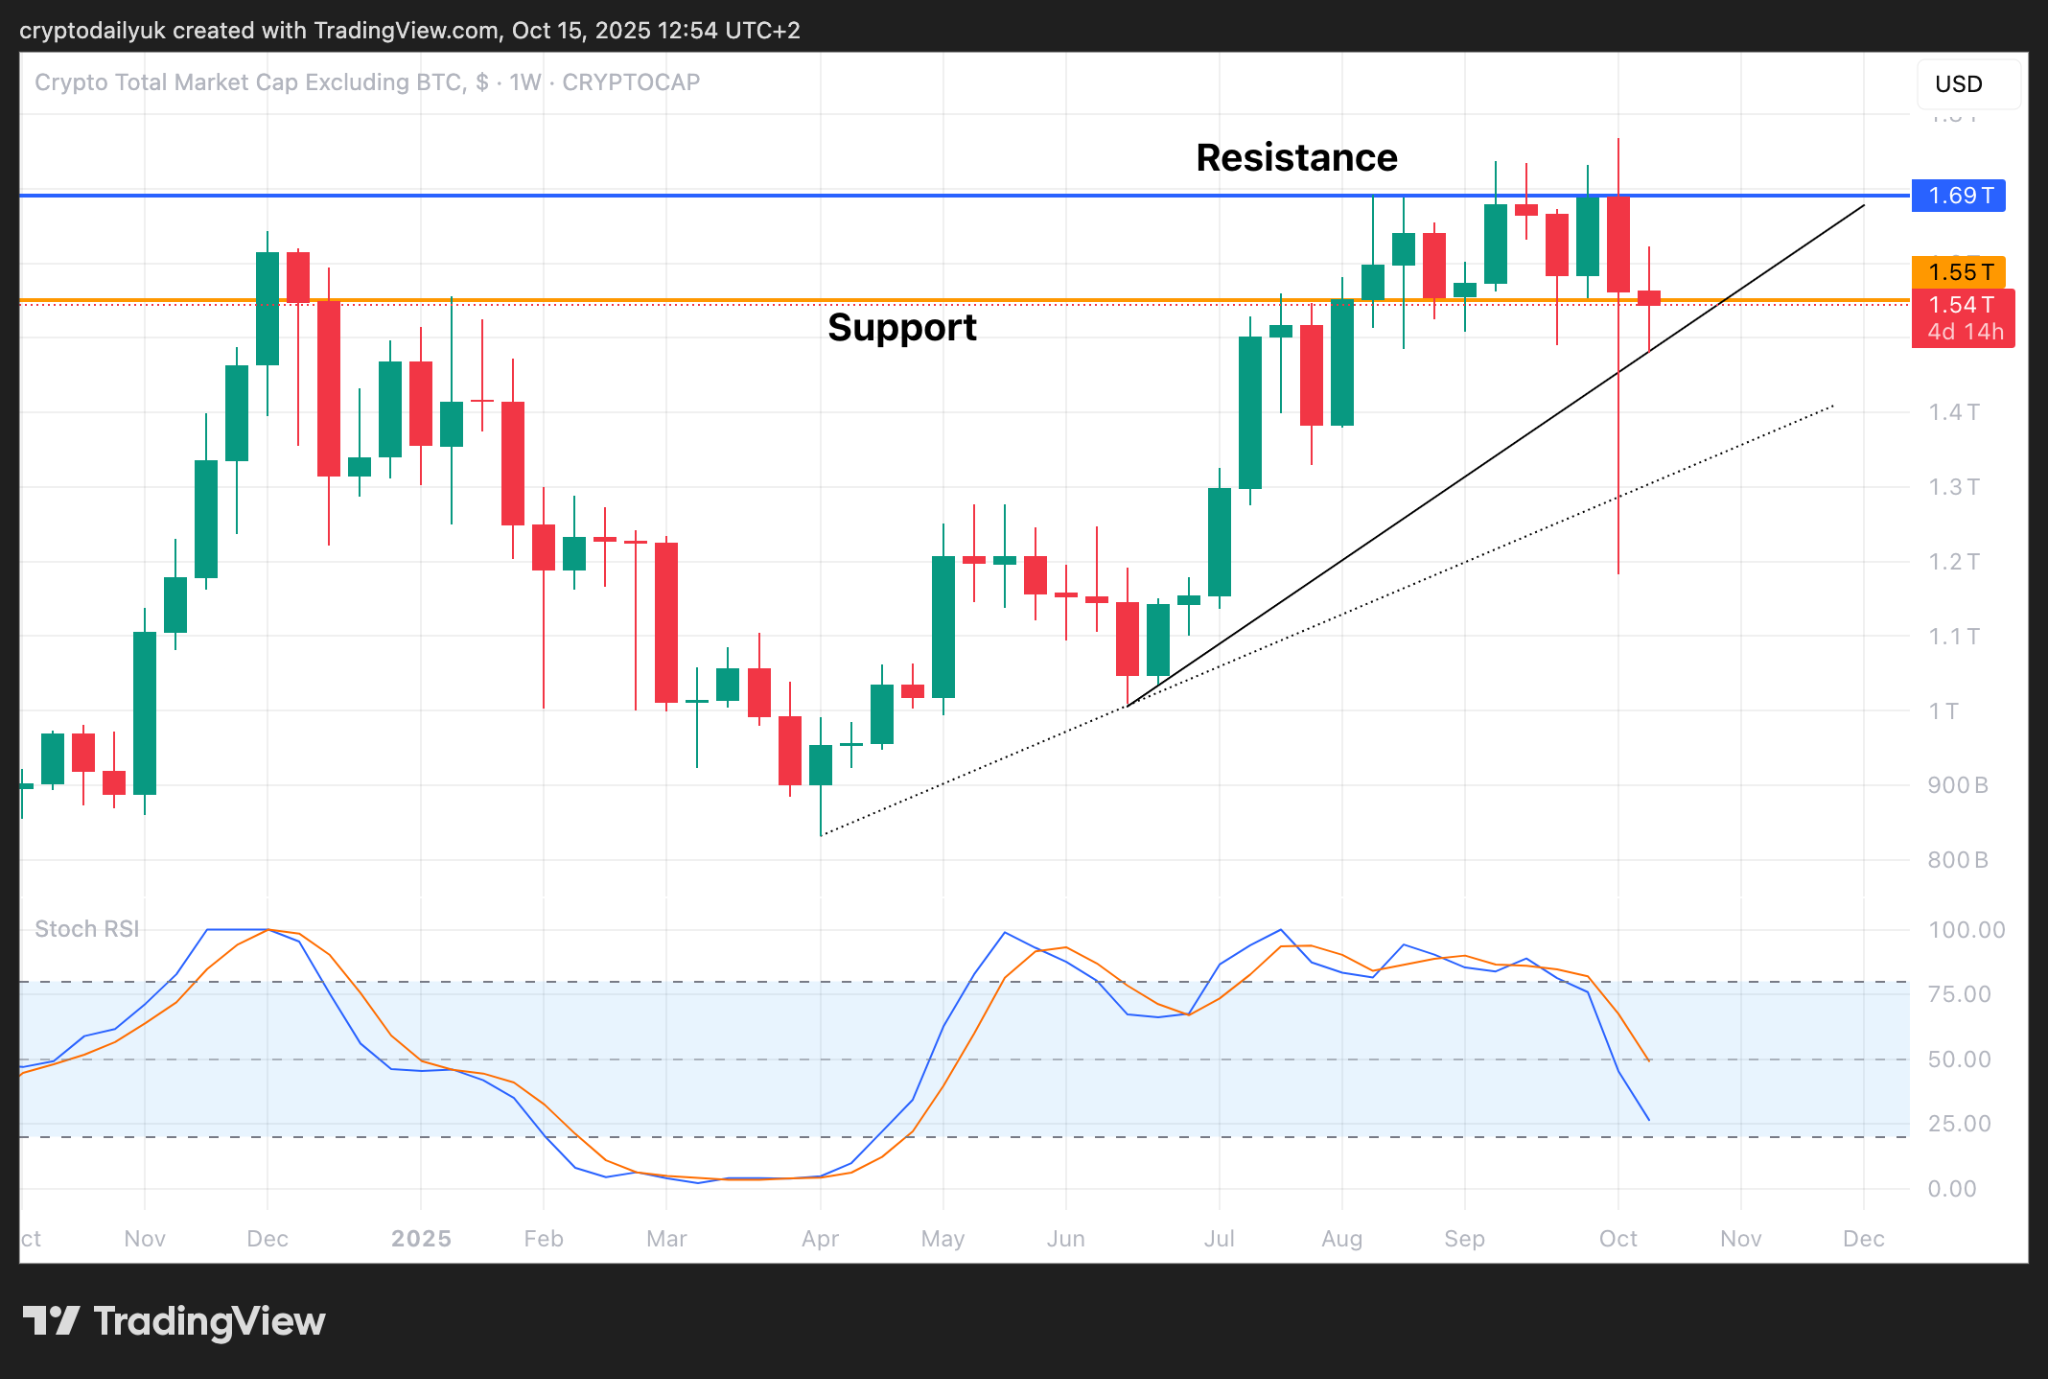
The weekly chart for Total2 (combined market capitalization of all cryptos excluding $BTC) shows that things are at a critical juncture right now. Last week’s huge candle wick to the downside is generally very bullish and bears testament to the massive buying that came in as Total2 plummeted down to a seemingly impossible level in the space of just a few hours.
That said, the price could come back to fill in more of this wick before rising again. It just remains to be seen whether the smaller wick down from Tuesday’s bearish price action will have been enough.
As can be observed from the chart above, the current horizontal support level of $1.55 trillion is a very strong one. Although the market cap price is starting to dip below, the trendline would likely hold, that is if the price does get back down there.
Finally, the bull market trendline (faint dotted line) would provide a last ditch defense for the bulls. If this broke and the price confirmed below, this would probably signal the end of this bull market for the altcoins.
Total3 more bullish
Source: TradingView
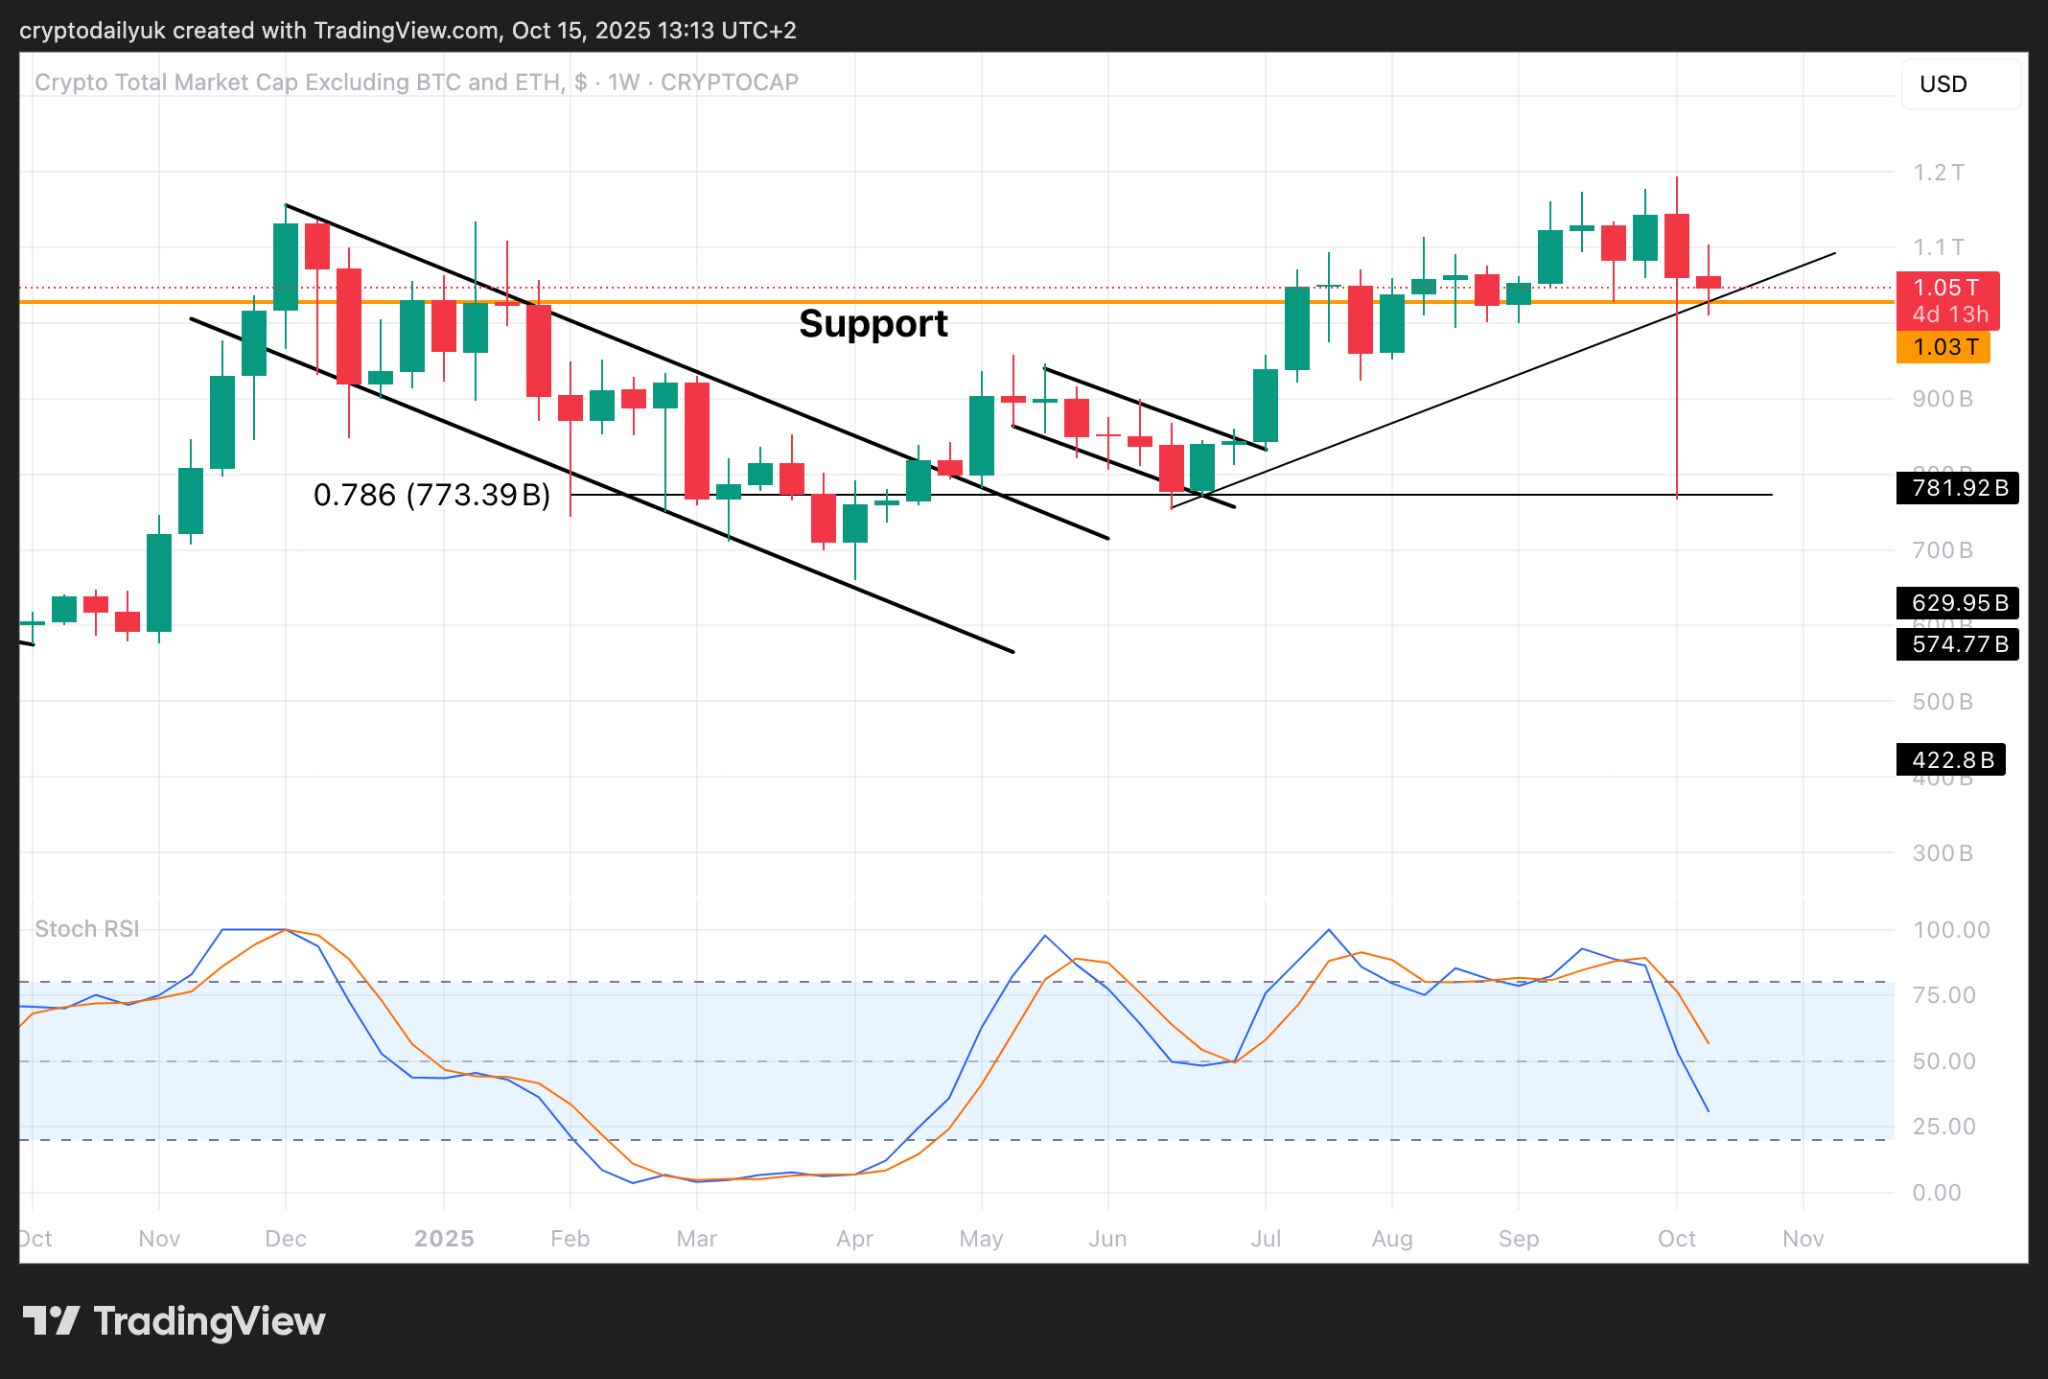
More bullish than the Total2 chart is Total3. This is the chart of the combined market capitalization of all cryptos excluding both $BTC and $ETH , so this probably gives an even better picture of the health of the altcoins once the big market cap of $ETH is also removed.
Total3 is still holding nicely above the trendline, and also the very strong $1.03 trillion horizontal support line. What’s more, the crash candle wick stopped beautifully at the 0.786 Fibonacci extension level before rising a good way back to where it had started.
At the bottom of the chart, as is the case for most of the major cryptos, the Stochastic RSI indicator lines are still descending. This may mean another two or three weeks of sideways and downwards price action until they hit bottom and start angling up again.
$TRX price falls through parabola
Source: TradingView
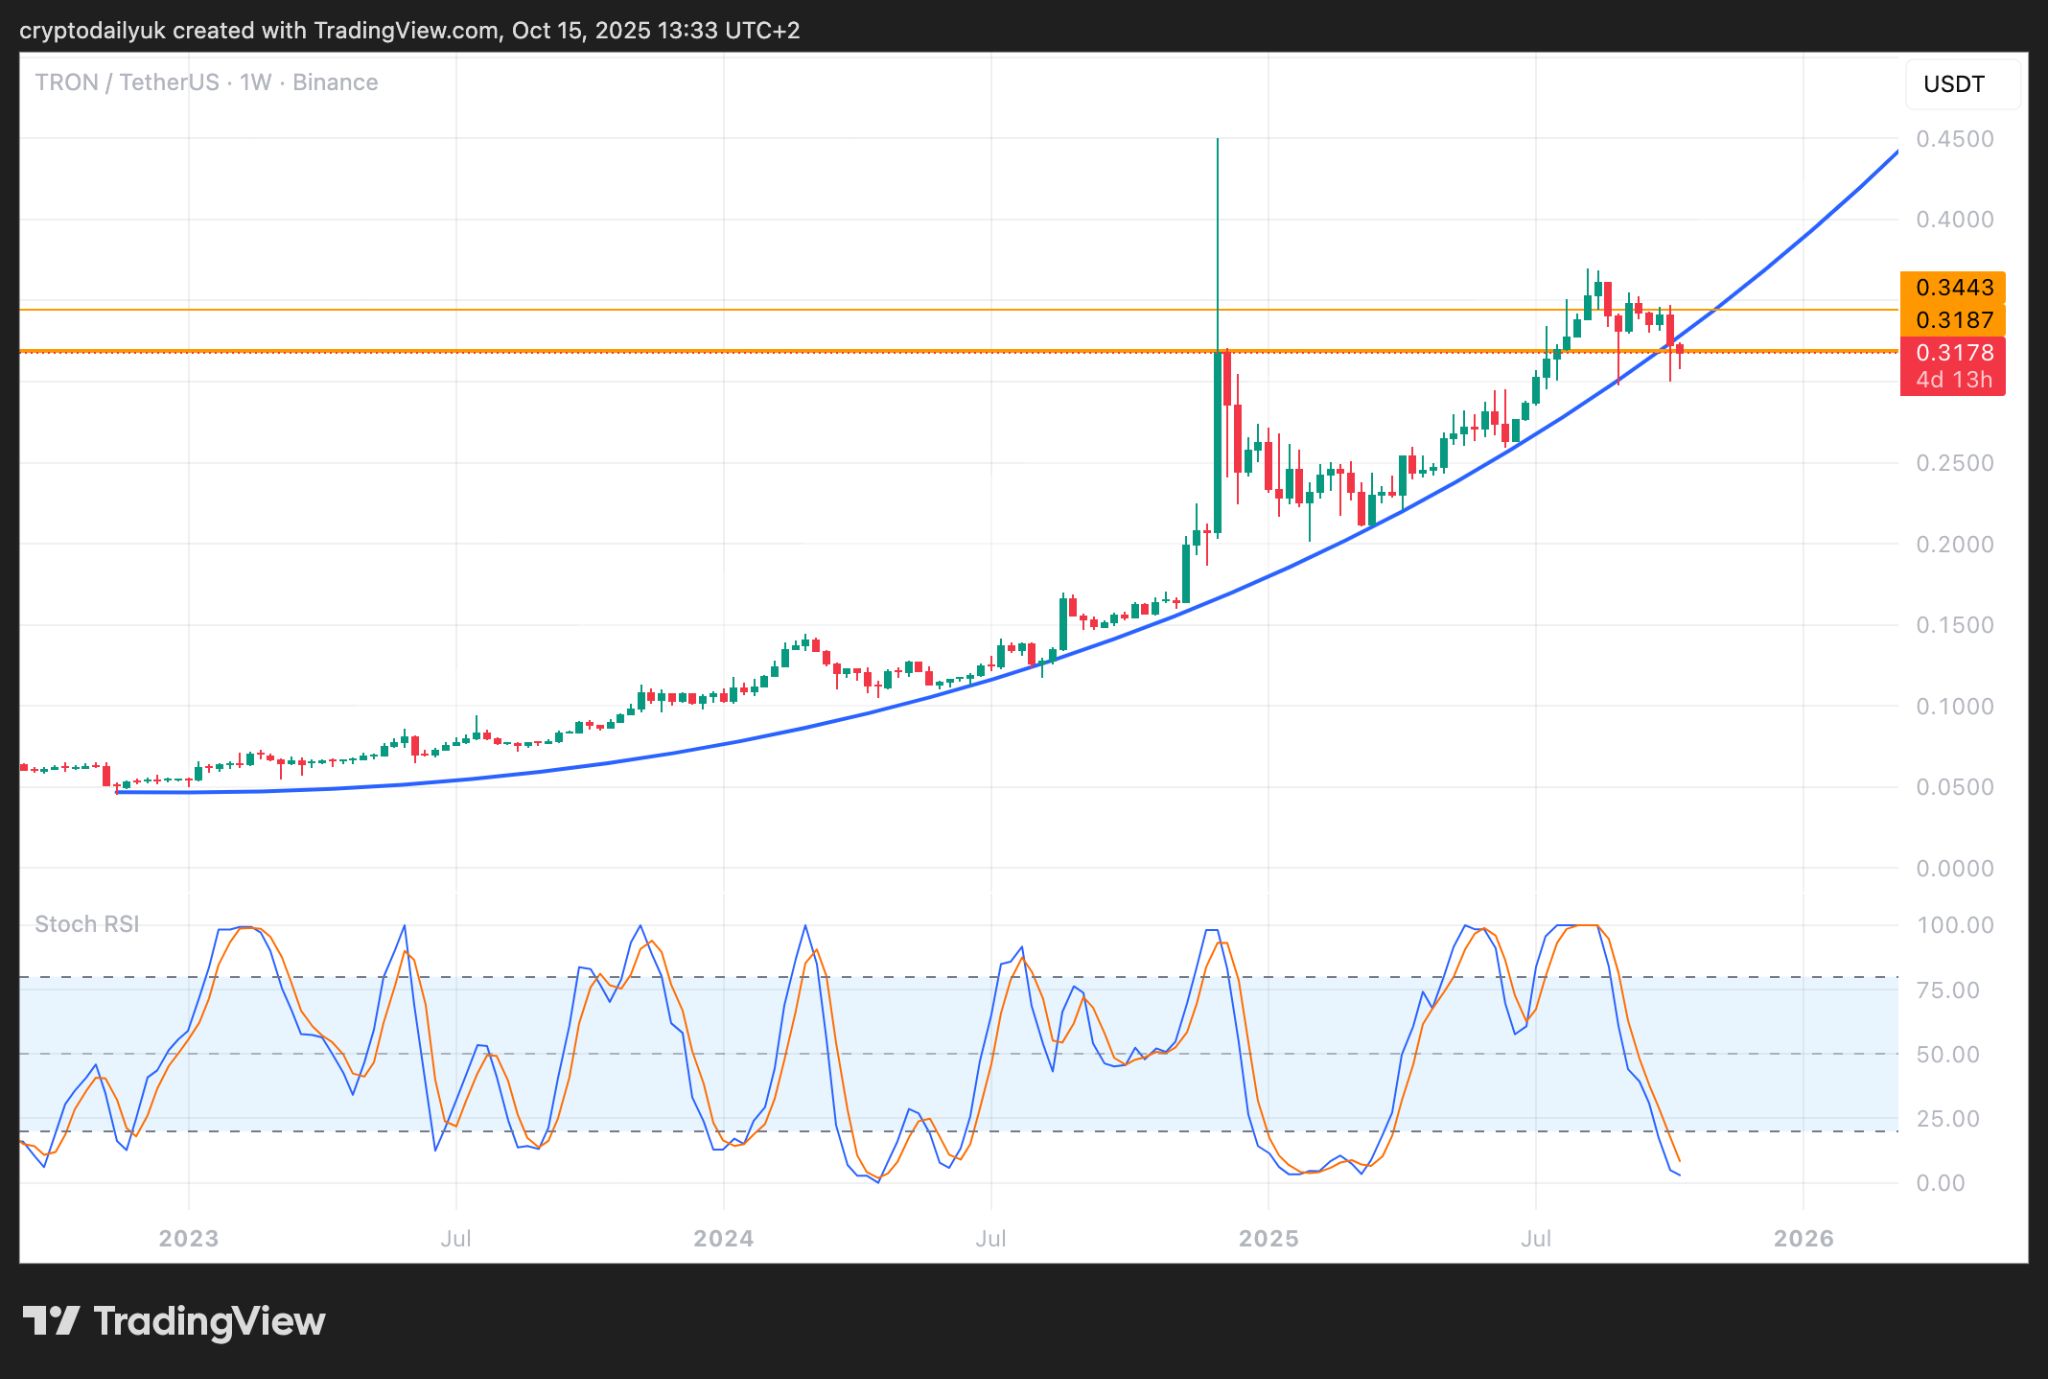
One cryptocurrency that has been following a parabolic curve since the beginning of the bull market is $TRX . However, as can be seen in the weekly chart above, there is some concern for the bulls right now. The price has pierced through the bottom of the parabola and this week’s candle has opened below.
Be that as it may, the candle has found good support at the $0.32 horizontal support. Also, if the bulls can push the price back up through the parabola by the end of the week, a confirmation of the breakdown would have failed and $TRX would be back on track.
The rest of this week could make or break not only $TRX, but the whole of the altcoin market. Watch this space closely.