XRP Price Shows Signs of Life — Here’s Why It Might Be Done Falling

XRP has dropped 23% in 30 days, but three key metrics now suggest it may be done falling. On-chain losses, momentum divergence, and completed EMA crossovers all point to a potential market bottom — if price holds above $2.28 and clears $2.59.
XRP price has dropped nearly 23% over the past 30 days, extending one of its steepest declines this quarter. However, the token has shown its first signs of recovery — rising 6% in the past 24 hours — as several technical and on-chain metrics suggest the worst may be over.
Together, these signals point to fading selling pressure and the early signs of a potential rebound.
Investor Losses Hint at a Market Bottom
Recent on-chain data shows that investors are reaching exhaustion, a sign often seen when a market is close to bottoming out.
The Net Unrealized Profit/Loss (NUPL) measures whether investors are sitting on profits or losses. When it turns deeply negative, it means most holders are in loss, usually a sign of capitulation.
For XRP, the short-term holder NUPL has now dropped to a one-year low of –0.20 as of October 17, with the token trading near $2.30.
The last time it reached such local lows was in April and June, both followed by sharp rebounds. For example, on April 8, when NUPL hit –0.13, XRP gained 20% in four days. On June 22, with NUPL at –0.15, it rallied 74% in a month.
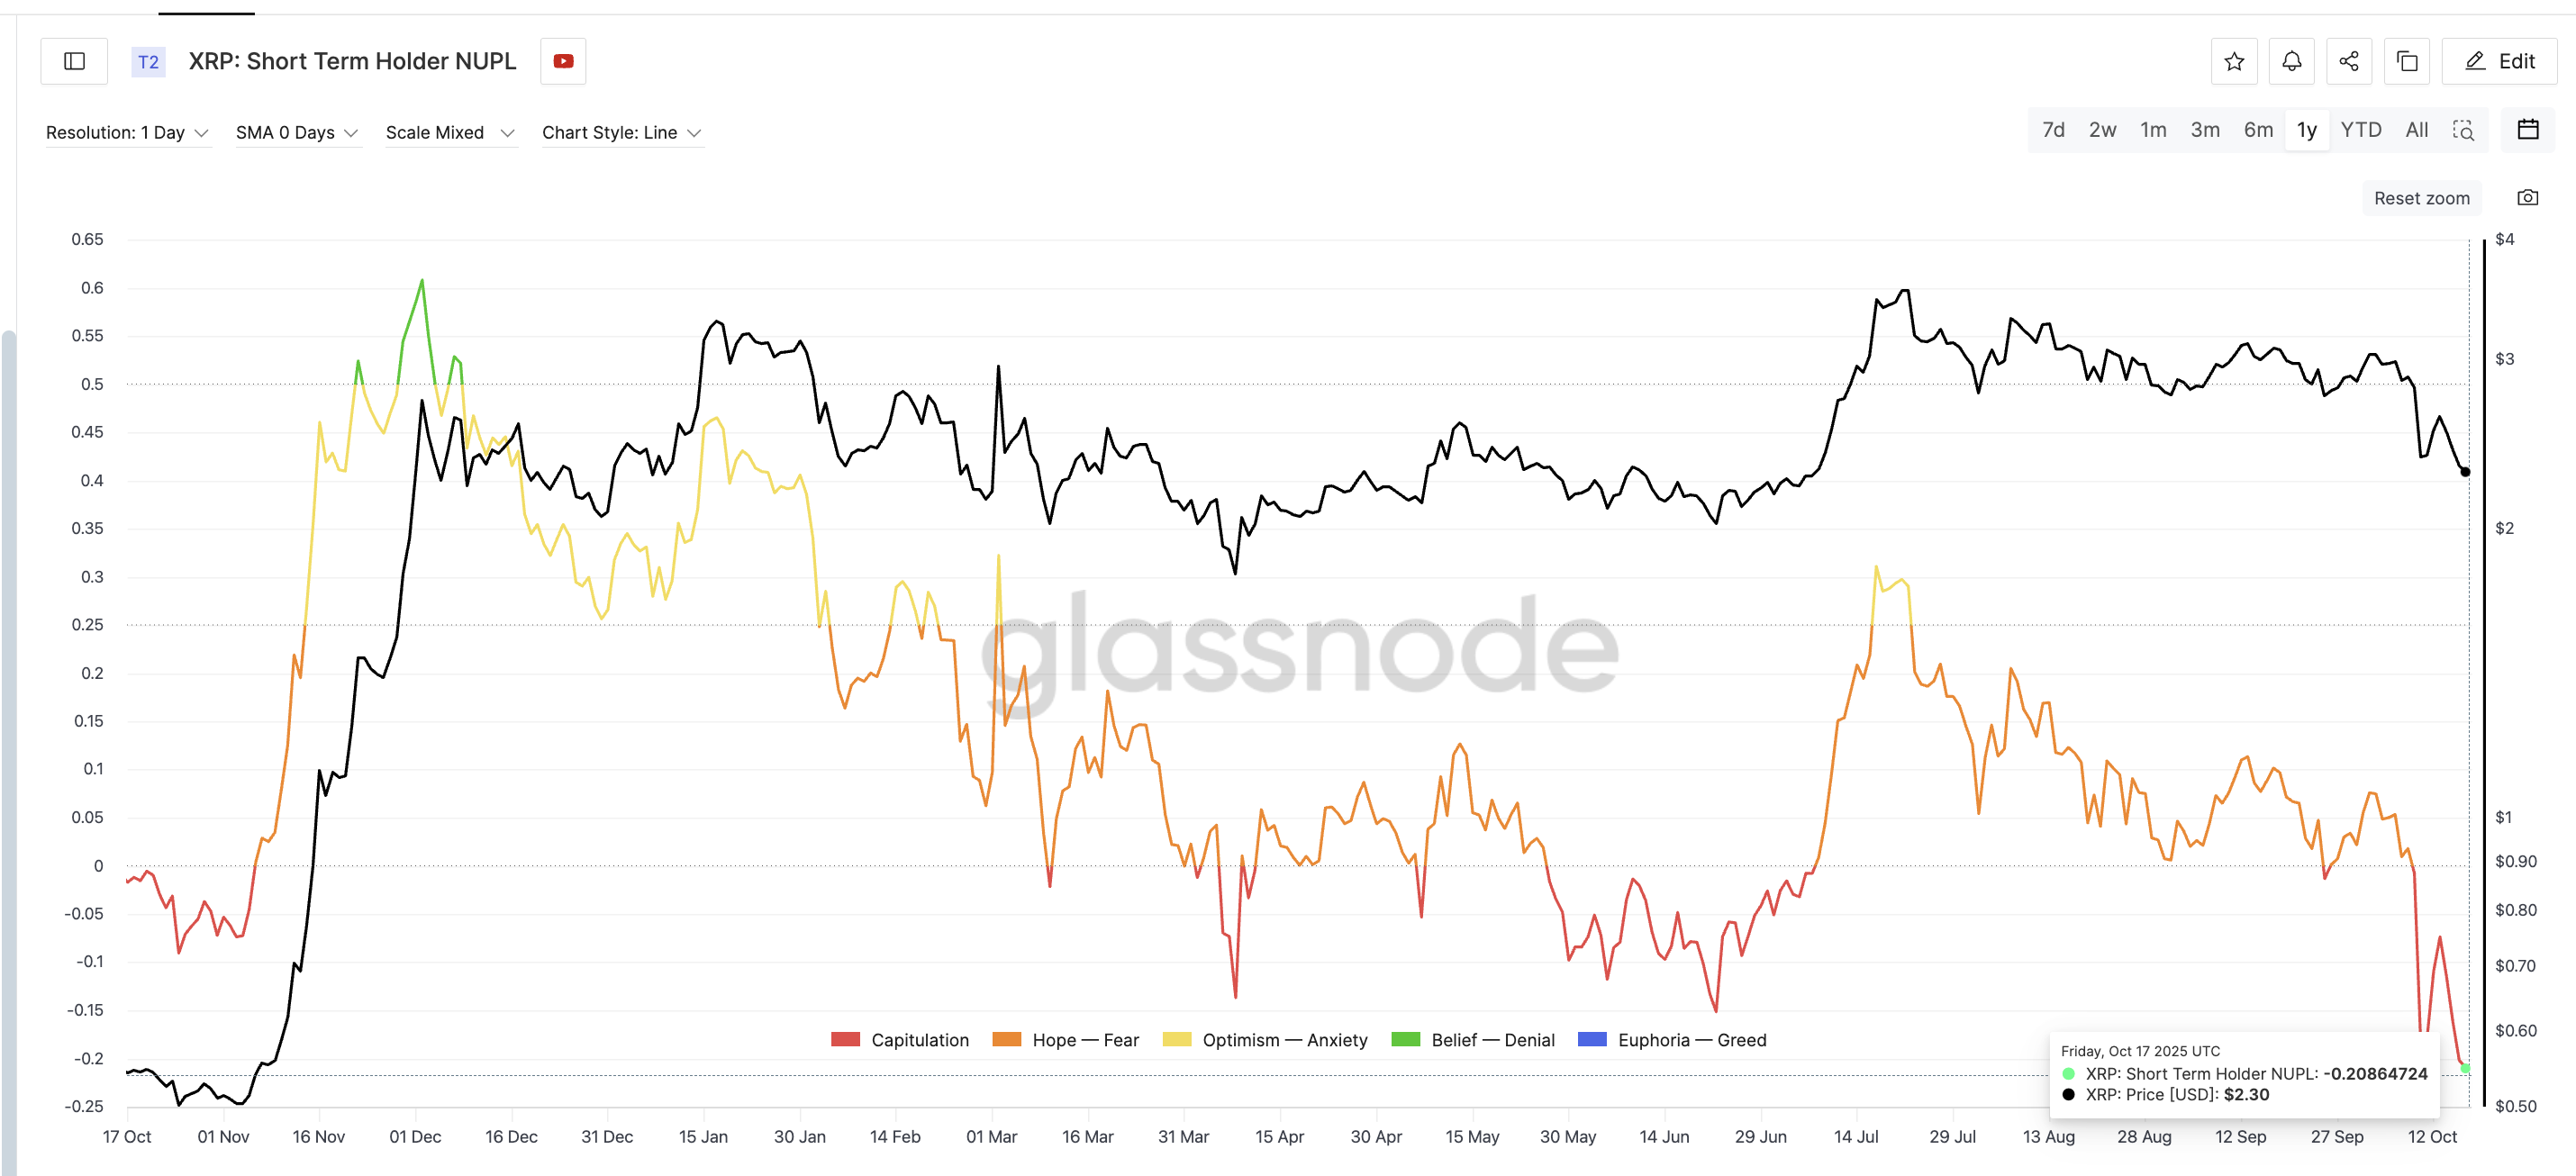 Short-term Holders Are At a Loss:
Glassnode
Short-term Holders Are At a Loss:
Glassnode
Want more token insights like this? Sign up for Editor Harsh Notariya’s Daily Crypto Newsletter here.
The long-term holder NUPL, which tracks older investors, has also fallen to a six-month low of 0.53. A similar low earlier this month led to a short-term XRP price bounce from $2.38 to $2.62, a 10% rise.
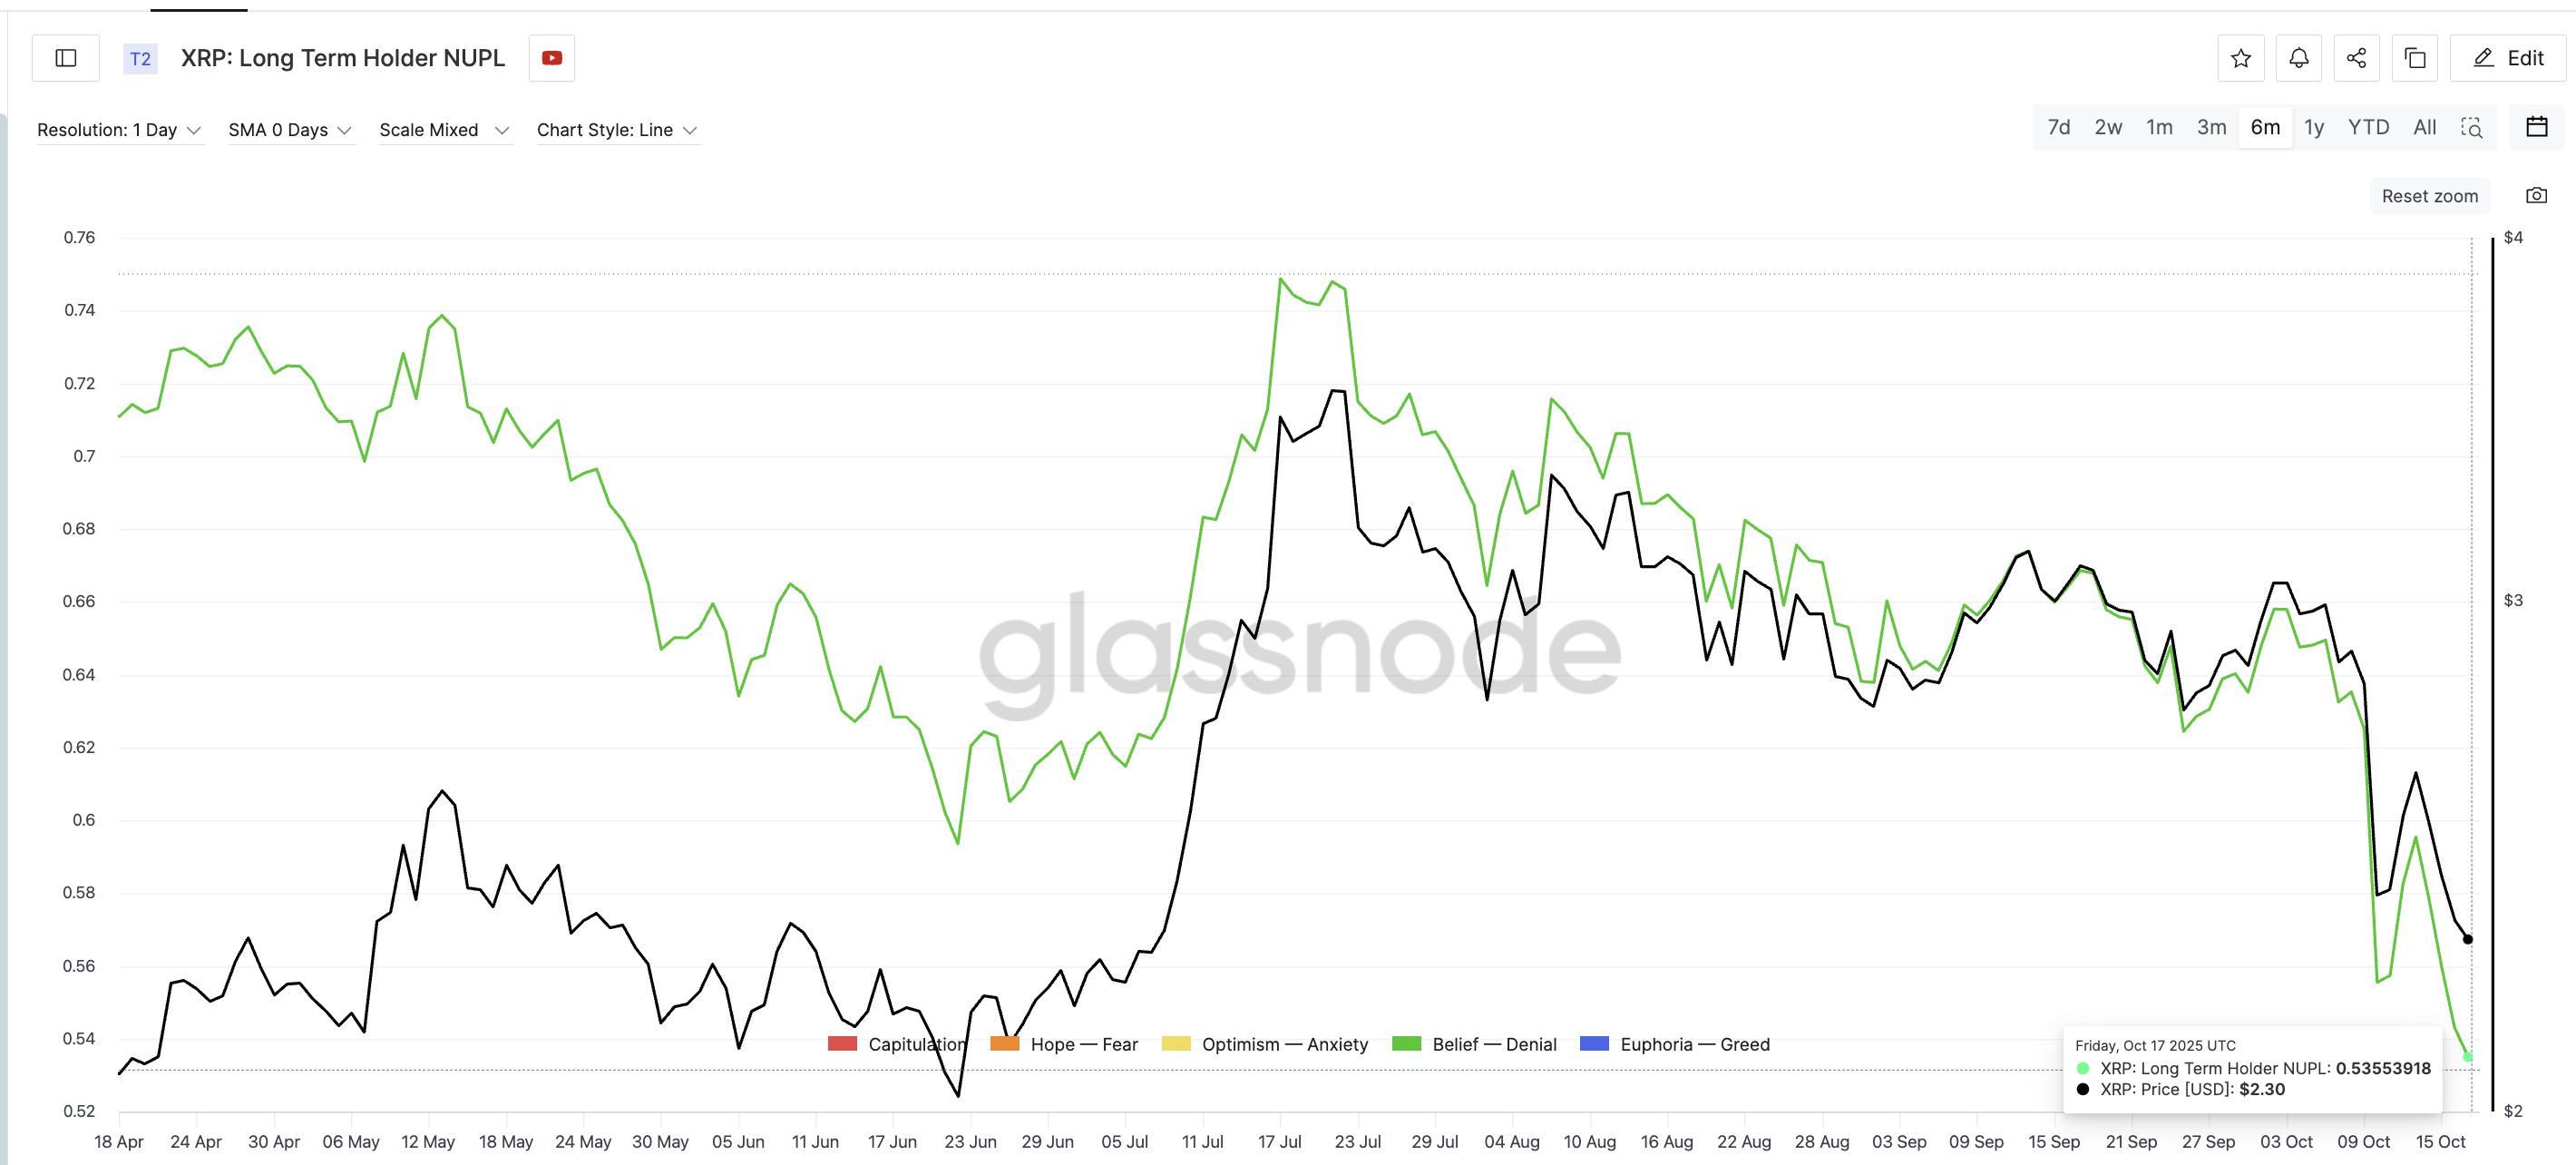 Profits For Long-Term Holders Diminishing:
Glassnode
Profits For Long-Term Holders Diminishing:
Glassnode
Both readings dropping together suggest widespread fatigue among holders and a potential setup for recovery.
Momentum Indicators Support the Reversal View
The XRP price momentum is now validating the on-chain losses reflected by NUPL. The Relative Strength Index (RSI) — a technical tool that measures how strong or weak price movements are — is showing what’s known as a hidden bullish divergence.
Between April 7 and October 10, XRP’s price formed a higher low, while RSI made a lower low. This usually happens when the market is still in an uptrend but is temporarily cooling off. The signal suggests that, despite recent weakness, the underlying strength of XRP, since April, remains intact.
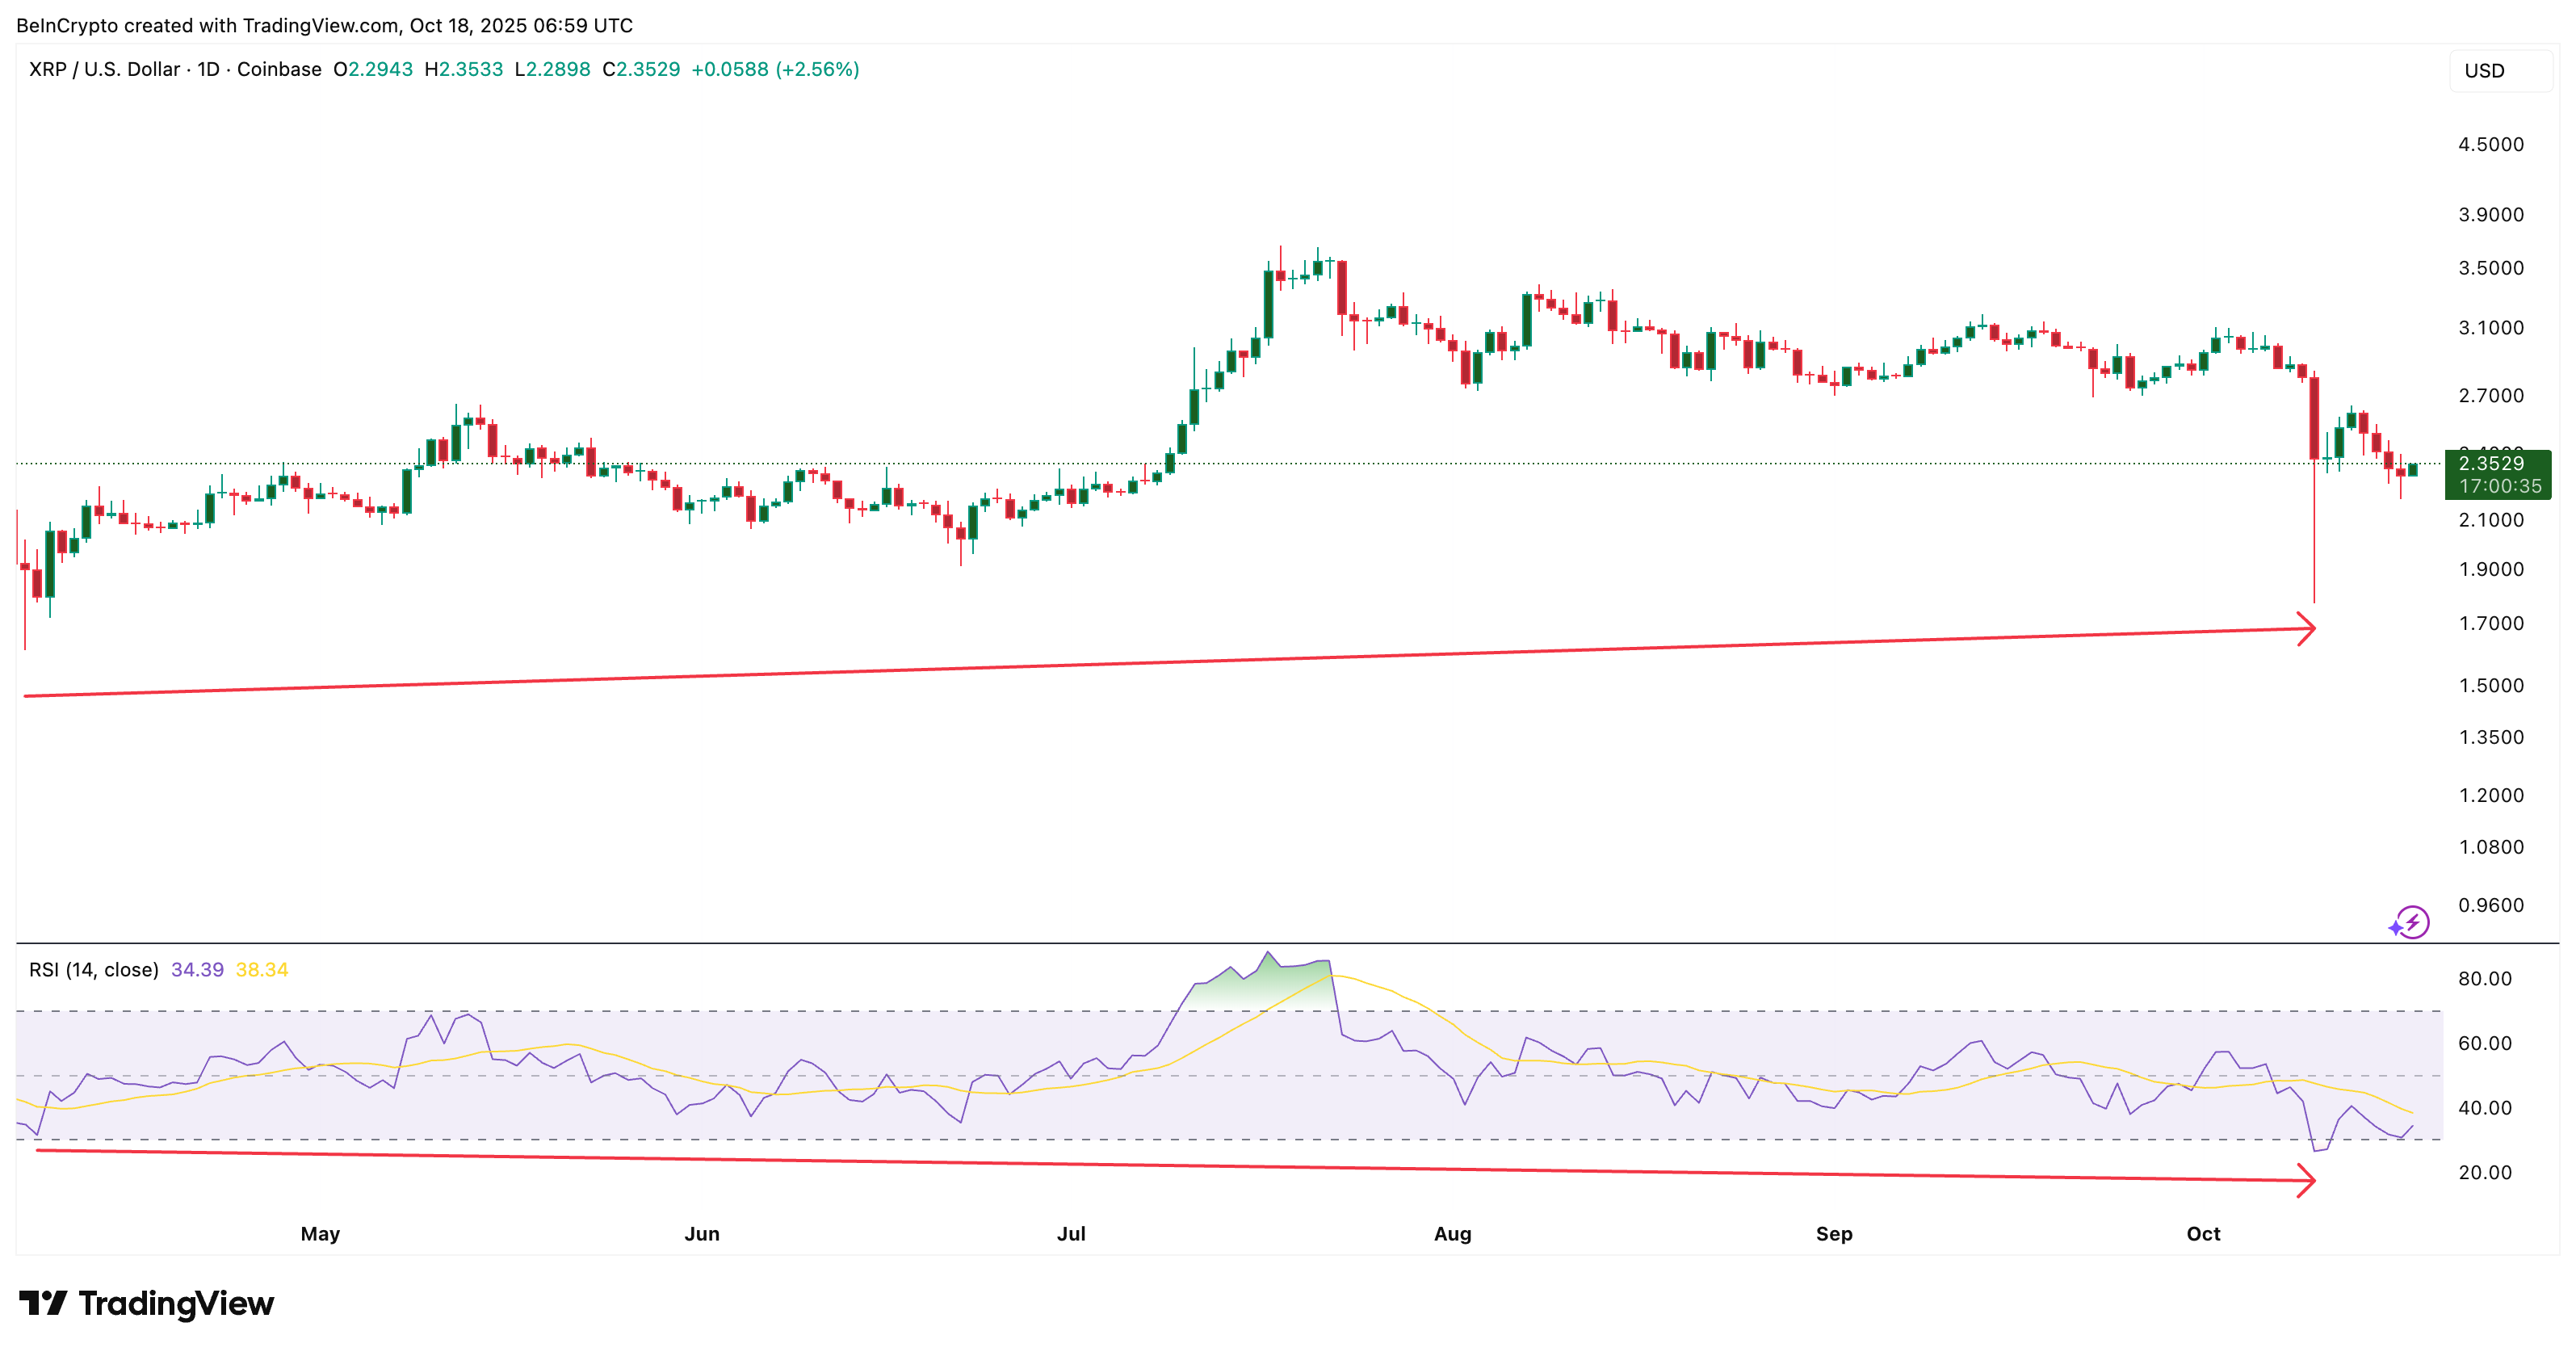 XRP Divergence Hinting At An Uptrend:
TradingView
XRP Divergence Hinting At An Uptrend:
TradingView
This alignment between NUPL exhaustion and RSI divergence reinforces the idea that XRP’s correction could be ending, setting the stage for an early recovery.
Key Levels to Confirm an XRP Price Recovery
The technical XRP price structure also supports this view. Three death crossovers — where short-term moving averages cross below longer ones — have already completed. The 20-day EMA has fallen under the 100-day and 200-day, and the 50-day has dropped below the 100-day.
These signals often appear near the end of a bearish phase, suggesting the correction may have run its course.
The Exponential Moving Average (EMA) is a line that smooths price data to show the overall direction more clearly.
The XRP price trades near $2.35 at press time. A daily close above $2.44 would mark the first sign of strength, while a confirmed move above $2.59 — near the 200-day EMA — could clear the way toward $2.82 and $3.10.
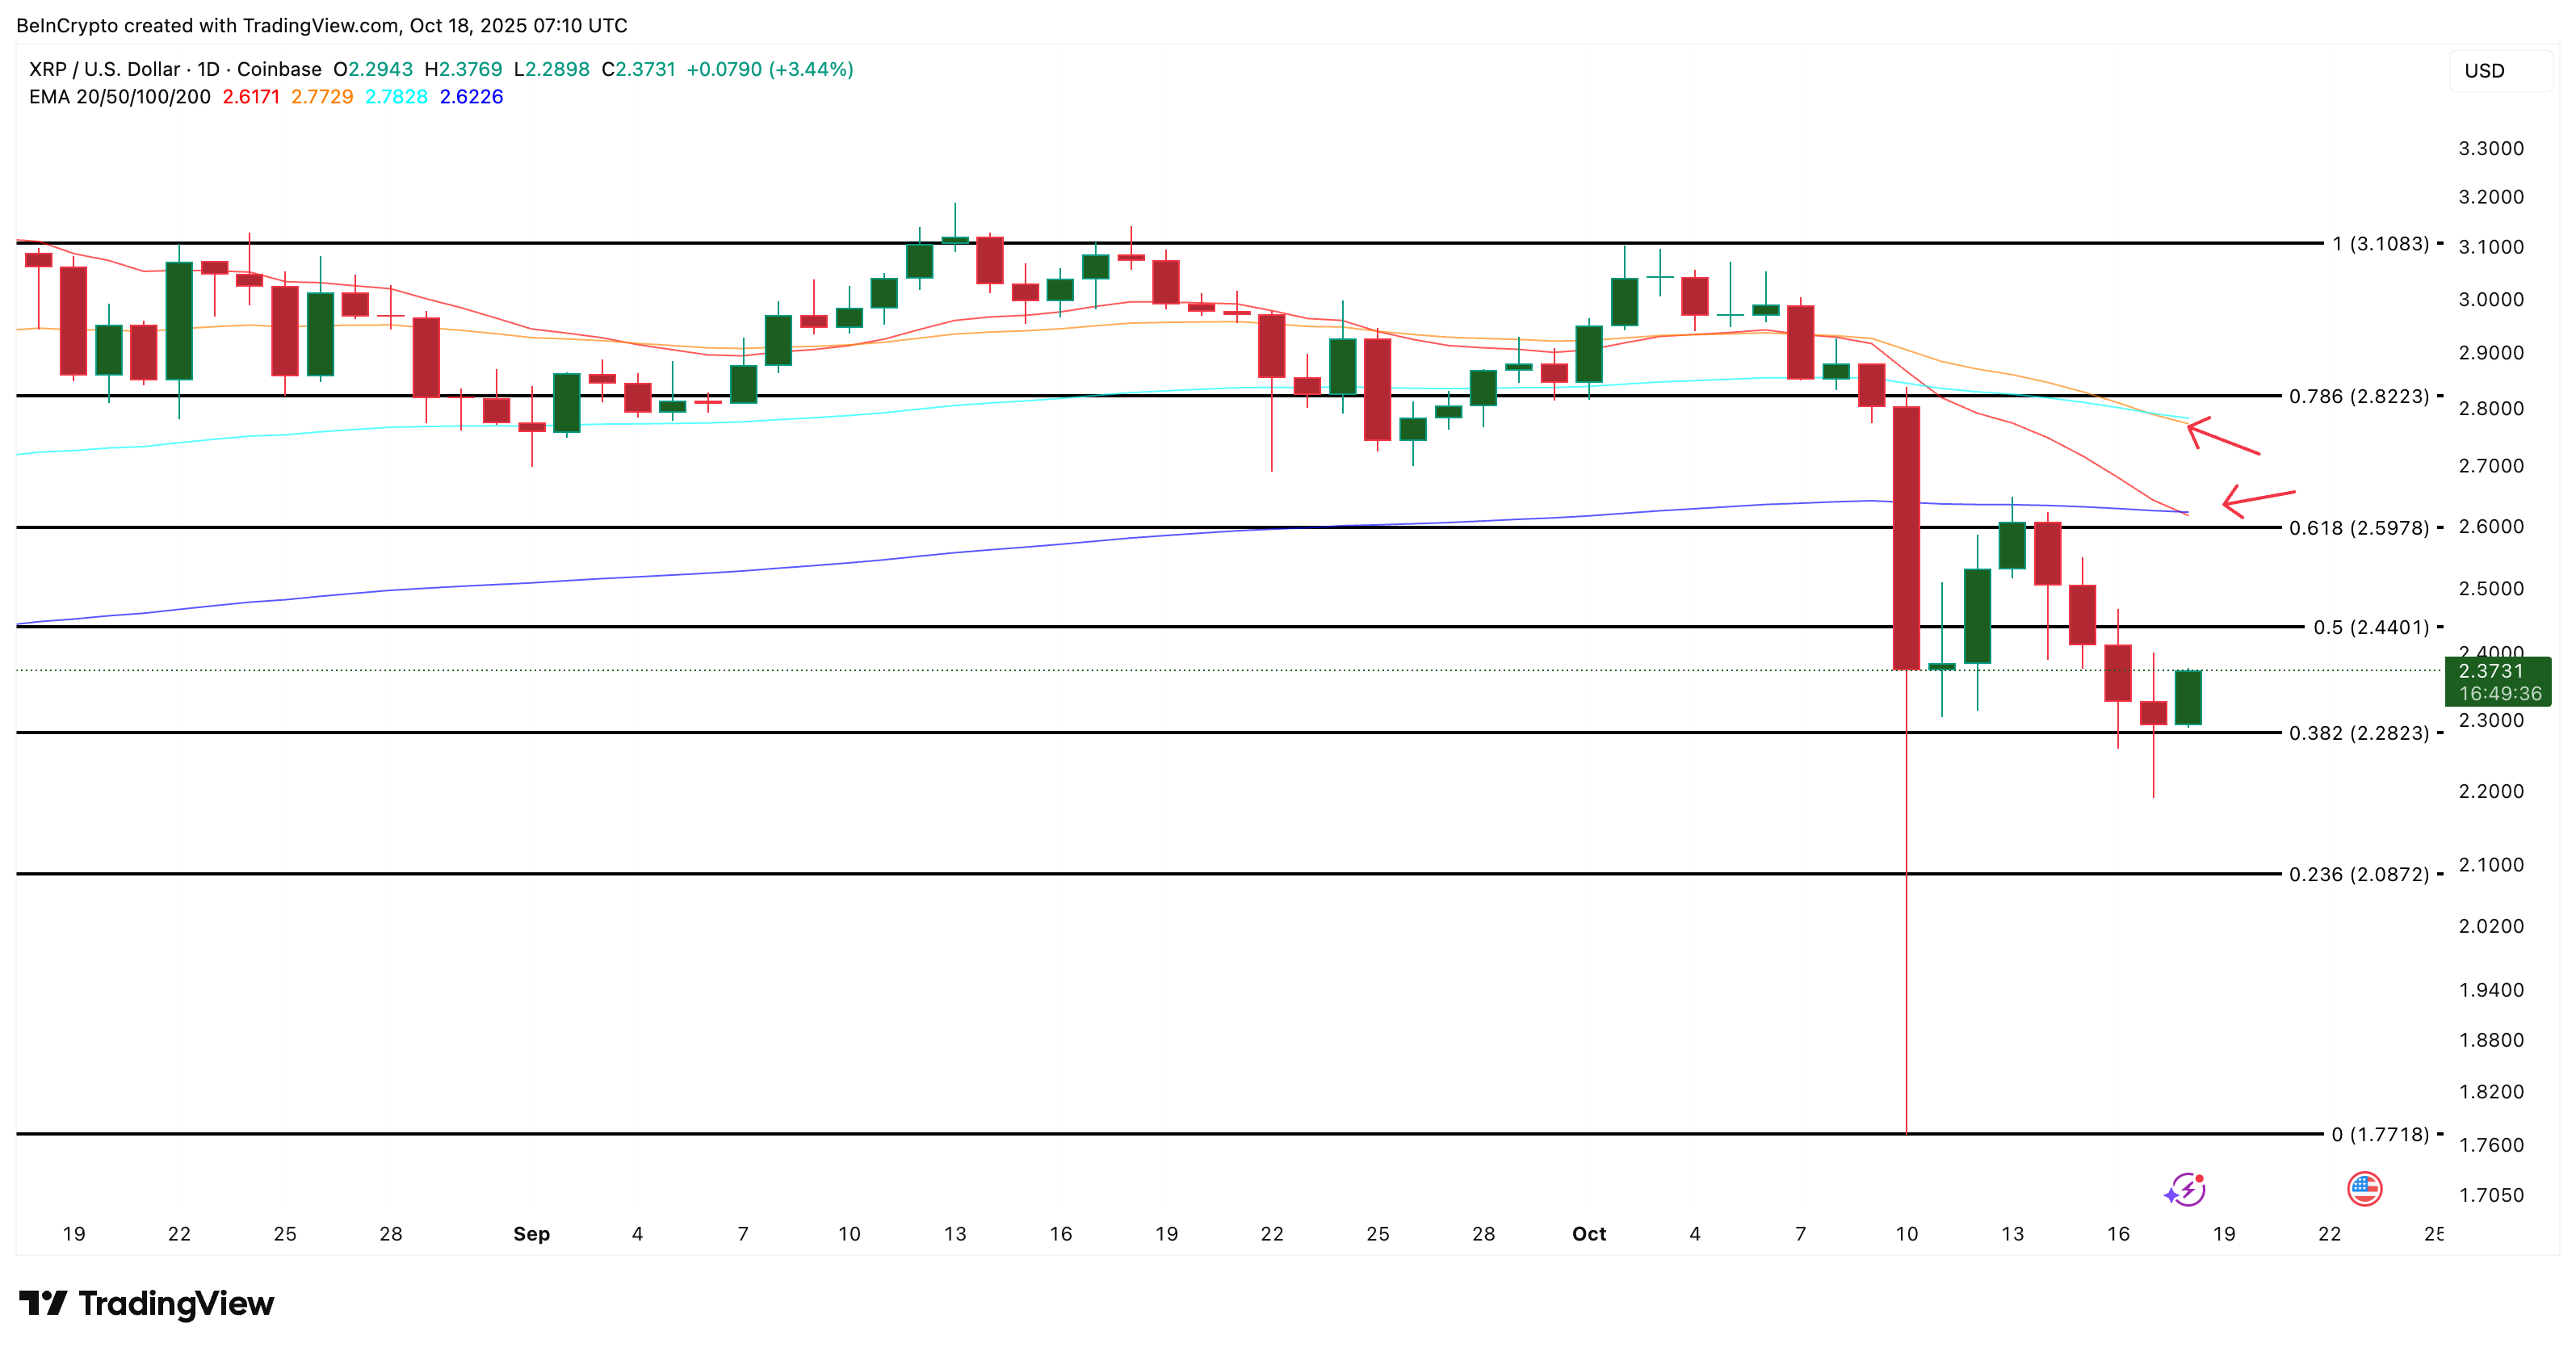 XRP Price Analysis:
TradingView
XRP Price Analysis:
TradingView
If the price slips below $2.28, however, the recovery setup would weaken, and the XRP price could retest support at $2.08 or even $1.77, likely its broader cycle bottom.
Disclaimer: The content of this article solely reflects the author's opinion and does not represent the platform in any capacity. This article is not intended to serve as a reference for making investment decisions.
You may also like
Bitcoin Nears $100K Amid Major Sell-Off
Crypto Whale Profit Hits $39M on $500M Short Position
Crypto Market Faces Turmoil as Bitcoin Dives Below $104,000
In Brief Bitcoin and major altcoins saw significant drops, marking a "Bloody Friday." Key global events such as US-China relations heavily impacted the crypto market. Investors' confidence fell as the market lost approximately $500 billion last week.

3 Altcoins Built to Thrive Beyond Bitcoin’s Four-Year Cycle