Solana’s daily chart dated Oct 21, 2025 shows a bullish flag, which is a sharp rally followed by a tidy, downward-sloping consolidation that often precedes trend continuation. Price sits near $185.51 with the 50-day EMA at $205.31, and the consolidation tracks between clean, parallel rails. The context matters: a strong September advance built the flagpole, then sellers managed only a controlled pullback while ranges and volume tapered—both typical of flags rather than trend reversals.
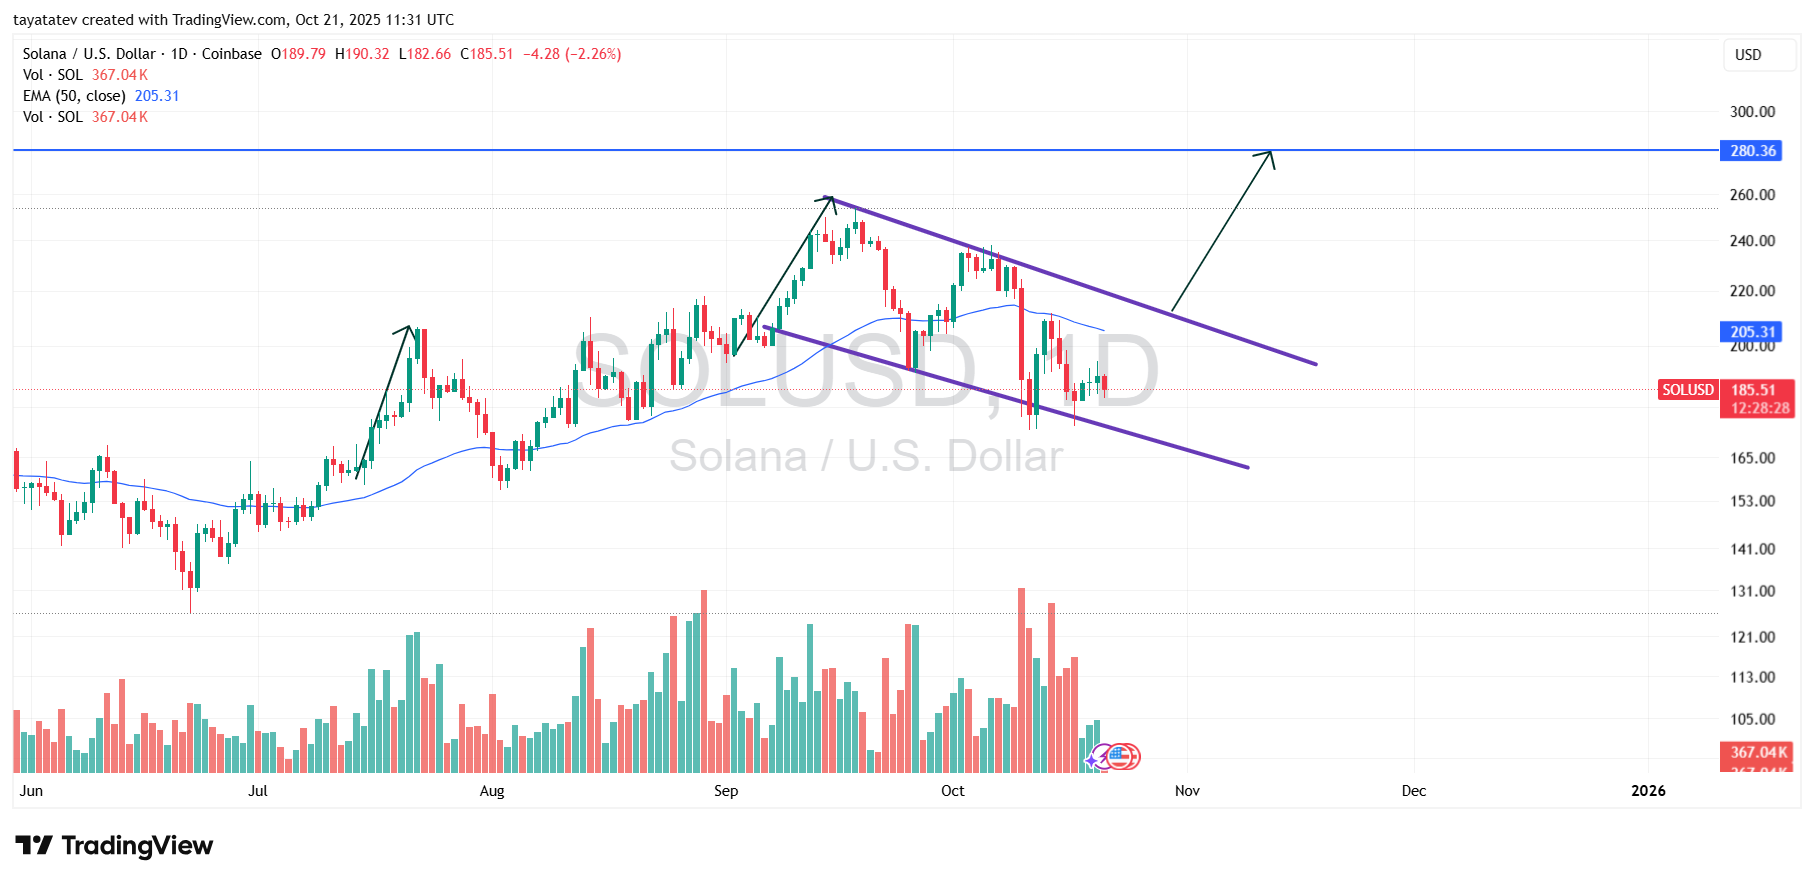 Solana USD Bullish Flag Daily. Source: TradingView
Structure comes first. Candles continue to respect the channel boundaries, with higher-timeframe demand showing on dips near the lower rail. The slope of the pullback remains modest, and gaps are scarce, which reinforces the idea of digestion instead of distribution. Meanwhile, the 50-day EMA now acts as a nearby pivot; reclaiming it would add momentum confirmation after any breakout.
Confirmation requires a daily close above the flag’s upper trendline and, ideally, expanding volume on the break. Once that happens, the measured move uses the flagpole logic or a simple percentage projection from the breakout area. From today’s $185.51, a 51% continuation implies ~$280.12, which aligns with the horizontal resistance highlighted around $280.36 on the chart. This confluence strengthens the target’s relevance because the pattern objective and an established supply zone coincide.
Until the break, the setup remains a watch-and-verify range. Buyers want to see a decisive push through the top rail, a firm close back above the 50-day EMA (~$205.31), and subsequent acceptance above former channel resistance turning into support. Those behaviors typically mark regime change from pullback to trend resumption and keep the 51% pathway in play toward the $280 area.
Risk sits below the structure. A daily close beneath the lower rail with rising sell volume would damage the flag and shift focus to prior swing supports inside the summer range. Likewise, repeated rejections at the upper rail coupled with lower highs would signal waning momentum and delay confirmation. As long as price holds the channel and liquidity doesn’t expand on down days, the pattern quality stays intact.
In short, the chart prints a valid bullish flag, the trigger is a close above the upper boundary, and the measured objective from current price is ~51% to ~$280. The nearby EMA and the $280 supply shelf provide clear checkpoints for confirmation and profit-taking if continuation unfolds.
Solana RSI shows weak momentum but early repair — Oct 21, 2025
The 14-day RSI prints 41.24, below its signal average at 42.76 and under the neutral 50 line. Therefore, bears still hold short-term momentum.
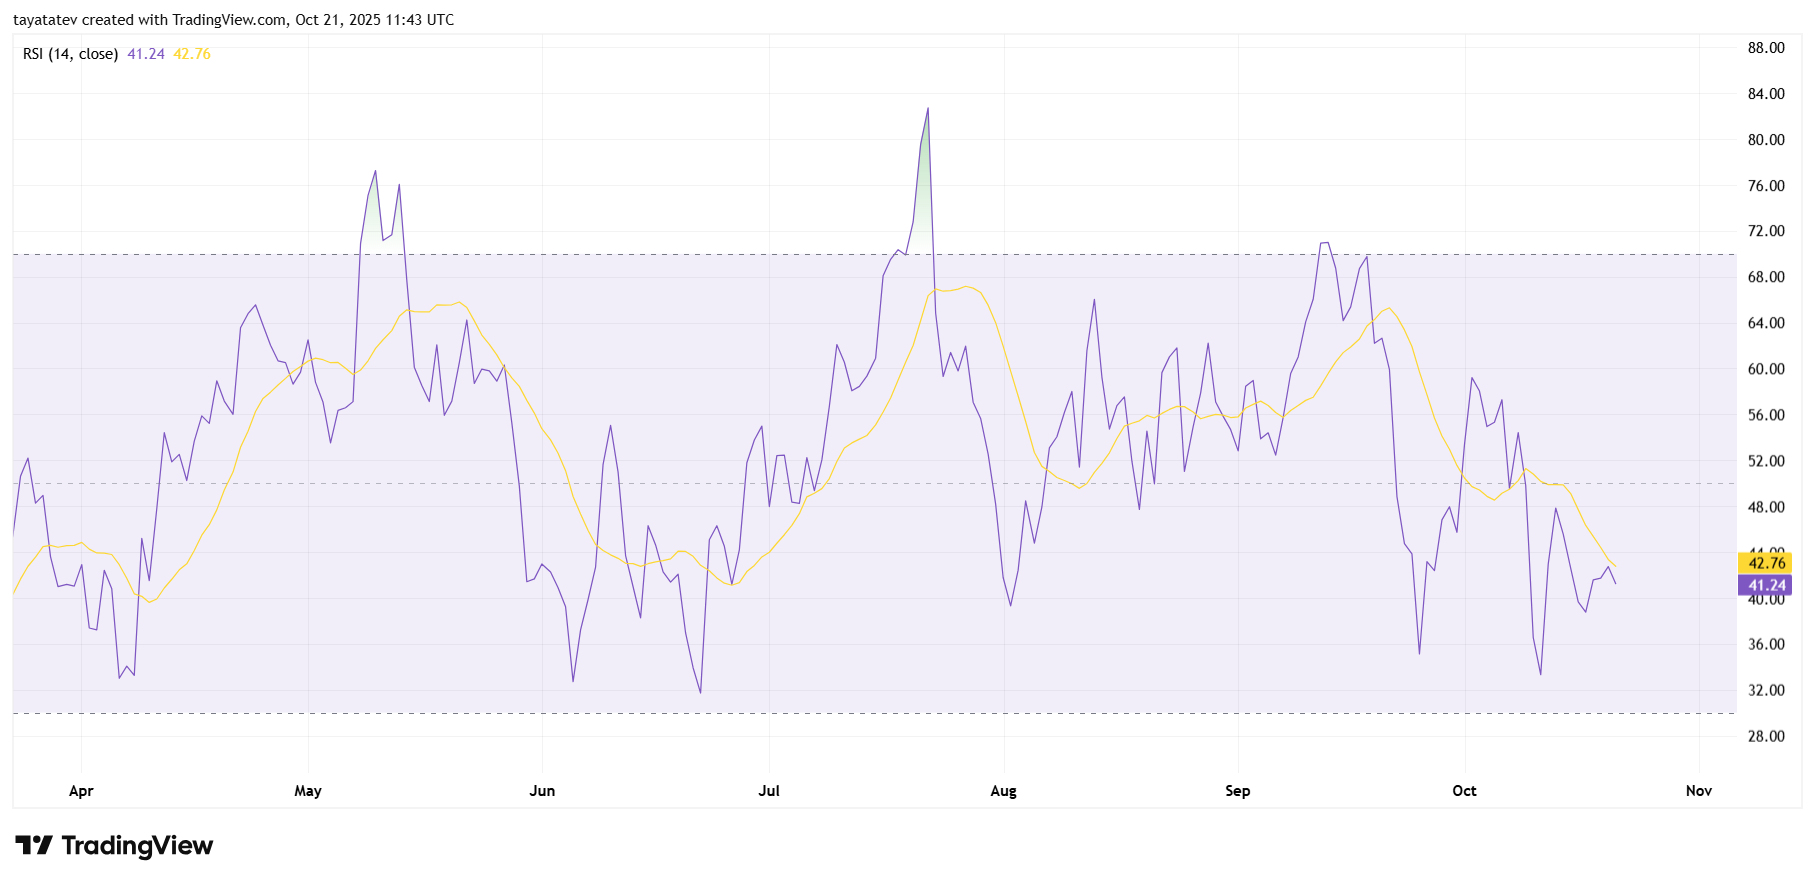 Solana RSI (14) Daily — Oct 21, 2025, 11:43 UTC. Source: TradingView
First, the oscillator rebounded from an early-October oversold dip near the 30 zone. That bounce trimmed downside pressure, yet it has not flipped trend. RSI continues to make lower highs since late September, which preserves a mild bearish bias.
Next, the signal line slopes down and sits above the RSI value. This placement confirms momentum lags price rallies inside the current channel. As a result, attempts to bounce can fade unless RSI reclaims its average.
However, the indicator now holds above 40, which often acts as support in early recoveries. If RSI closes back above 50 and its average, momentum turns constructive and would support a flag breakout attempt on price.
Conversely, a rollover below 40, then 35–30, would revive downside risk. That move would align with another leg inside the flag and delay confirmation. Until RSI crosses 50 with follow-through, momentum remains soft but stabilizing.

Editor at Kriptoworld
Tatevik Avetisyan is an editor at Kriptoworld who covers emerging crypto trends, blockchain innovation, and altcoin developments. She is passionate about breaking down complex stories for a global audience and making digital finance more accessible.
📅 Published: August 4, 2025 • 🔄 Last updated: August 4, 2025