Bitcoin Sellers Foil A Bullish Breakout — But Here’s Why the Rally Isn’t Over

Bitcoin price slipped 1% to $108,200 after sellers blocked a breakout near $114,000. But on-chain metrics and the falling wedge pattern suggest pressure is fading. With selling slowing and RSI flashing bullish divergence, a breakout toward $116,000 could just be a matter of time.
The Bitcoin price has slipped by over 1% in the past 24 hours. It is now trading near $108,200 after sellers pushed BTC down from the day’s high and a chance at a breakout.
However, while short-term pressure remains, both on-chain and chart data show this pause could be temporary. A broader BTC price rebound might already be forming underneath.
Selling Pressure Slows, But One Metric Hints At Reaccumulation
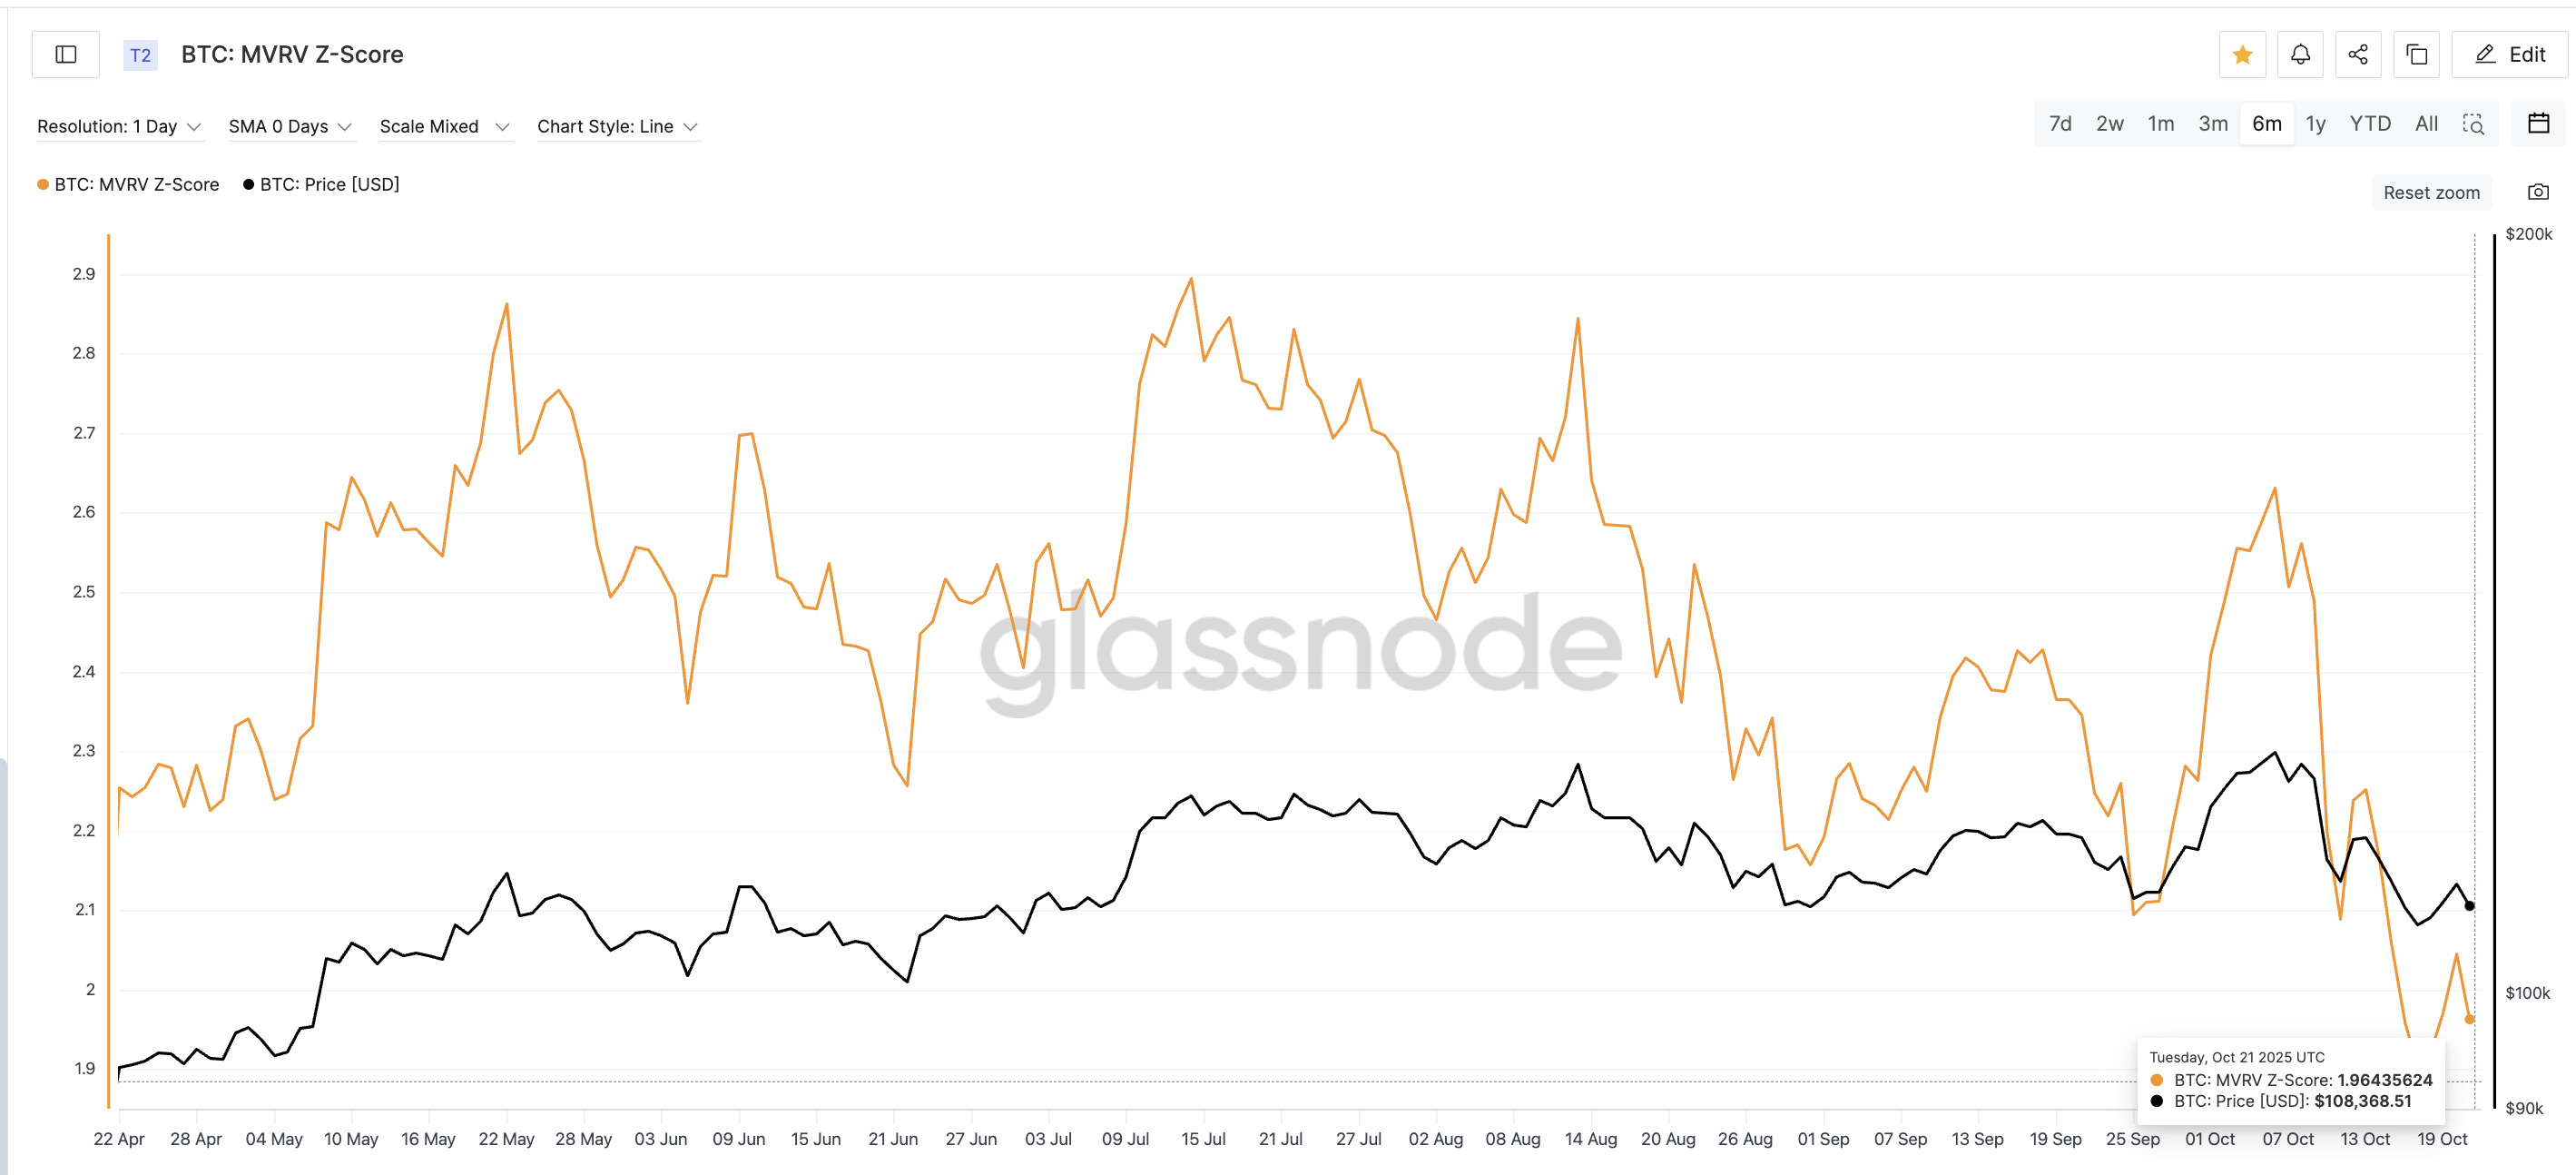
The MVRV Z-Score, which compares Bitcoin’s market value to its fair value, is still near its six-month low of 1.96. It is slightly up from 1.90 (the 3-month low) on October 17. That small “higher low” is critical.
The last time a similar pattern appeared, between September 25 and 27, the MVRV rose from 2.09 to 2.11. And the Bitcoin price rallied nearly 14%, jumping from $109,692 to $124,714 within a week.
 Bitcoin MVRV-Z Score:
This pattern suggests that while selling pressure is cooling, long-term holders aren’t capitulating, but they’re holding through the dip.
Want more token insights like this? Sign up for Editor Harsh Notariya’s Daily Crypto Newsletter here.
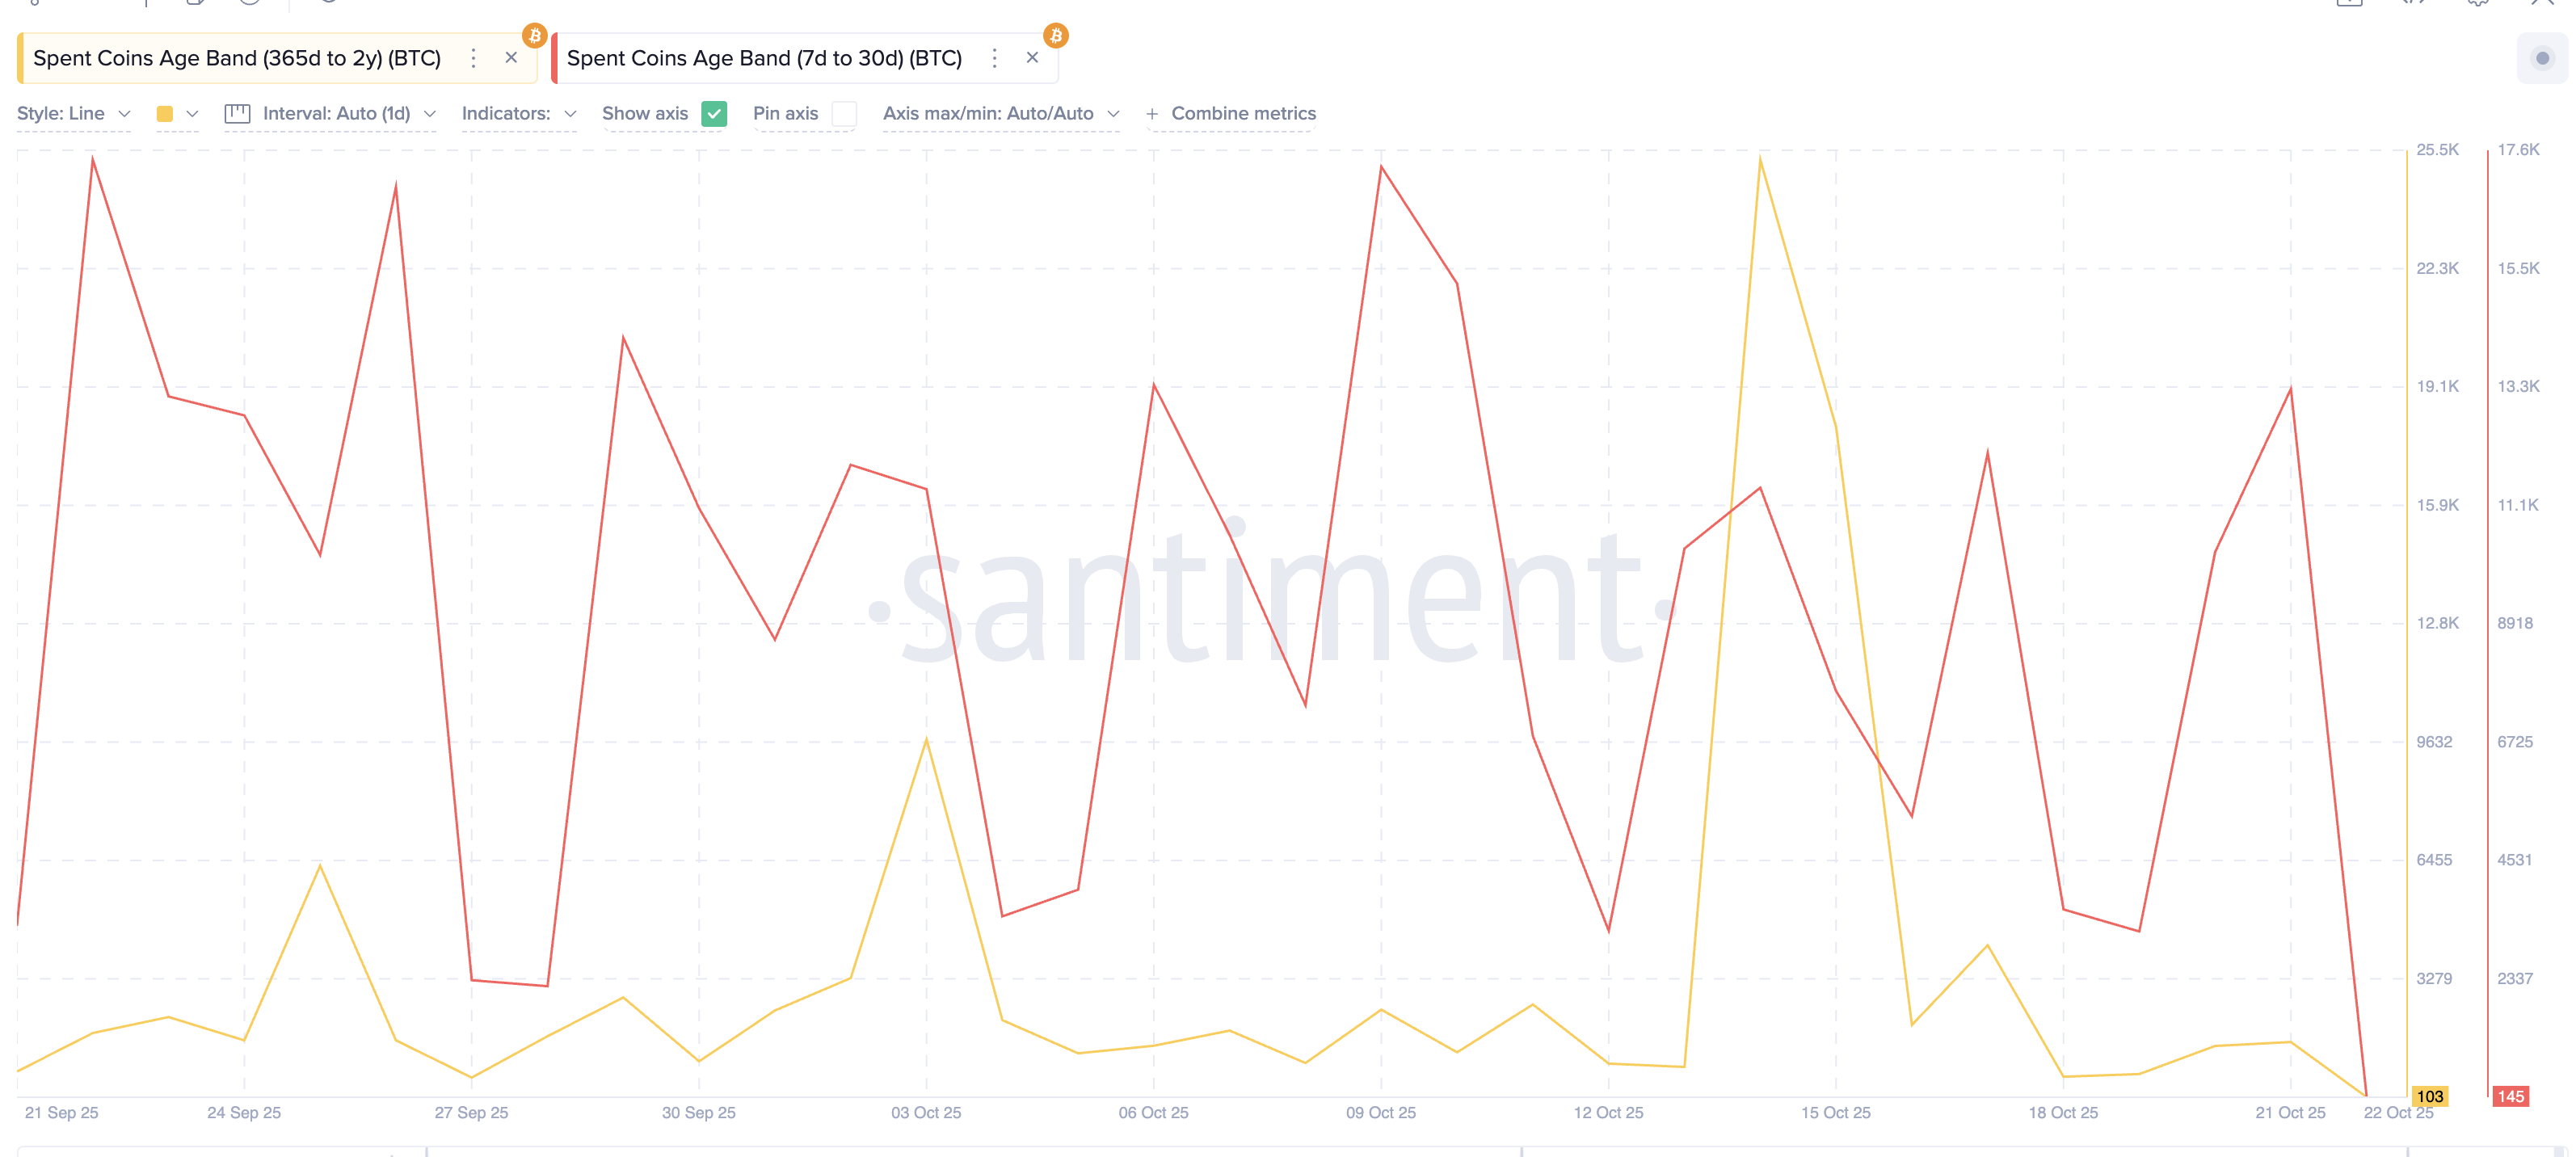
The Spent Coins Age Band metric reinforces the MVRV-led outlook. It tracks the amount of supply that time-frame-specific holders are moving.
Coins held for 365 days to 2 years dropped from 25,263 to 103 spent BTC units, a 99.6% decline between October 14 and 22. Short-term coins (7–30 days) dropped from 13,273 to 145, a 98.9% fall since yesterday.
Both sharp drops (monthly lows) show fewer coins are being sold, meaning both long- and short-term sellers are running out of momentum.
 Both Short-Term And Long-Term Holders Have Eased Selling:
Together, the two metrics hint that large holders are steadying, short-term profit-takers are nearly done, and selling exhaustion might set the stage for a rebound.
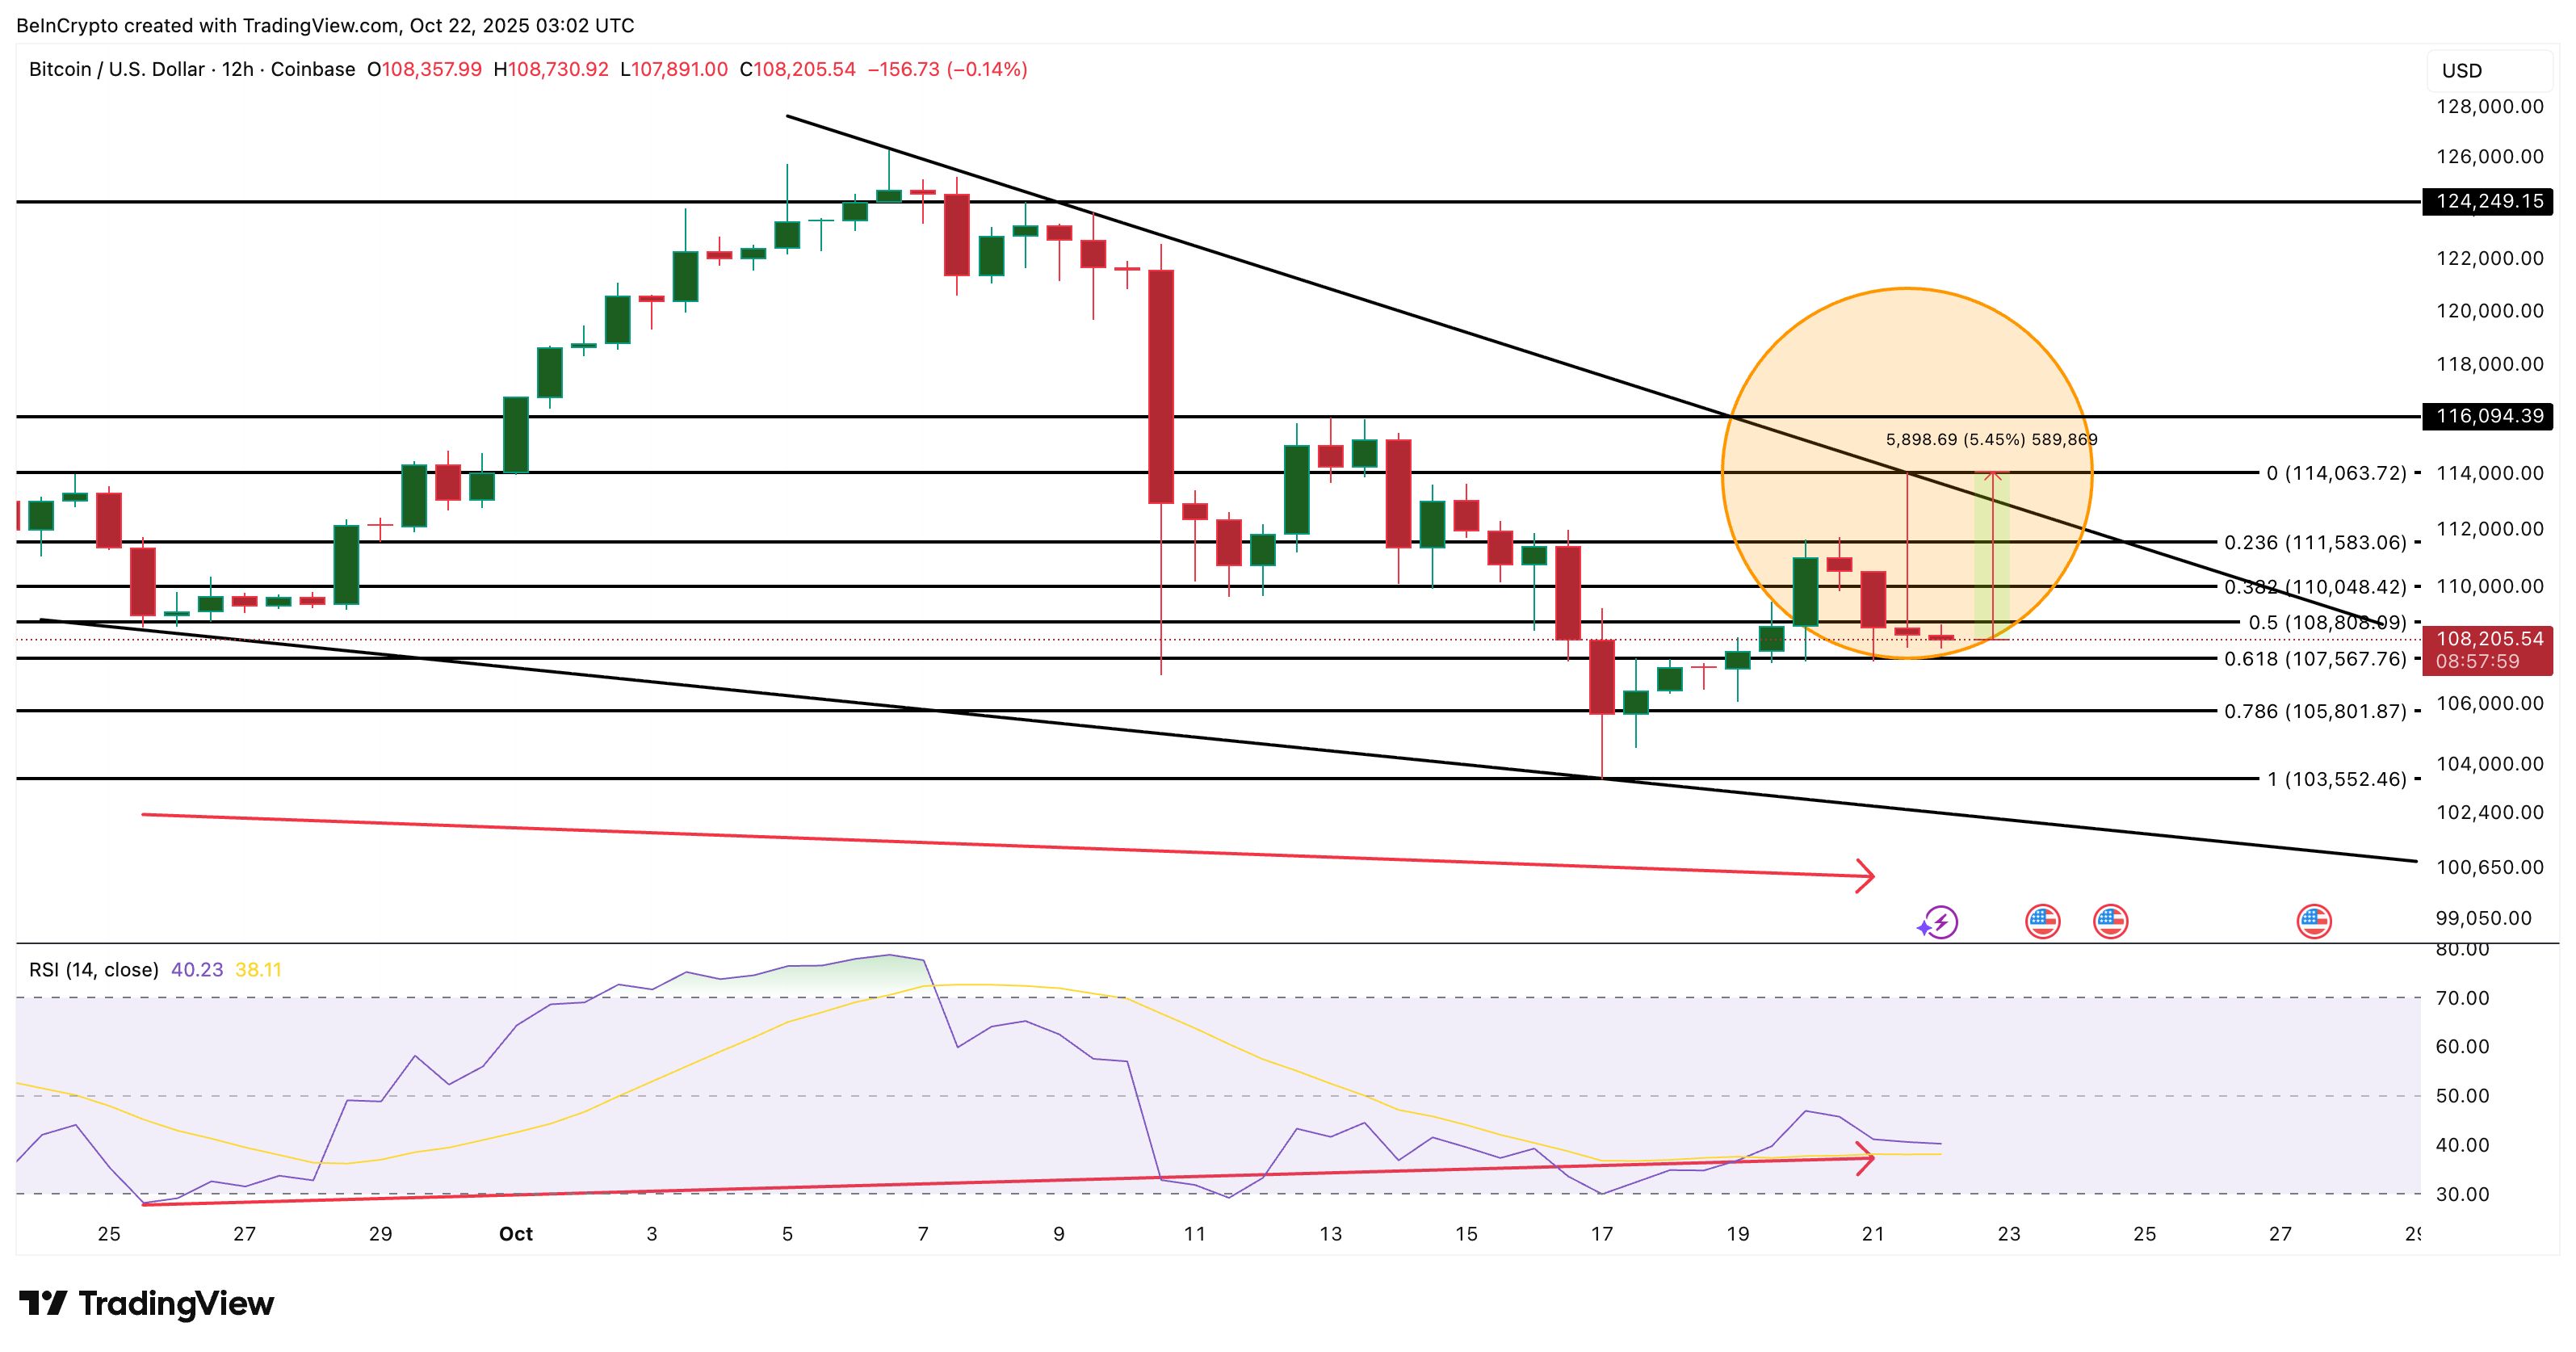
Bitcoin Price Chart Still Holds A Reversal Setup Despite Bearish Rejection
On the 12-hour chart, Bitcoin continues to move inside a falling wedge, which usually breaks upward. BTC’s price briefly tested the upper boundary near $114,000.
But a long upper wick showed sellers stepping in, dragging the price back near $108,000. Even so, a doji candle formed right after, signaling indecision between buyers and sellers, often the last phase before a reversal.
The Relative Strength Index (RSI), which tracks the strength and speed of price moves, supports this. Between September 25 and October 21, BTC’s price made lower lows while the RSI made higher lows, forming a bullish divergence. This setup often signals fading selling pressure before a trend reversal.
If Bitcoin breaks above $111,500 (upper boundary of wedge), it could confirm a short-term breakout toward $114,000. A strong close above that level would open the door for a rally to $116,000, with a further push toward $124,200 possible if momentum strengthens.
 Bitcoin Price Analysis:
A drop below $107,500 would delay this move, while a slide under $103,500 would invalidate the bullishness altogether.
Disclaimer: The content of this article solely reflects the author's opinion and does not represent the platform in any capacity. This article is not intended to serve as a reference for making investment decisions.
You may also like
Conflicted Fed cuts rates but Bitcoin’s ‘fragile range’ pins BTC under $100K

Fed rate cut may pump stocks but Bitcoin options call sub-$100K in January

"Validator's Pendle" Pye raises $5 million, enabling SOL staking yields to be tokenized
There are truly no creative bottlenecks in the financialization of Web3.

DiDi has become a digital banking giant in Latin America
DiDi has successfully transformed into a digital banking giant in Latin America by addressing the lack of local financial infrastructure, building an independent payment and credit system, and achieving a leap from a ride-hailing platform to a financial powerhouse. Summary generated by Mars AI. This summary was produced by the Mars AI model, and its accuracy and completeness are still being iteratively improved.