The LTC/USD weekly chart dated Oct 22, 2025, shows price near $93.31 with the 50-week EMA ~ $99.17 overhead.
The structure since mid-2022 forms a bearish flag: a sharp down move (flagpole) followed by a rising, parallel channel that retraces part of that drop.
Stay ahead in the crypto world – follow us on X for the latest updates, insights, and trends!🚀
A bearish flag, in one sentence, is a brief upward or sideways channel that follows a steep decline and often precedes continuation lower. The lower rail of this channel now sits just below $90 on this chart.
Volume trends support the read. The heavy sell impulse in 2021–2022 built the flagpole. Afterwards, rallies inside the channel printed lighter volume, while sell weeks spiked.
Meanwhile, price failed to reclaim the 50-week EMA, which turned into resistance.
Each touch of the upper rail faded quickly, keeping swing highs capped around the mid-$150s to high-$170s.
Now, the breakdown trigger is clear. A weekly close below the lower channel—roughly the $88–$90 area here—would confirm the flag failure.
After confirmation, technicians project targets using the measured move: they extend the pole’s height from the break point.
On this chart, that math aligns with the blue horizontal reference near $12.57. From today’s $93.31, an 86% measured decline implies a target around $13.06, which is consistent with the $12.57 level highlighted.
Context adds weight to the scenario. The prior vertical sell leg set a strong momentum baseline.
The subsequent channel climbed slowly and overlapped, typical of a corrective move rather than a trend start.
In addition, the recent long red weekly candle pierced the channel and tested the EMA from below, showing supply near $99–$100. If price retests and fails at the underside of the channel or the EMA, the pattern holds its bearish bias.
Risk markers are straightforward. A decisive reclaim of the 50-week EMA and a close back inside the channel would weaken the setup.
However, until that occurs, the textbook path after confirmation points lower. Therefore, if the flag confirms, the chart supports a potential slide of ~86% from the current print toward $13–$12.6, matching the historical base shown by the horizontal line.
Litecoin Weekly RSI Slips Below Midline — Oct 22, 2025
The LTC/USD weekly RSI (14) print is 44.27, with its signal line near 55.29. The oscillator sits below 50, which marks a bearish momentum tilt on higher time frames.
The reading follows a quick fade from the mid-50s and mirrors the recent price rejection on the weekly chart.
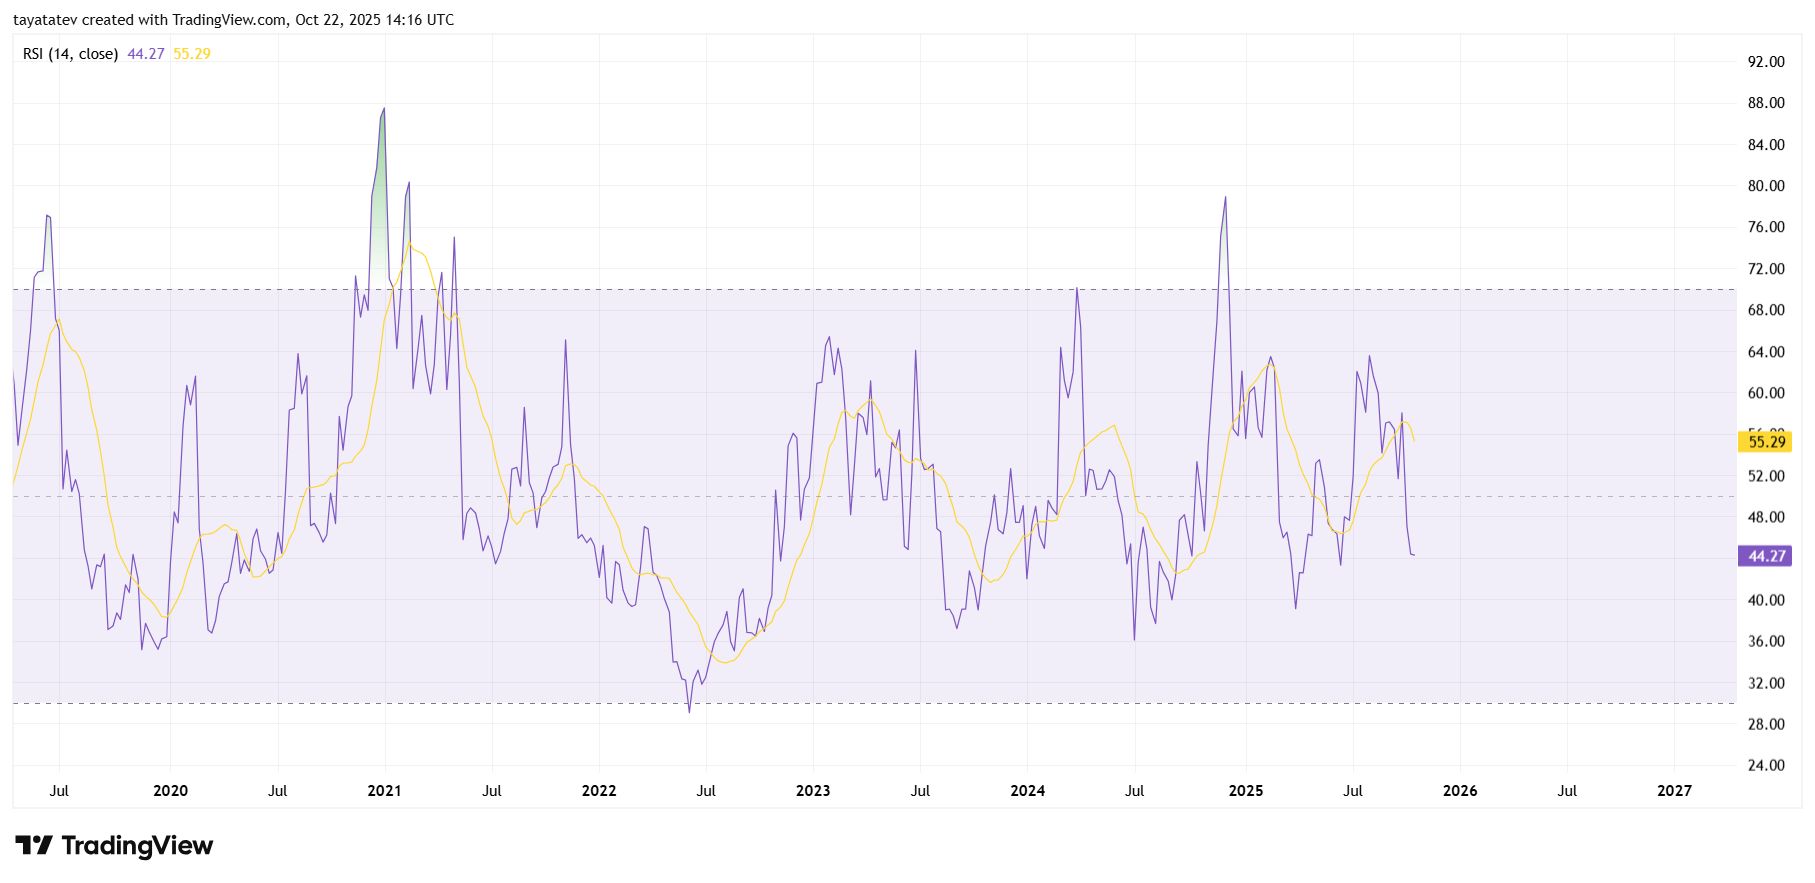 Litecoin Weekly RSI 14 Close. Source: TradingView
A bearish flag on price needs momentum confirmation. The RSI provides it when it trends under 50 and fails at the signal.
Here, the RSI rolled over, crossed beneath its moving average, and stayed weak. In one sentence, a bearish flag is a rising, parallel channel after a sharp drop that often resumes lower when momentum turns down.
The RSI now supports that view by losing the midline and pointing toward the lower band.
History on this series shows clear zones. 70–72 marked prior weekly peaks; 30–32 marked stress points in 2022 and again during later pullbacks.
Each slide from the 60s toward the 30s aligned with deeper price drawdowns. Therefore, if the RSI continues to drift toward 30, it would fit the measured-move path discussed on the price chart and keep the $13–$12.6 risk band in focus after pattern confirmation.
Signal behavior adds detail. The RSI’s bounce attempts stalled beneath the 55–60 region several times since 2024, showing sellers in control of momentum rallies.
The latest failure printed while price met resistance near the 50-week EMA ~ $99. That pairing—RSI < 50 and EMA resistance overhead—keeps the bias cautious until the oscillator reclaims and holds above 50–55.
Key trigger remains the same. If price closes the week below the flag’s lower rail and the RSI presses into the low-40s/high-30s, momentum confirmation strengthens.
If, instead, RSI reclaims 50 and the signal line, the pattern weakens. Until that shift, weekly momentum aligns with the bearish flag narrative and leaves room for an expansion lower should confirmation arrive.

Editor at Kriptoworld
Tatevik Avetisyan is an editor at Kriptoworld who covers emerging crypto trends, blockchain innovation, and altcoin developments. She is passionate about breaking down complex stories for a global audience and making digital finance more accessible.
📅 Published: October 22, 2025 • 🕓 Last updated: October 22, 2025