Bitcoin Breaks Out — But Whale Slowdown Signals a Pullback Ahead of Next All-Time High

Bitcoin price is climbing again, backed by steady momentum and bullish technicals. However, falling whale participation and slower outflows suggest a pullback could come before another rally attempt toward $134,100.
The Bitcoin price is on the move again, climbing 3.2% in the past 24 hours and leading a wider 3.7% gain across the crypto market. Over the past month, it’s been up about 5%, showing that momentum is gradually improving.
But the rise isn’t without signs of hesitation. Beneath the surface, two underrated yet critical metrics are shifting in ways that could slow the next leg higher, even as the bigger picture still looks bullish.
Whales Pull Back as Exchange Outflows Ease
One key factor to watch is whale behavior. Whales are large holders — typically wallets with 1,000 BTC or more — and their activity often signals market direction.
Data shows the number of whale entities has dropped to a three-month low of 1,350, down steadily since October 14. The first dip from the October 14 local high was around the time the Bitcoin price corrected from $115,000 to $106,400; a 7.40% dip.
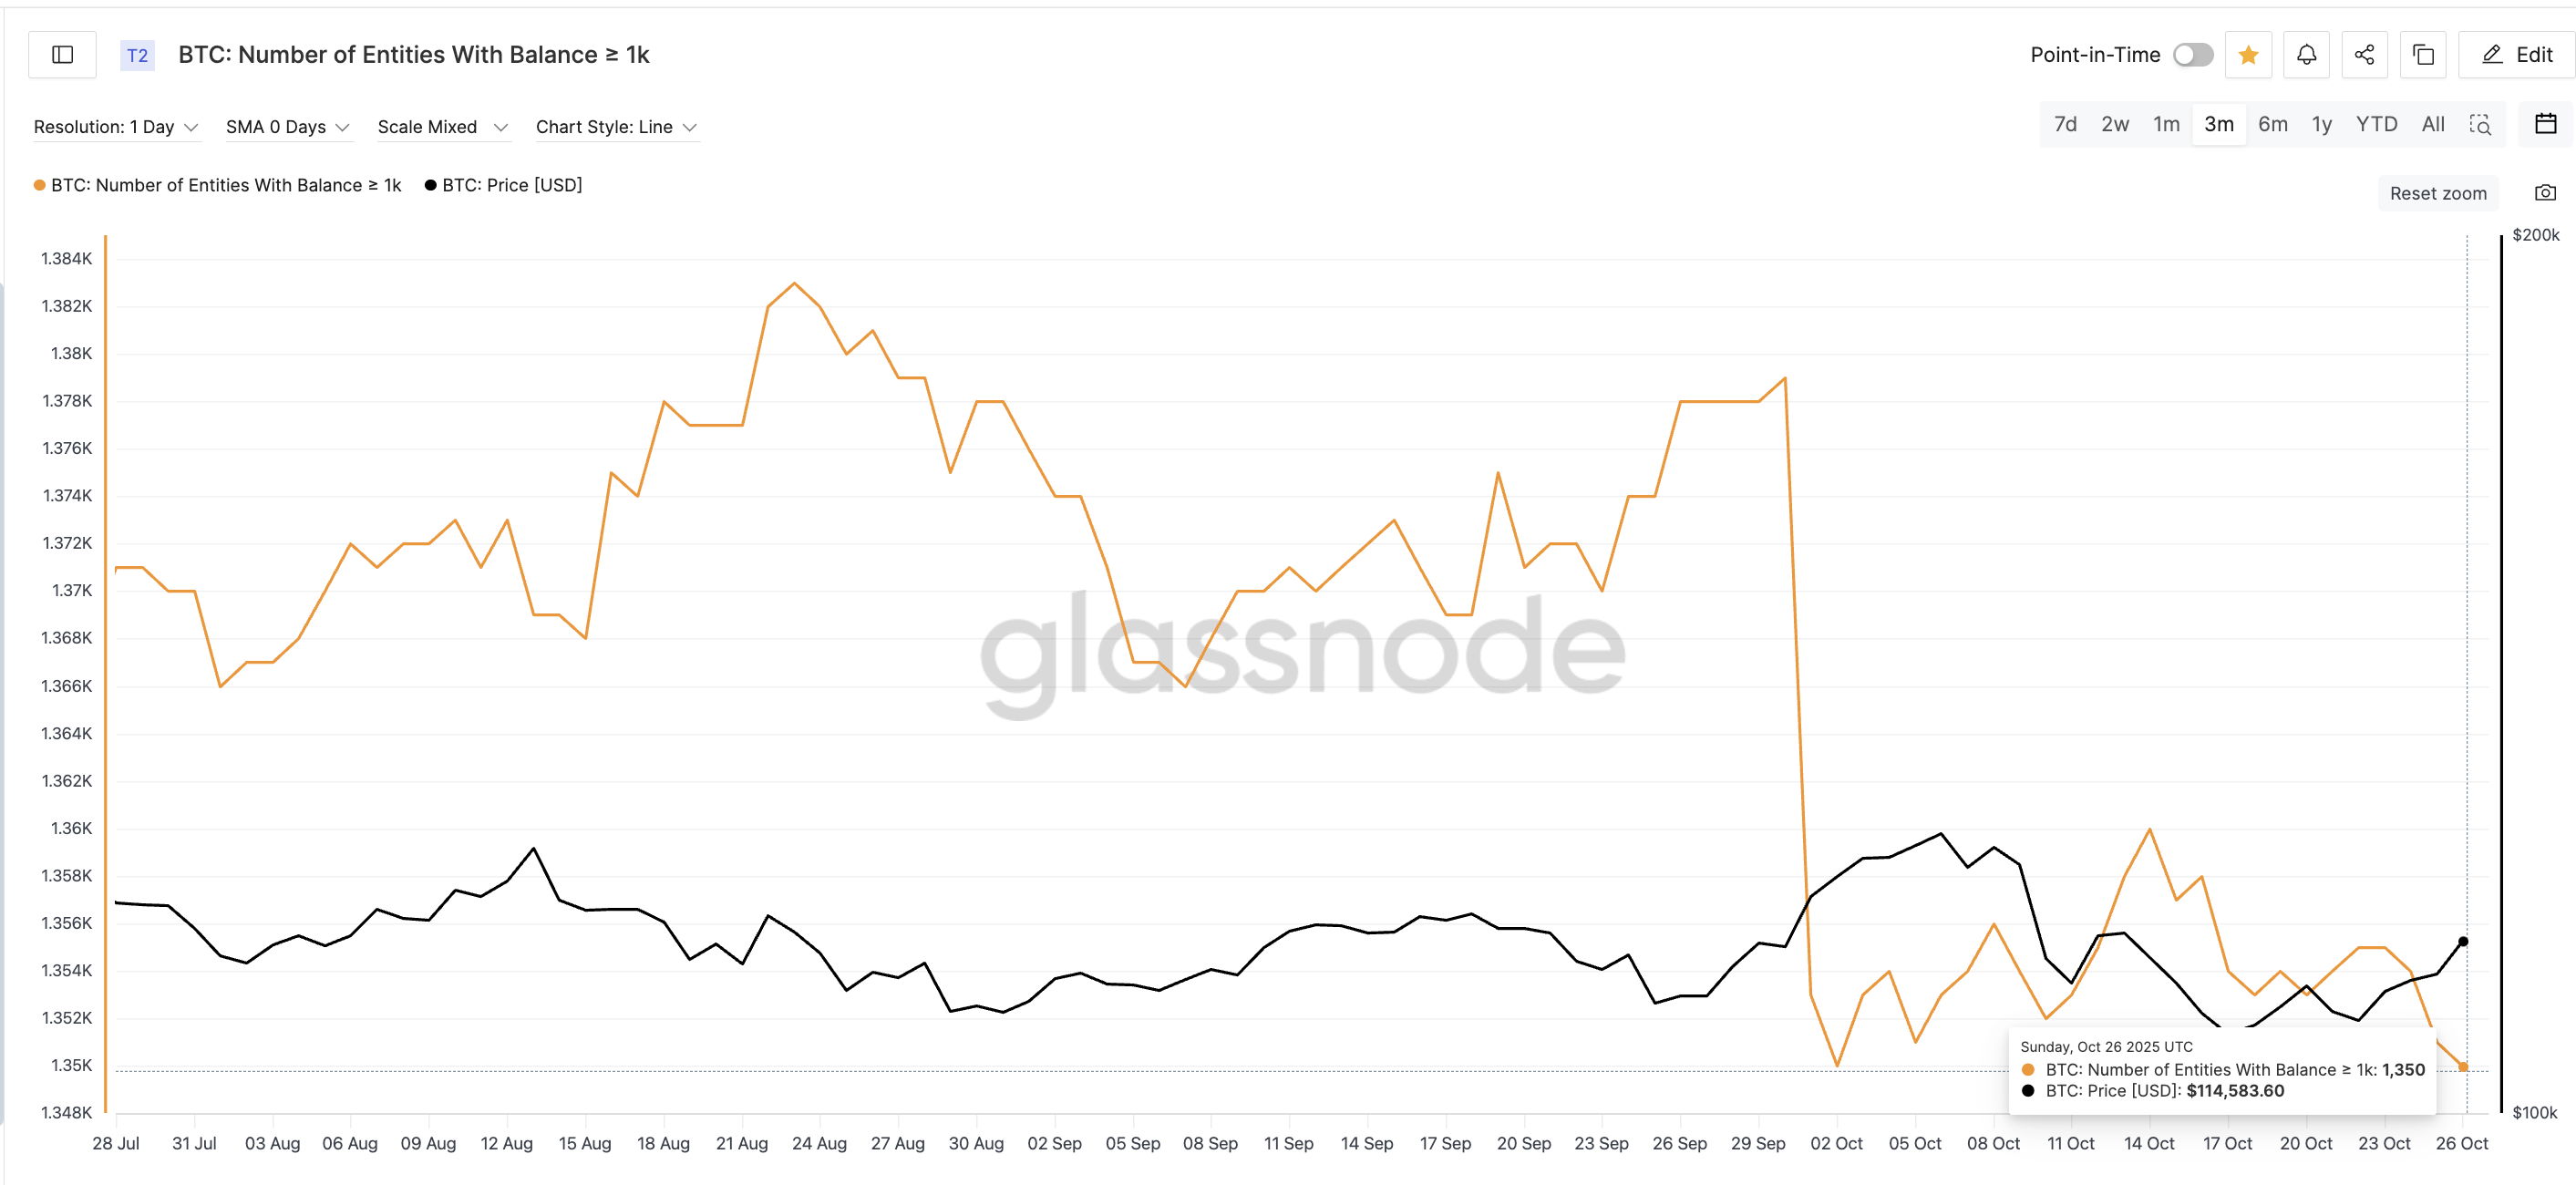 Bitcoin Whales Slowing Down:
Glassnode
Bitcoin Whales Slowing Down:
Glassnode
Want more token insights like this? Sign up for Editor Harsh Notariya’s Daily Crypto Newsletter here.
This shows that some large holders have been taking profits. As a result, much of the current buying appears driven by smaller, retail participants rather than institutional-scale players.
A related metric, exchange net position change, complements this view. It measures how much Bitcoin moves in or out of exchanges each day. Negative values mean outflows (buying), and positive ones mean inflows (selling).
On October 15, outflows reached 111,720 BTC, signaling strong buying pressure. By October 26, they had dropped to 54,643 BTC, a decline of about 51%.
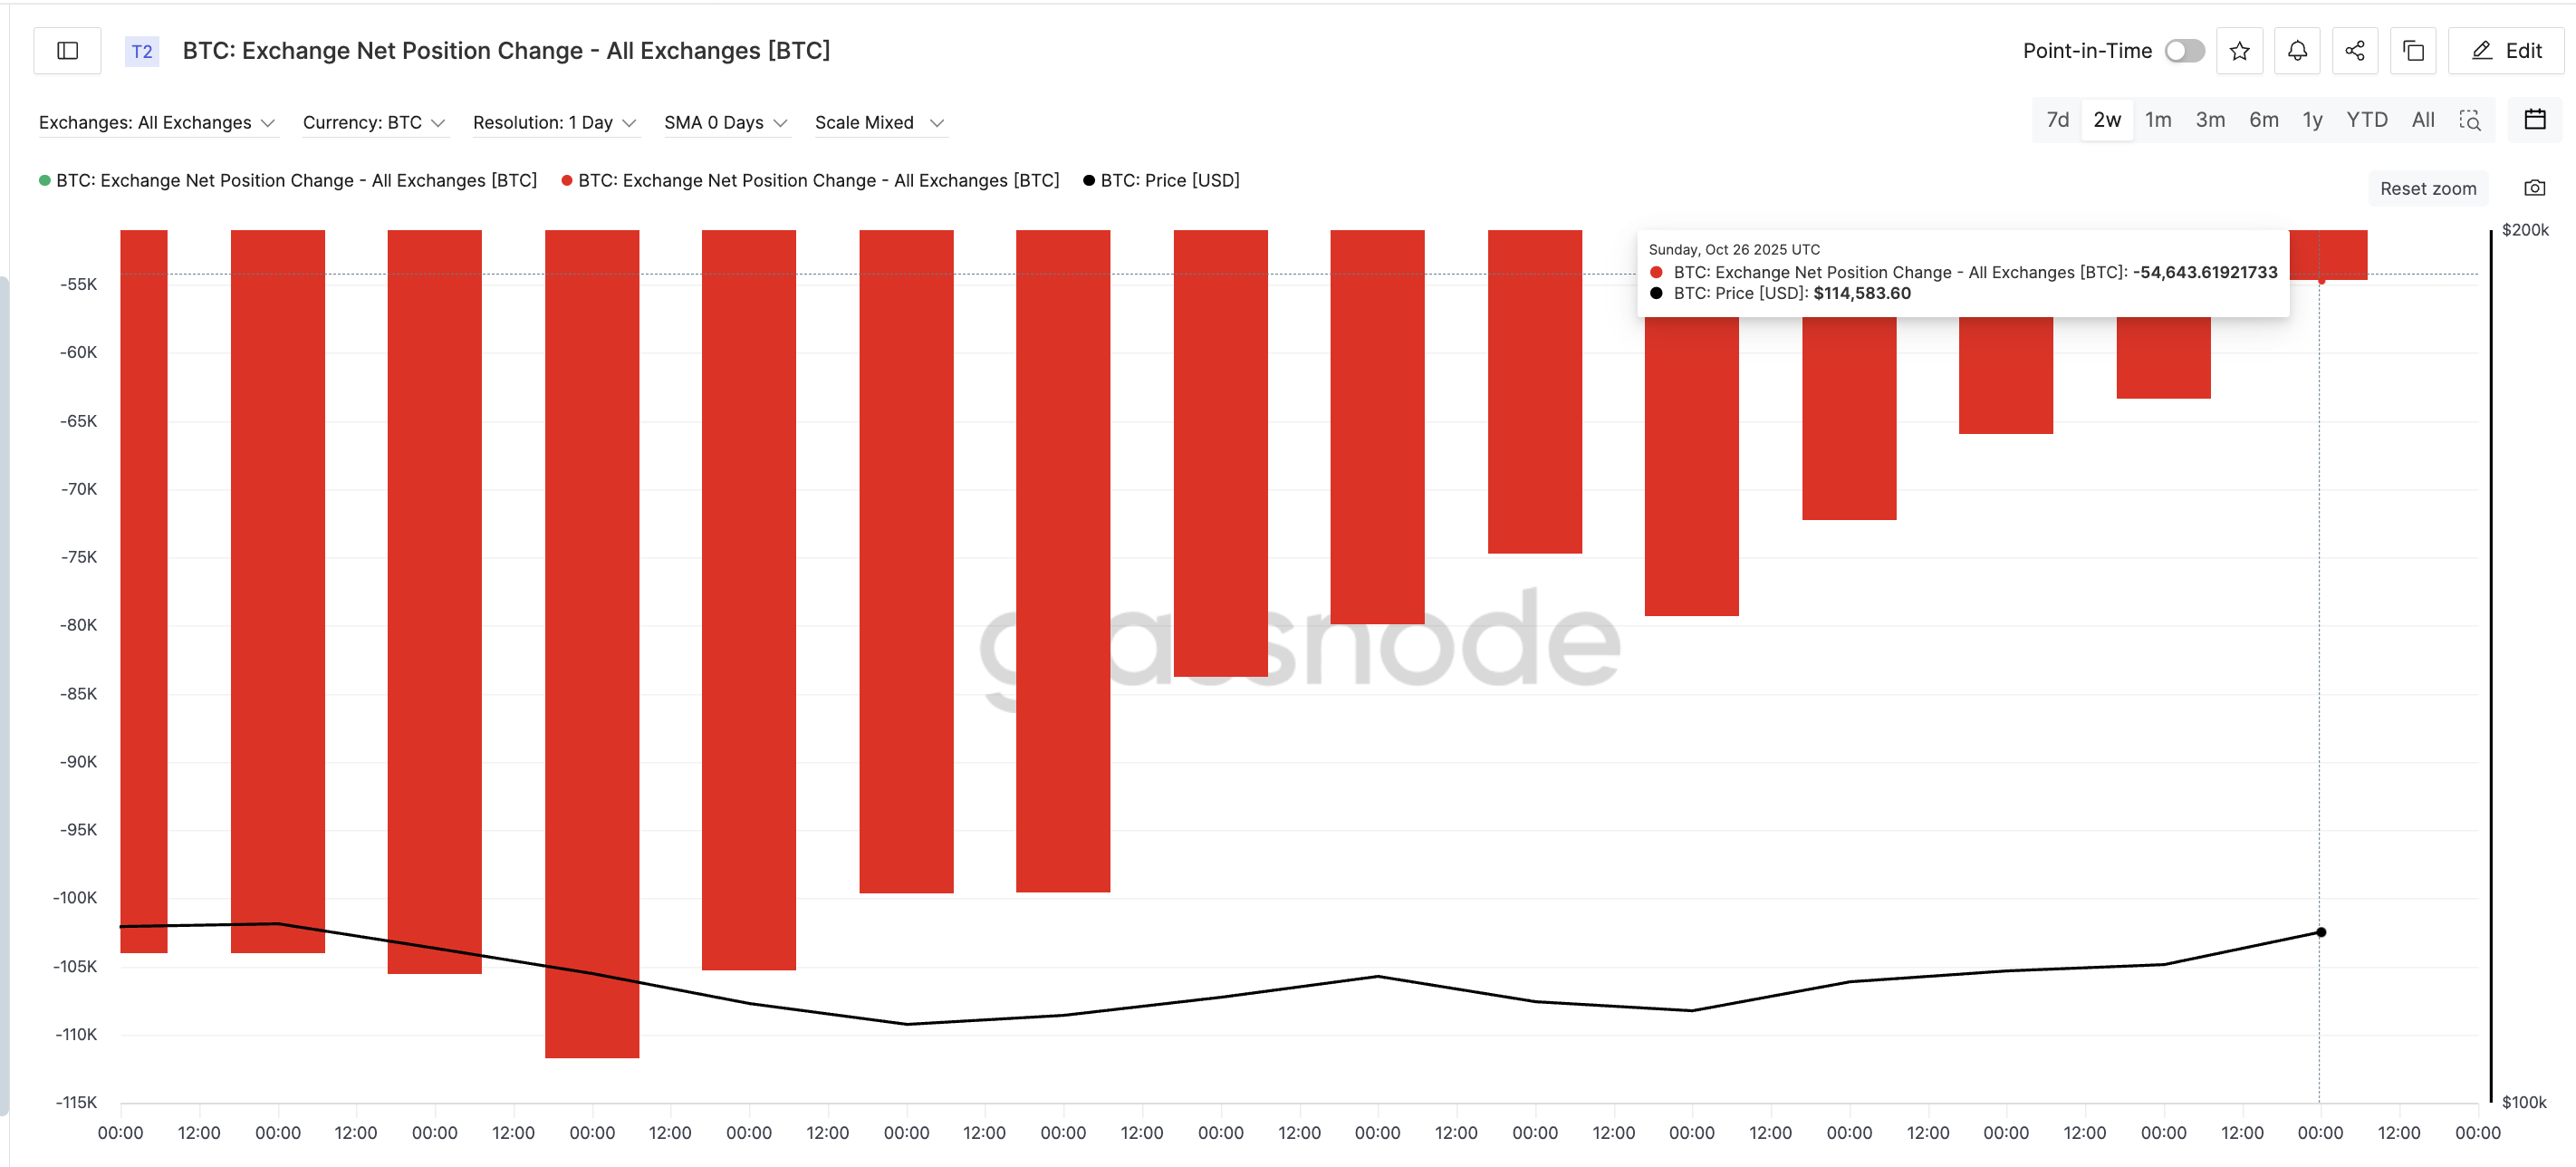 Bitcoin Exchange Outflows Slowing Down:
Glassnode
Bitcoin Exchange Outflows Slowing Down:
Glassnode
Outflows still suggest accumulation, but the slowdown hints that the intensity of buying is fading, and short-term selling could return before the next leg higher.
Bullish Divergence Holds, but Bitcoin Price Tests Resistance
At the same time, the Relative Strength Index (RSI), a tool that measures buying versus selling strength, continues to support the broader bullish view. The indicator has been forming higher lows since mid-October, even as the price briefly dipped, creating what’s called a bullish divergence.
This usually means sellers are losing control and buyers are gradually returning.
The RSI trend ties neatly into the current chart pattern. Bitcoin has now confirmed its falling wedge breakout, with prices holding above $111,000 and moving close to $114,900.
A full daily candle close above $117,600 (critical resistance) could unlock the next resistance levels at $121,400 and $126,300, with a potential target near $134,100, a new all-time high zone. That would be a 20% upmove from the breakout level of $111,000.
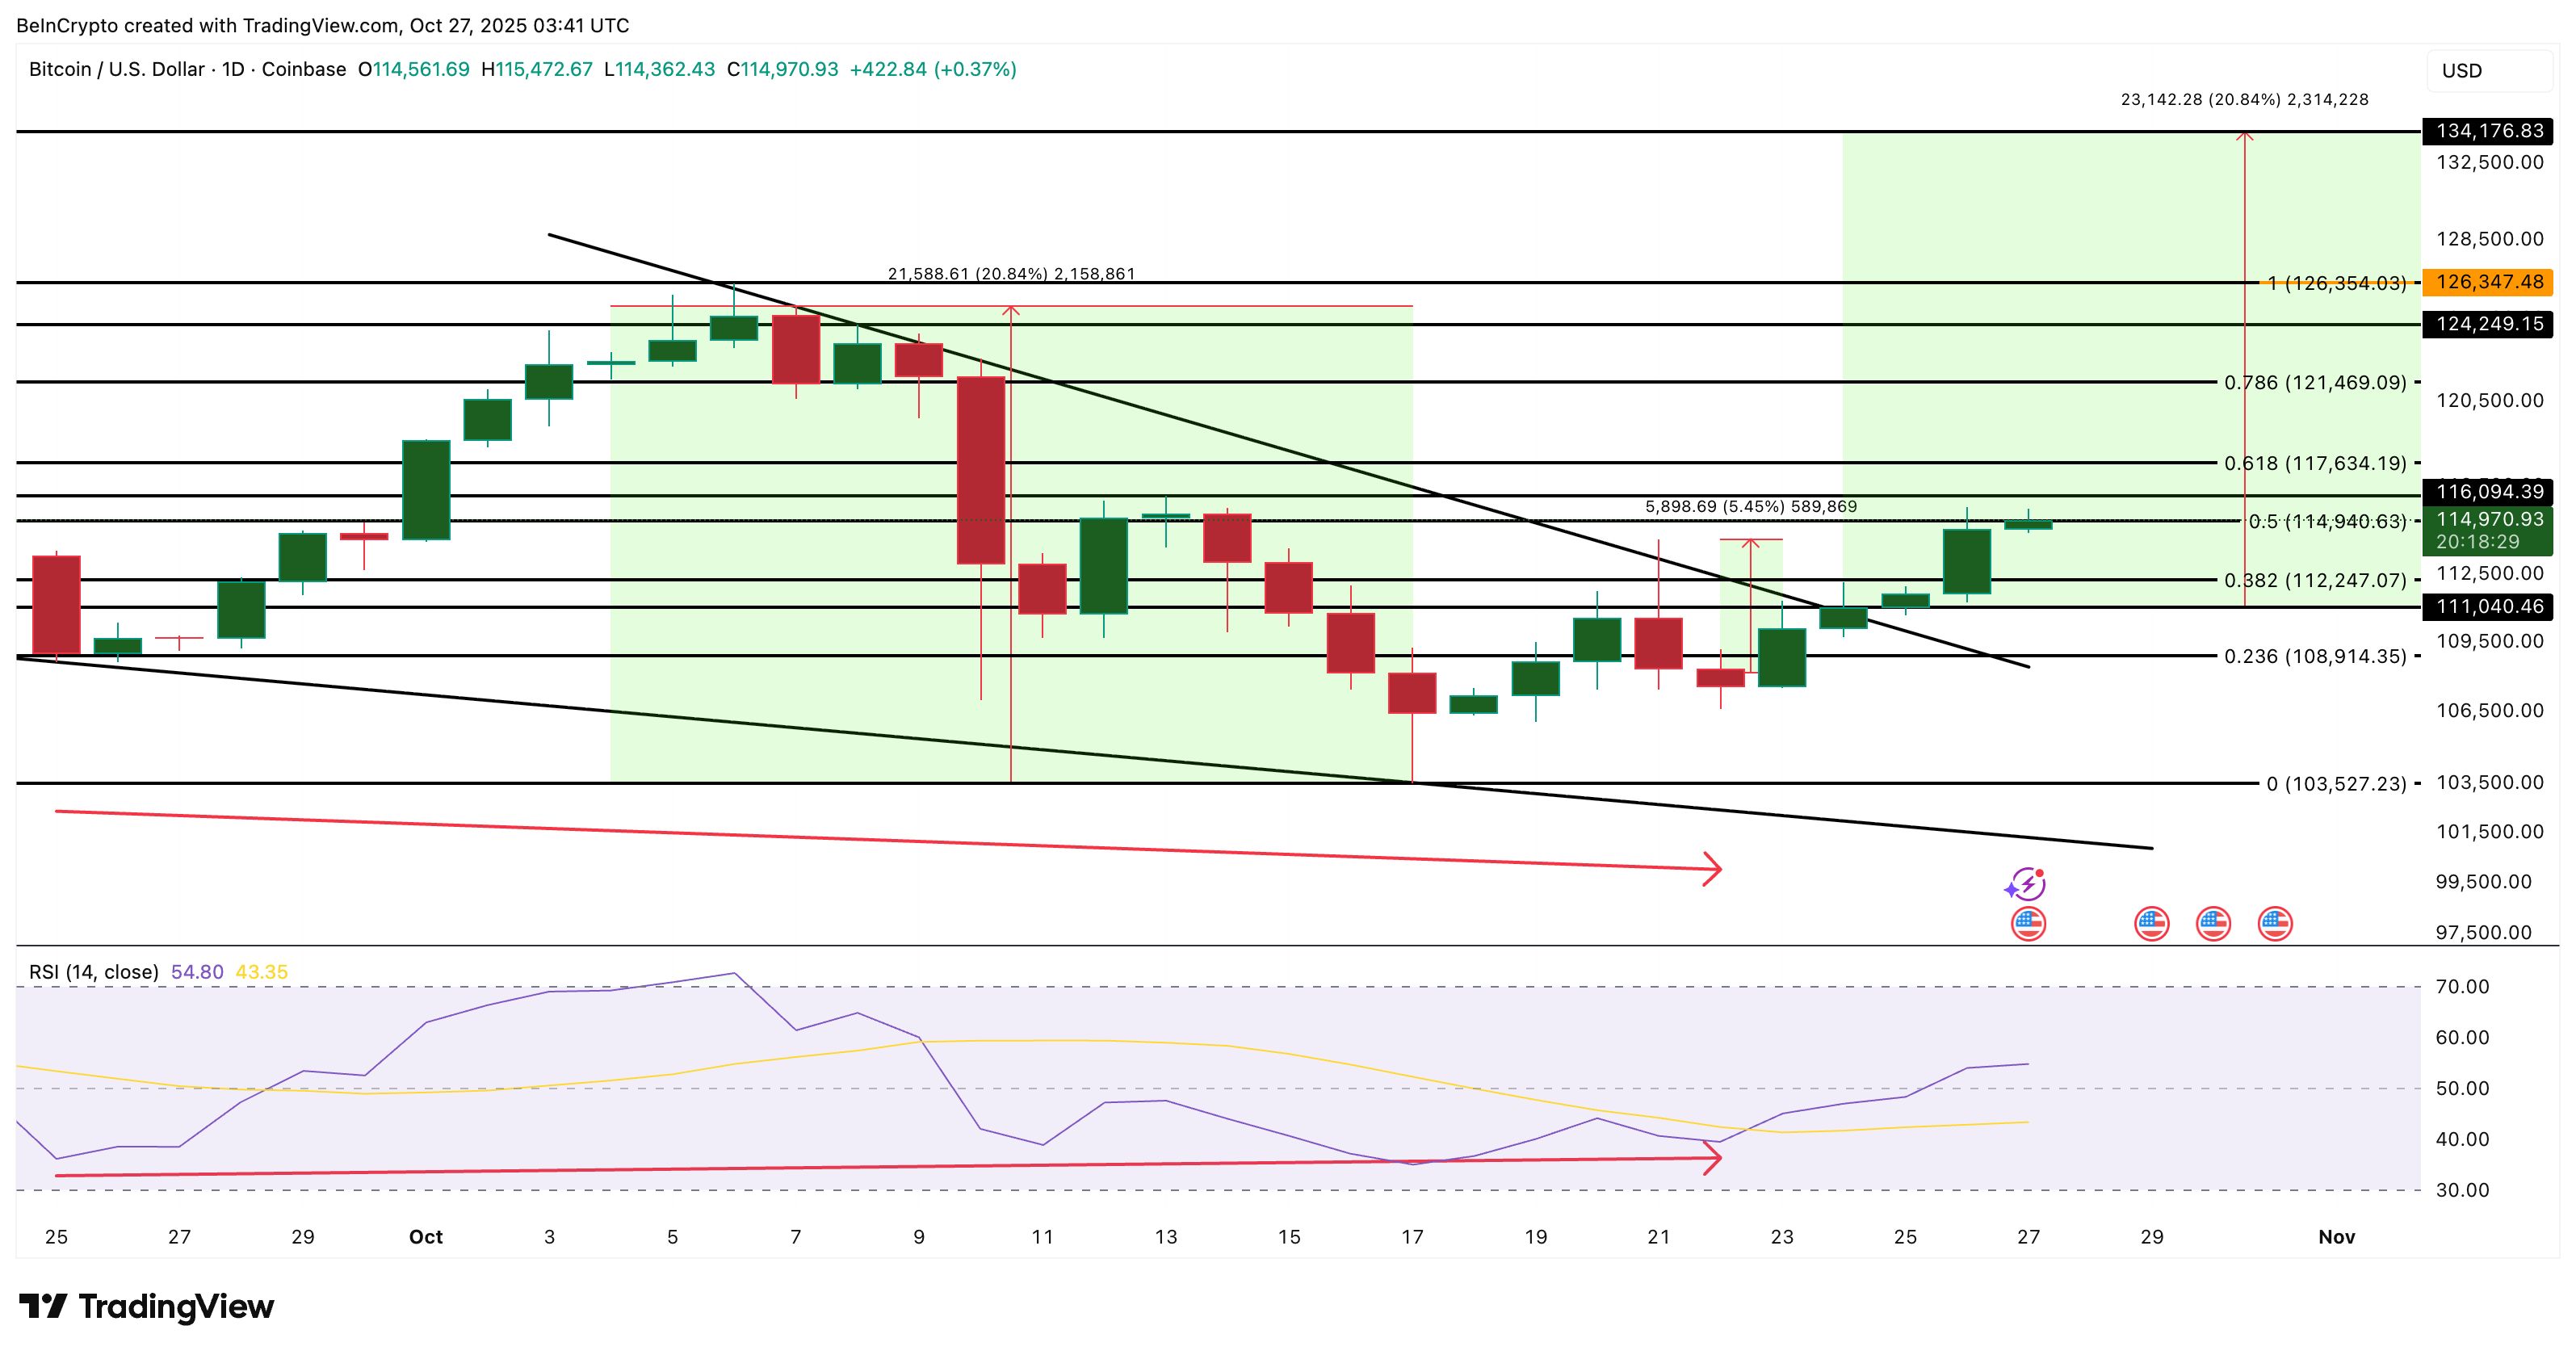 Bitcoin Price Analysis:
TradingView
Bitcoin Price Analysis:
TradingView
However, if Bitcoin fails to hold above $112,200, a deeper pullback could follow. A drop below $108,900 (a 6% drop from the current level) would expose $103,500. This is a level that previously served as strong support.
Disclaimer: The content of this article solely reflects the author's opinion and does not represent the platform in any capacity. This article is not intended to serve as a reference for making investment decisions.
You may also like
BTC price eyes record monthly close: 5 things to know in Bitcoin this week
ZEC surges 6 times in a month, what is driving this frenzy?
The halving event, privacy narrative, and endorsements from well-known institutions and investors have jointly driven ZEC to surpass its 2021 peak.
Can x402 break the crypto concept of "hype equals peak"?
Unlike typical crypto concepts, x402 has attracted the attention of many Web2 tech giants, and these companies have already begun to adopt the protocol in practice.

When the Tide Goes Out: Who Is "Swimming Naked"? A Discussion on the Acquisition Fates of Clanker and Padre
Where does value accumulate? If value accumulates in equity entities, why buy tokens? Are all tokens just meme coins?