Solana inflows hit 6-month low as price fails to break $200

Solana spot inflows have hit a six-month low of $180 million following its recent decline to $185, despite having seen two SOL ETFs debut on the U.S market this week.
- Solana’s spot inflows have dropped to a six-month low as investor interest in newly launched SOL ETFs fades, leading to weakened liquidity and rising exchange outflows.
- After failing to hold above the $200 mark, Solana’s price has slipped to around $186, with technical indicators and moving averages signaling a short-term bearish trend and potential retest of lower support levels.
According to data from Coinglass, Solana inflows have plunged to a six-month low, tethering on the edge of $180.7 million. The number is a far cry compared to inflows from a day prior, which saw the asset hitting $885.02 million in inflows. Low inflows typically signal waning demand in the market as the hype surrounding new Solana ETFs have faded.
At the same time, exchange data shows an increase in net outflows after weeks of relative calm. This means that more tokens are moving into exchanges rather than being pulled out into cold storage or being held by users on-chain. On Oct. 31, major exchanges like Binance, OKX, Coinbase and Bybit are seeing more outflows for SOL ( SOL ).
Binance alone has seen about $52.89 million in net outflows from SOL, while OKX recorded $26.98 million outflows. Within the past day, the only exchanges which have seen inflows coming in for SOL are Bitstamp with $1.19 million and Kraken with $501,160.
The decline in inflows coincides with the token’s drop to around $185 shortly after failing to maintain its hold above the $200 psychological threshold. In addition, the Chaikin Money Flow indicator for Solana has dipped significantly, signaling that liquidity is weakening and that large-scale accumulation is not currently in play.
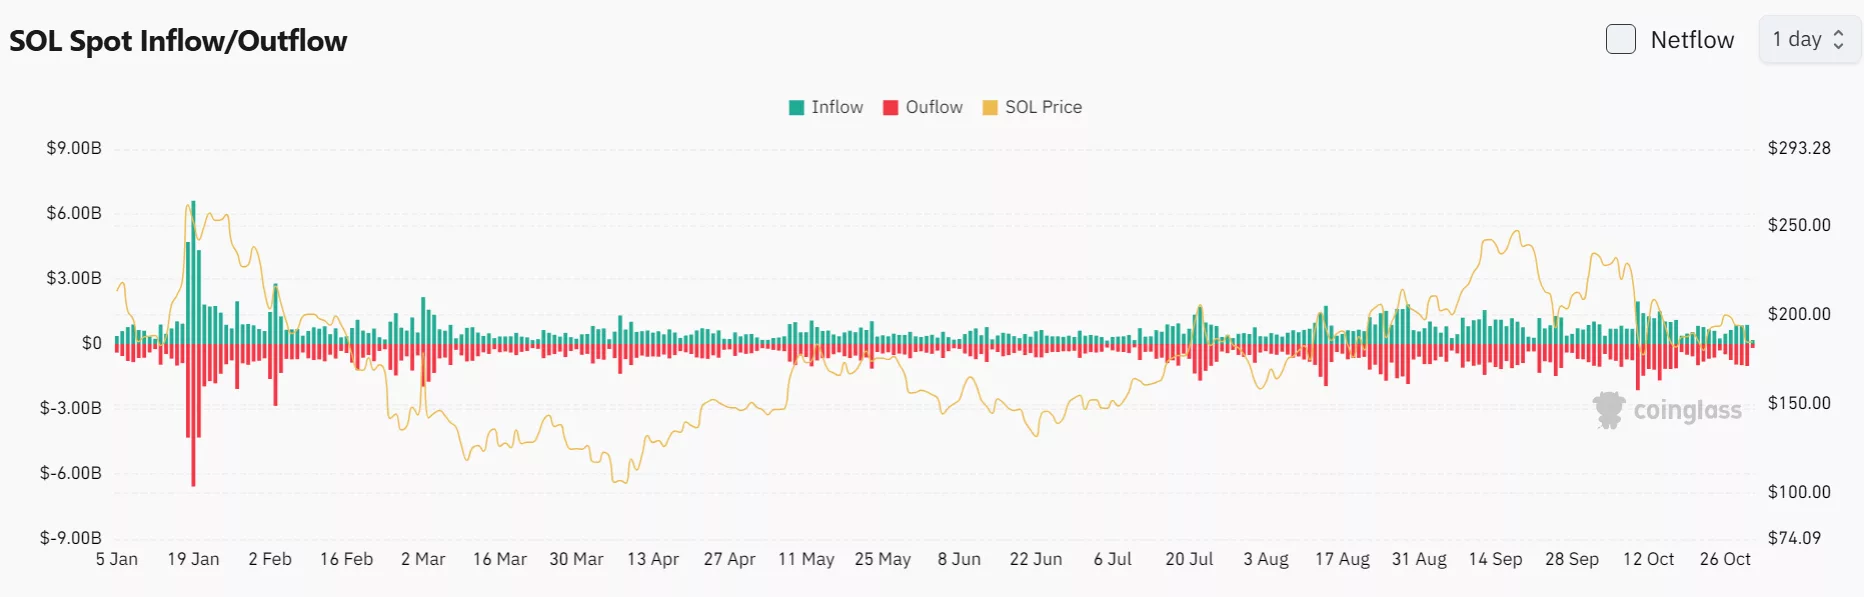 Solana inflows have fallen to a six-month low at $180.7 million on Oct. 31 | Source: Coinglass
After the launch of the first Solana ETFs on the U.S market, Bitwise Solana Staking ETF followed by a second contender in the form of Grayscale’s SOL-backed ETF, the token was fueled by investor enthusiasm into reaching above $200. However, the rally was brief as it fell back to $195 not long after that. Now, the token has only fallen further away from the $200 threshold.
Despite having reached more than $110 million in daily net inflows after their debut on the market, the two Solana ETFs have seen daily inflows fall to just $37.33 million according to SoSoValue. This indicates that investors may have lost interest in the new ETFs and reverted back to more mainstream crypto ETFs that are backed by Ethereum ( ETH ) and Bitcoin ( BTC ).
Solana price analysis
After failing to break through the $200 mark, Solana continues to fall further down. In the past 24 hours, the token has dropped by 4.7% and is currently trading at around $186, hovering just below the 30-day moving average which sits near $187.50.
The MA has now flipped into resistance, suggesting the short-term trend has shifted bearish. Each minor rebound attempt over the past few sessions has been capped by the moving average, reinforcing the idea that sellers remain in control. Unless SOL can decisively reclaim the $190 to $195 zone, a retest of lower support levels near $180 and possibly $172 remains likely.
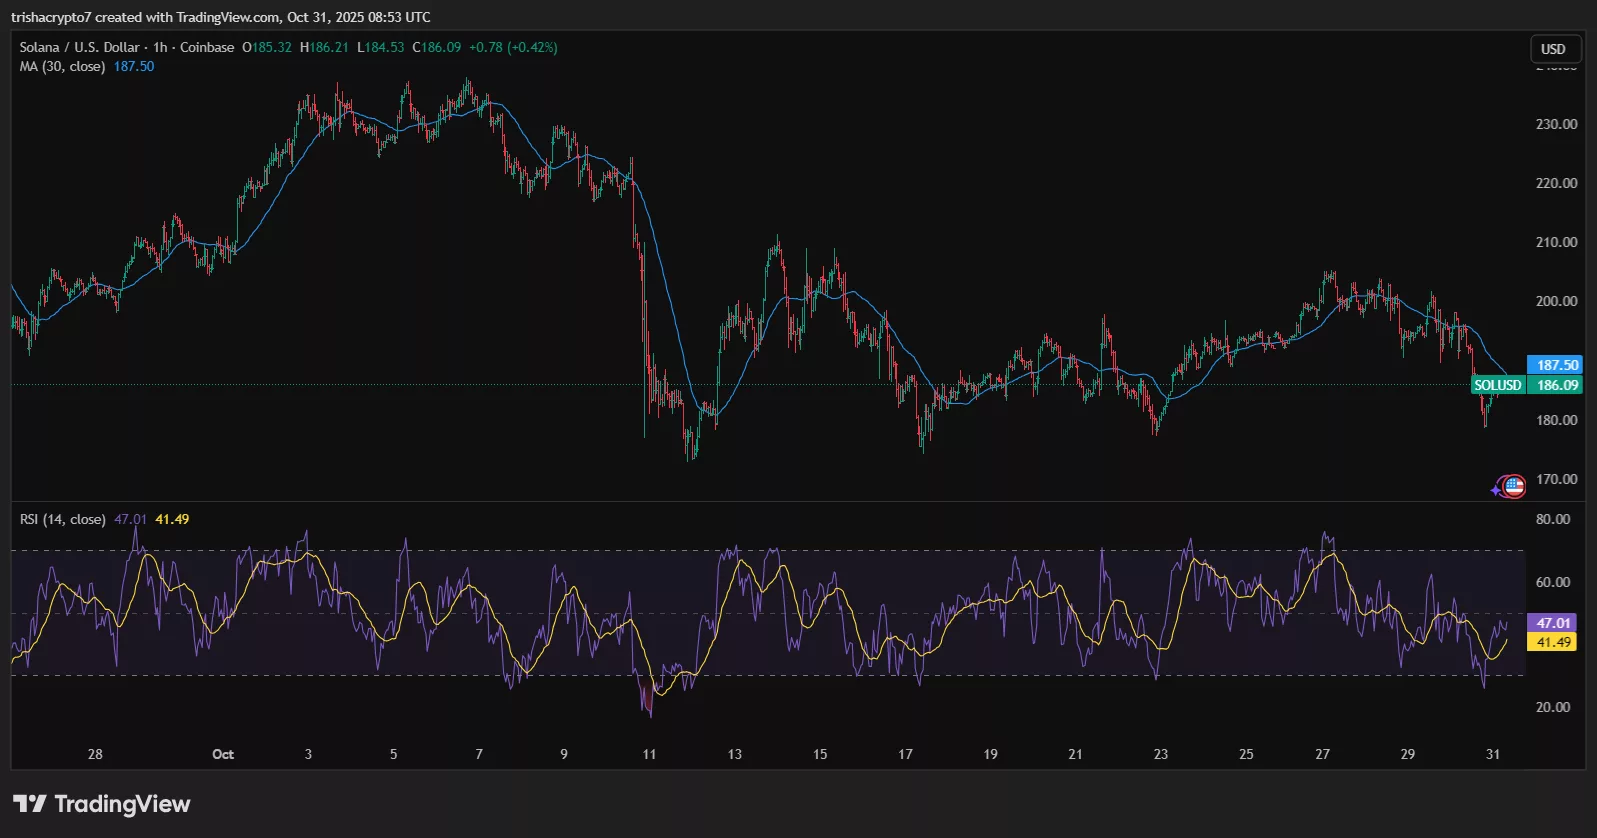 Solana has fallen below its 30-day moving average zone | Source: TradingView
Momentum indicators further confirm this weakening structure. The Relative Strength Index, currently oscillating around 47, shows a lack of bullish momentum after failing to push above the neutral 50 line. The RSI’s recent lower highs suggest that buying pressure has continued to fade even during minor bounces, which is consistent with the idea that liquidity and demand for SOL are tapering off.
Solana’s failure to break through $200 reflects a cooling market sentiment following months of strong gains. With both the moving average and RSI showing weakness, the path of least resistance in the short term appears to lead downward. To reverse this setup, bulls would need to reclaim and hold above the $190 to $195 range with renewed volume.
If SOL fails to bounce back, it could see continued consolidation or a further pullback below $180 before any meaningful recovery attempt can be made.
Disclaimer: The content of this article solely reflects the author's opinion and does not represent the platform in any capacity. This article is not intended to serve as a reference for making investment decisions.
You may also like
400,000 BTC massive withdrawal! The crypto market begins its search for a bottom!
Countdown to rate cuts! Trillions in liquidity shift—who will be left exposed: bitcoin, gold, or US stocks?
The article analyzes the current transitional phase of the global economy from being fiscally driven to being led by the private sector. It points out that fiscal spending and Treasury quantitative easing have fueled asset bubbles in recent years, but now the liquidity cycle is peaking. Summary generated by Mars AI. This summary is generated by the Mars AI model, and the accuracy and completeness of its content are still in the process of iterative updates.

Bull vs. Bear Showdown at $106,000! Is Bitcoin About to Find Its True Direction?
The price of bitcoin has shown characteristics of a key pivot level around $106,400, repeatedly acting as both support and resistance, influencing market trends and trading decisions. Summary generated by Mars AI. This summary is produced by the Mars AI model, and its accuracy and completeness are still in the process of iterative improvement.

Market volatility weakens, Bitcoin enters an accumulation phase