As Bitcoin enters the second day of a nasty reversal, more than 9% down and over $10,000 lost so far, what chance do the altcoins have? Many have taken a far worse beating. That said, a few of the top altcoins like $ETH and $SOL have hit excellent buying opportunities. Are they a buy, or is the crypto market just too volatile right now?
Is the total market cap of the altcoins a cause for concern?

Source: TradingView
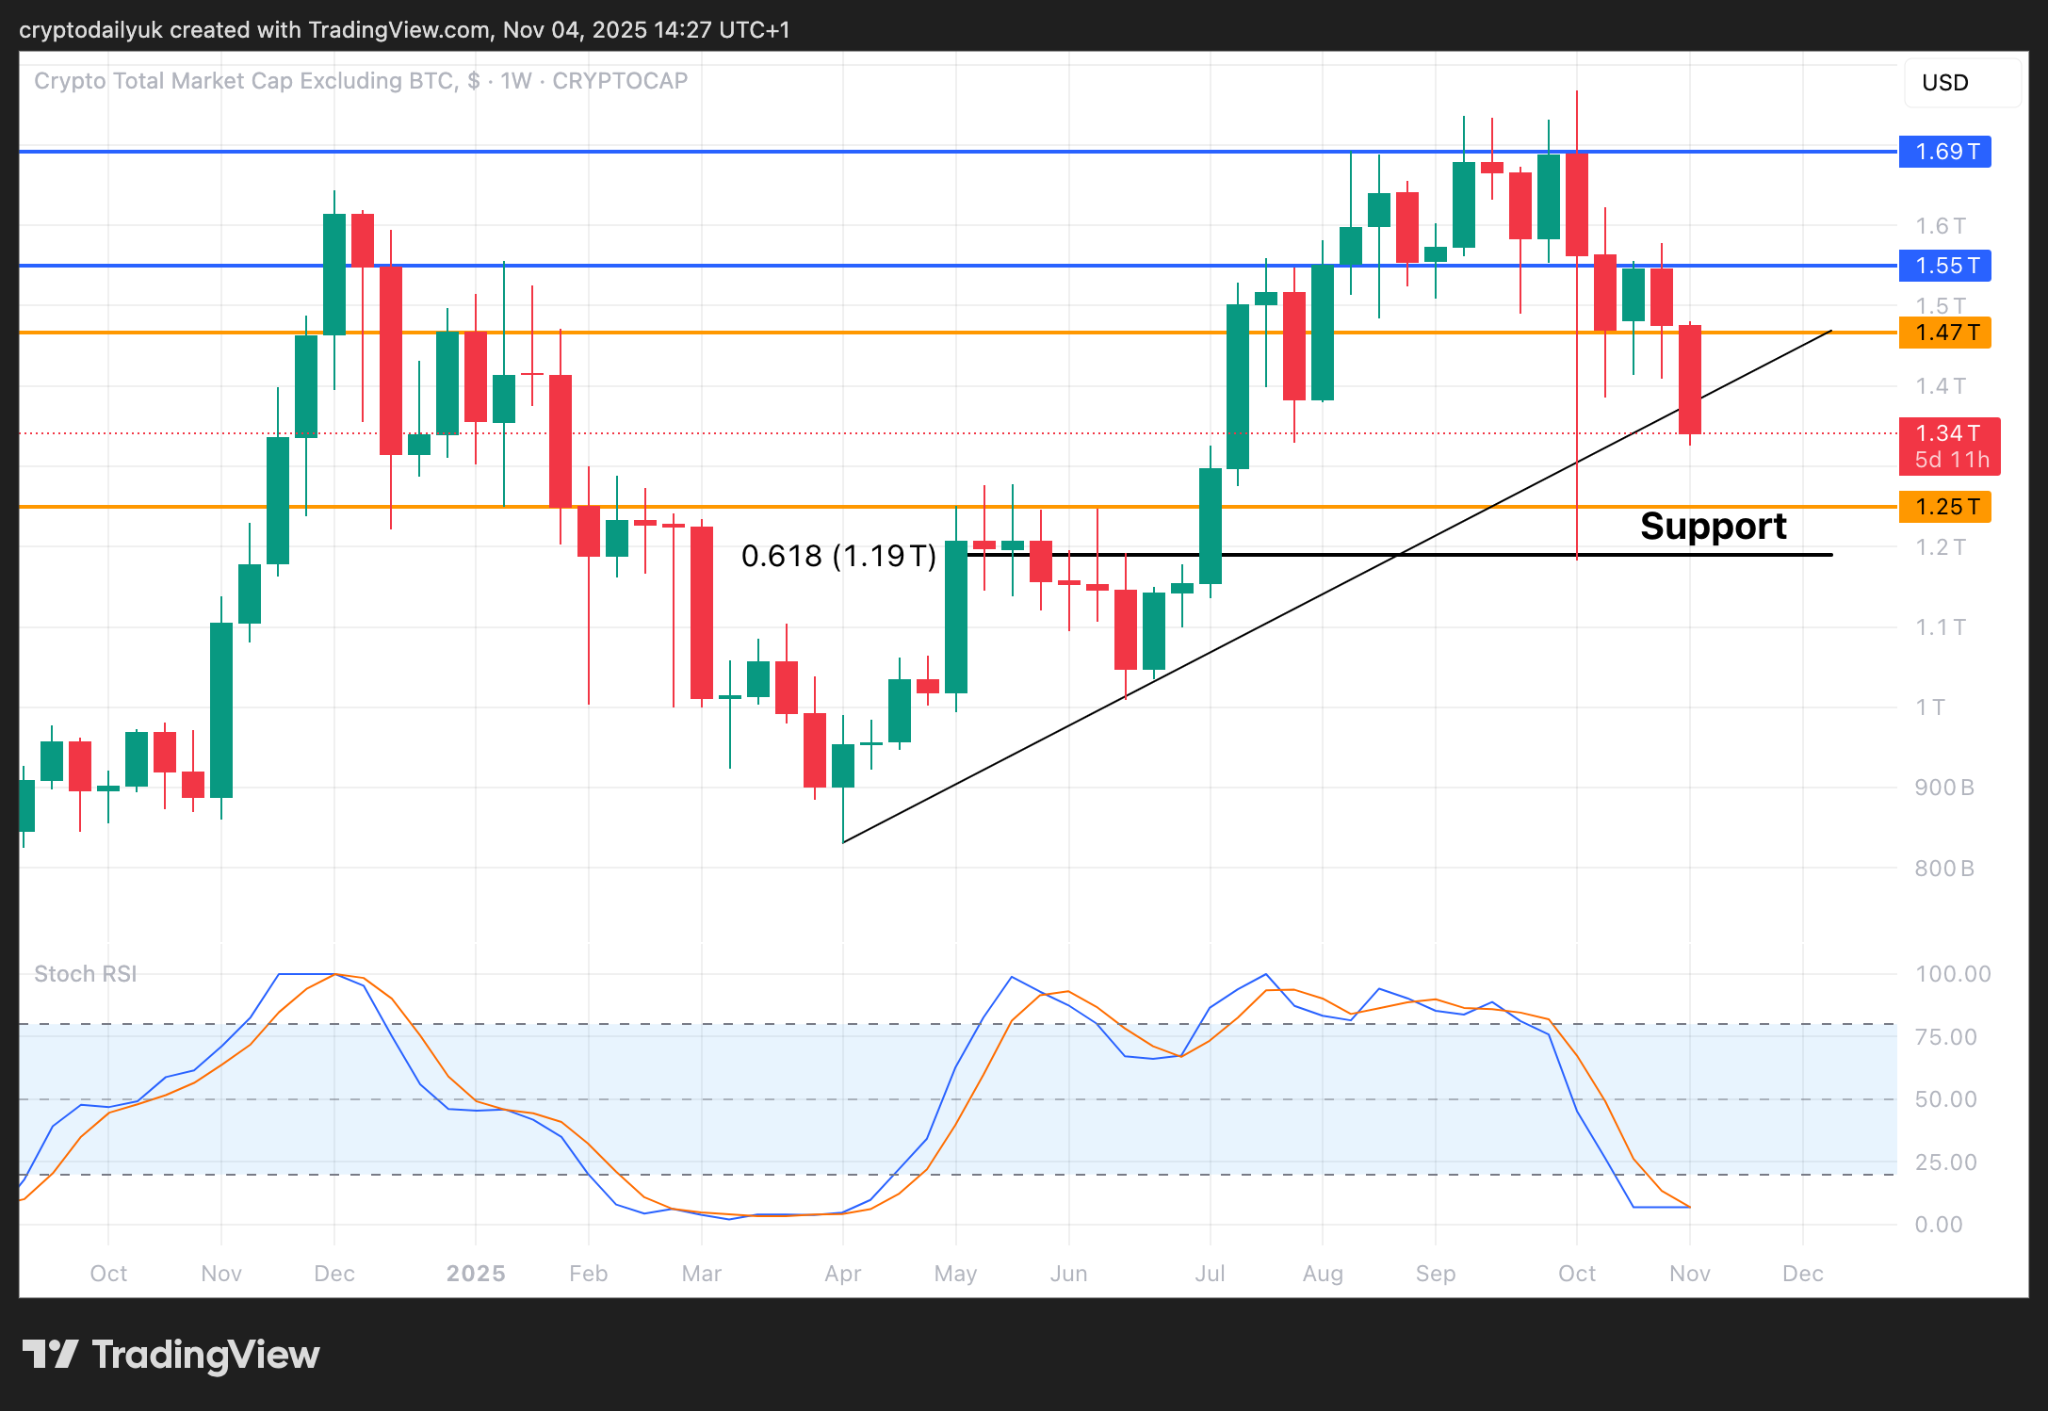
Looking at the weekly Total2 chart (market capitalization of all altcoins, excluding Bitcoin) it can be seen that yes, there is a horrible red candle that is poking down through the ascending trendline. It has broken through the $1.47 trillion horizontal support, and could be heading down to the $1.25 trillion support level, or even the 0.618 Fibonacci at $1.19 trillion.
However, there are two major factors to bear in mind here. The week is only two days old, and the Stochastic RSI indicators at the bottom of the chart are ripe for a turn back to the upside.
When zoomed into the shorter term time frames things can become very disheartening. It may not be too much longer before the current tall red candle becomes a lot shorter, and at least moves back above the trendline. Also, look at the last time the Stochastic RSI indicators turned back up from the bottom - a $933 billion move was the result.
$ETH bull flag still valid

Source: TradingView
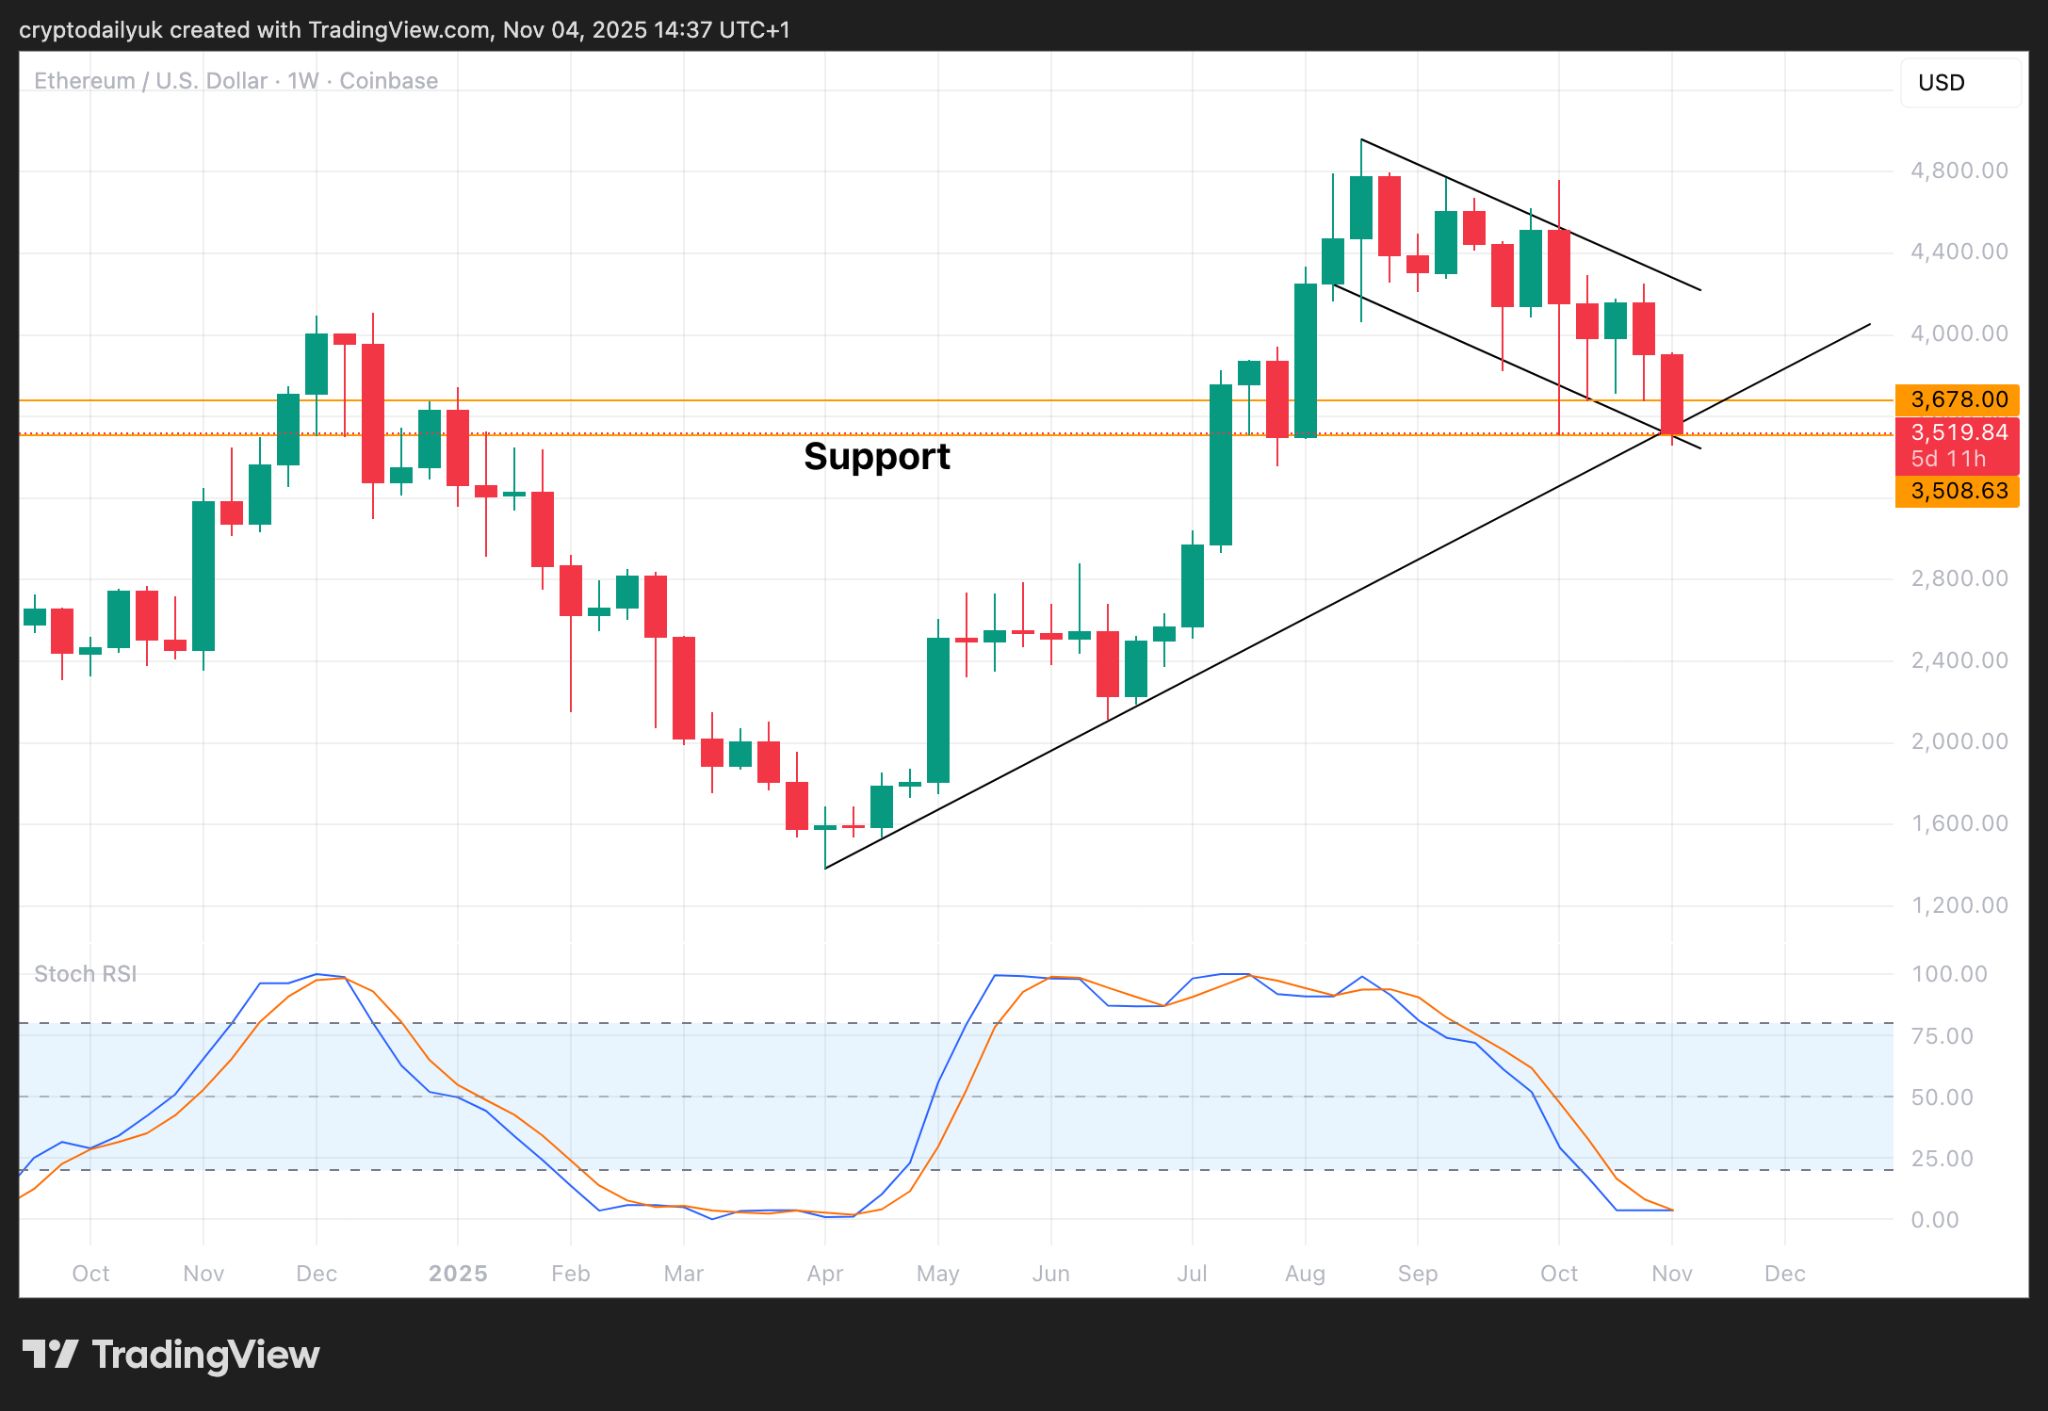
$ETH has lost around 10% of its value since the beginning of the week, and it’s only Tuesday. Once again, in the short time frame things look really scary. Zoom out into the weekly time frame and things look perfectly normal.
Of course, if the price were to fall through the ascending trendline, and out of the bottom of the bull flag, things could potentially get nasty very quickly. However, the price is sitting on a very strong horizontal support level at $3,500, and although the ascending trendline is beginning to see a candle body push through it, there is the rest of the week for the price to regain its balance.
Again, the Stochastic RSI at the bottom of the chart suggests that a rally back to the upside may not be far away. Looking back at this setup in a few weeks time, it might be seen that this was the retest of the bottom of the bull flag + strong horizontal support, before the rally that took $ETH back to new all-time highs.
$260 future target for $SOL?

Source: TradingView
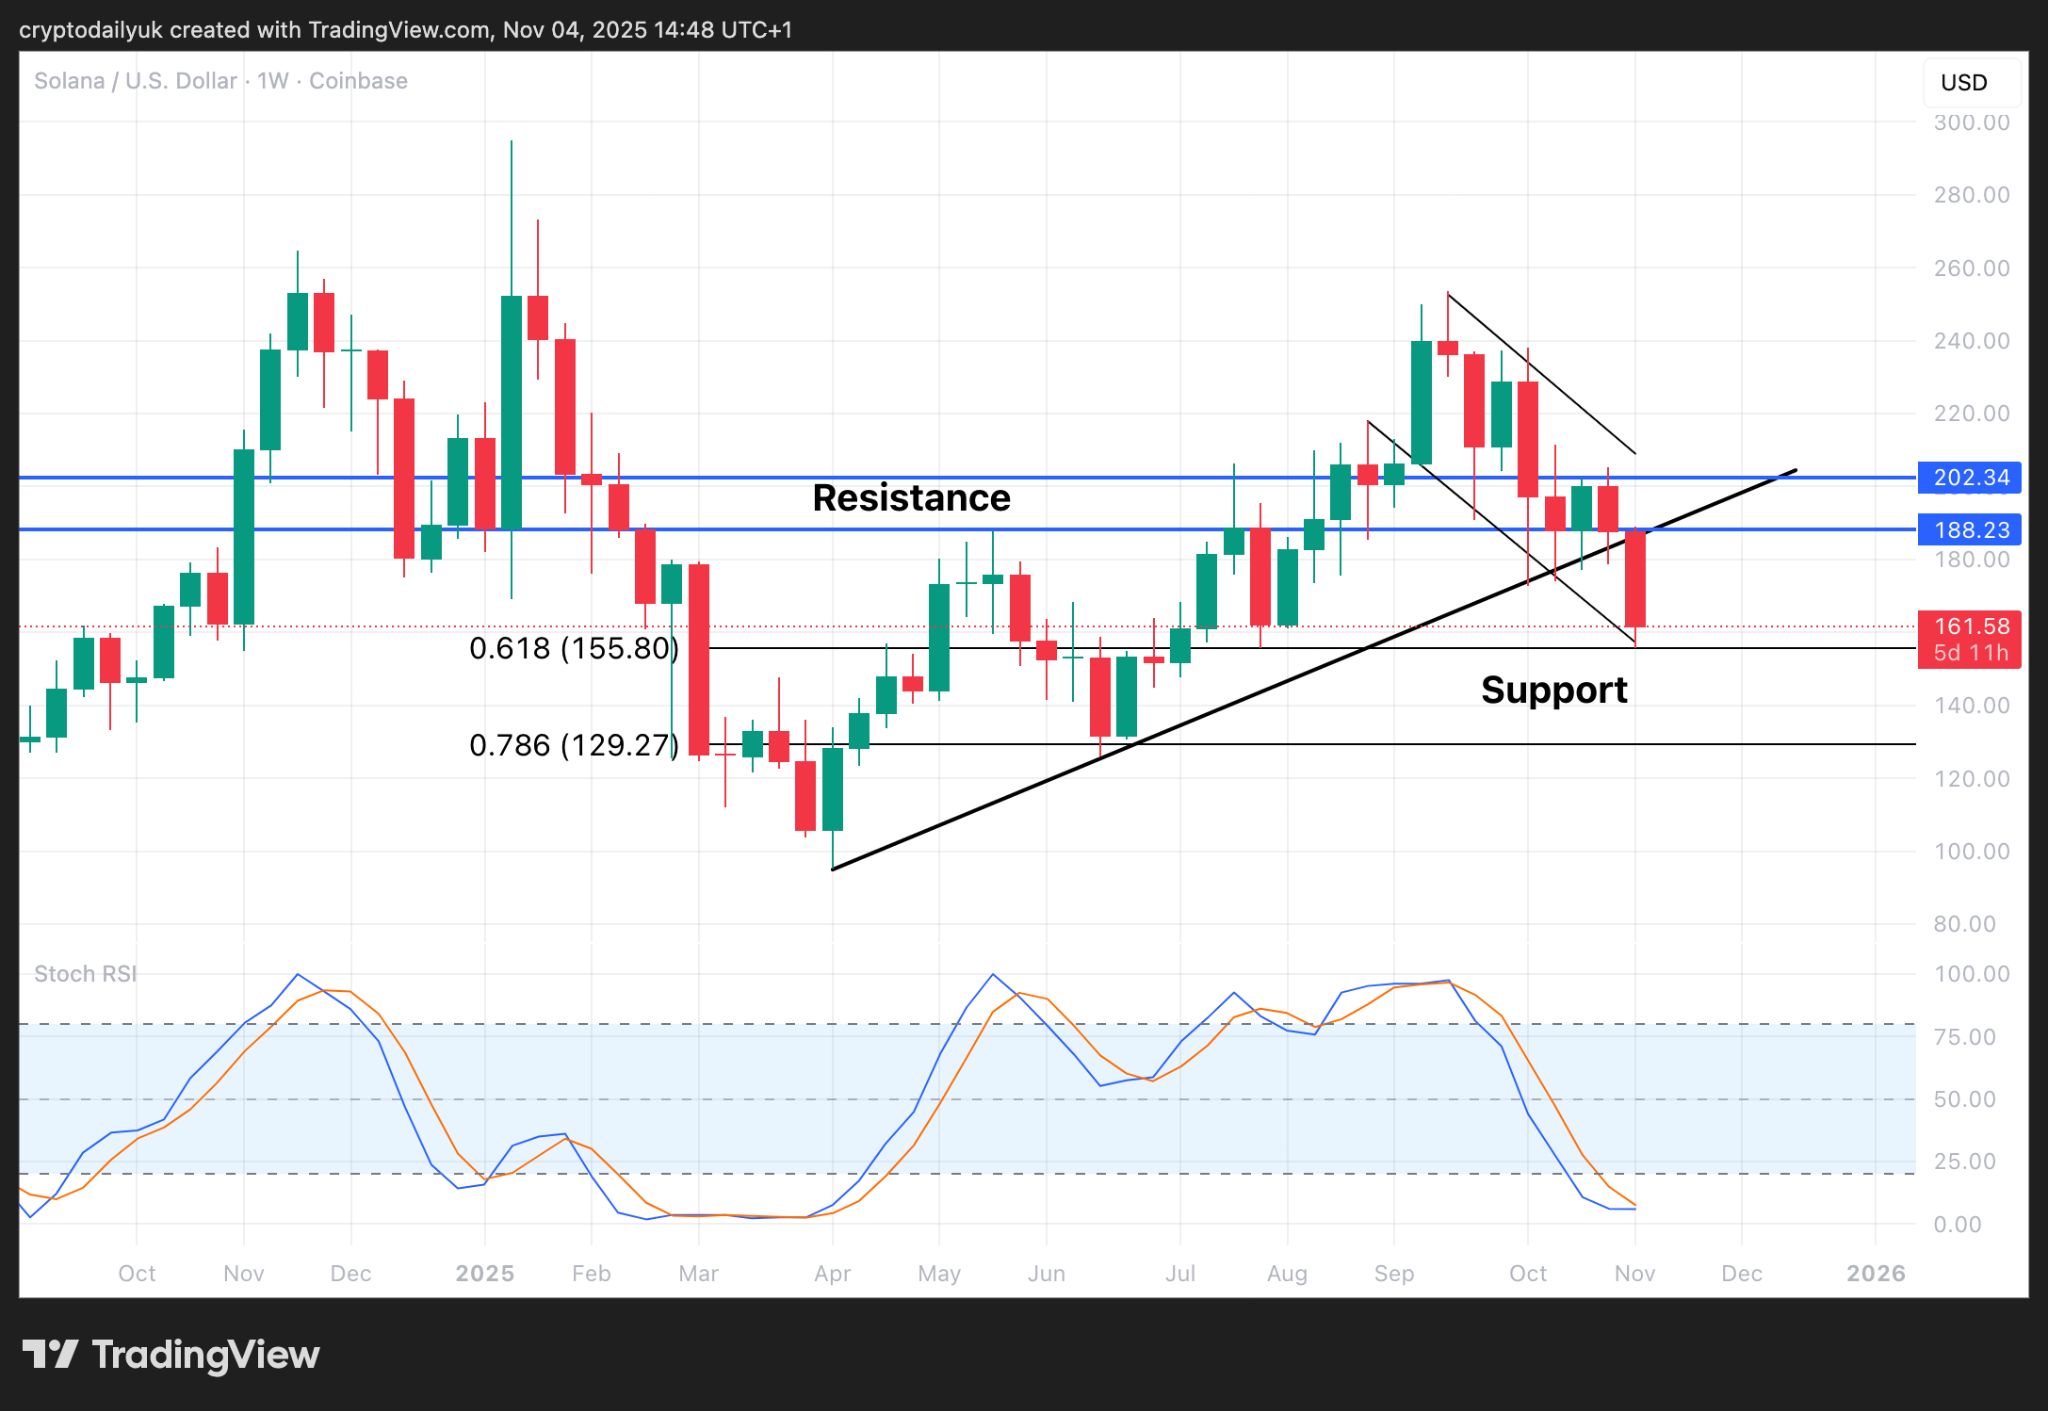
Viewing the $SOL price in the weekly time frame the setup looks fairly similar. The angle on the previous price rally may not be as steep, and the bull flag has probably been invalidated, but even taken as a descending channel, the price would get back to around $260 if the measured move played out.
It can be seen that the price has been down to retest the 0.618 Fibonacci - always a great place for a bounce, and yet again, the Stochastic RSI indicators are perhaps getting ready for a cross back to the upside.
All in all, while many investors are maybe chewing their fingernails in desperation, the actual big picture for the altcoins is not giving huge cause for concern. Yes, if prices do continue to melt down, especially if the traditional stock markets also start to slide, it could become quite different, and quite rapidly. That said, we haven’t got there yet.

