Bitcoin extended losses over the past day and now trades around $103,887, down 3.11% in 24 hours.
The move pushed the market to the lower end of today’s range. Through the U.S. afternoon and evening, price held near $107K with brief upticks.
Stay ahead in the crypto world – follow us on X for the latest updates, insights, and trends!🚀
Then, around the late session, sellers hit the tape and forced a sharp drop toward $104K.
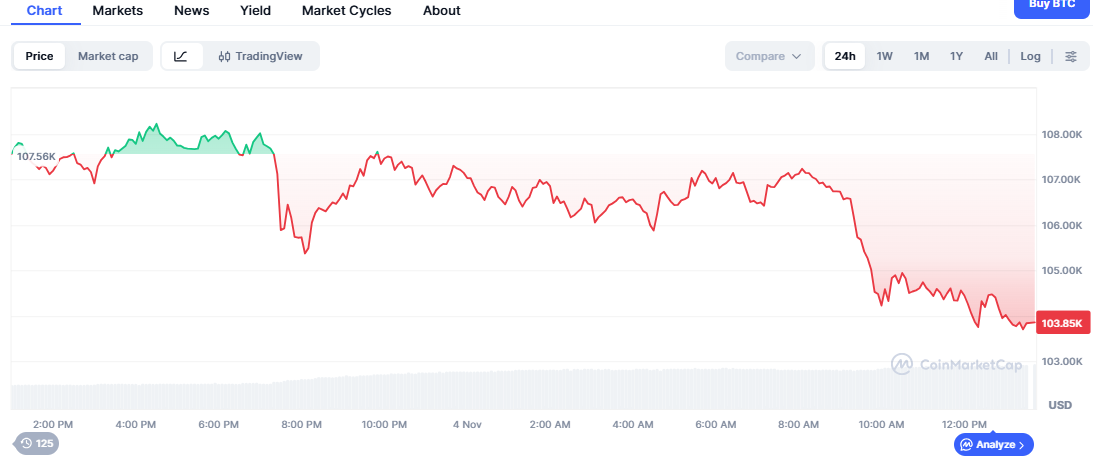 Bitcoin 24-Hour Price Chart. Source: CoinMarketCap
After the first leg down, Bitcoin attempted several rebounds. However, each bounce stalled below prior levels, and momentum faded into the morning.
By late morning, another wave of selling broke intraday support and dragged price to the $103.8K area. Trading stayed heavy as dips found only modest bids.
As of the latest print, immediate support sits around $103.5K–$104K on today’s chart.
Near-term resistance appears around $106.5K–$107K, where failed bounces clustered. Volatility remained elevated through the session, with lower highs and steady pressure.
The 24-hour picture shows a clear down-day, with Bitcoin holding just above the day’s lows.
Why Bitcoin Is Falling
Federal Reserve uncertainty is cooling risk appetite. The Fed cut rates by 25 basis points last week, as expected. However, Chair Jerome Powell struck a cautious tone and said a December cut is not assured.
Before the meeting, traders priced the December cut at about 96%. After Powell’s press conference, those odds slid to under 70%.
As expectations reset, investors rotated away from risk. Consequently, Bitcoin lost support it had drawn from hopes of steady easing and moved lower with other risk assets.
Bitcoin ETFs log heavy outflows
U.S. spot Bitcoin ETFs saw a fresh wave of redemptions at the end of October and the start of November, led by BlackRock’s IBIT.
Across Oct. 29–31 and Nov. 3, total net outflows reached about $1.34 billion, reversing the brief inflow seen on Oct. 28, according to Farside Investors data.
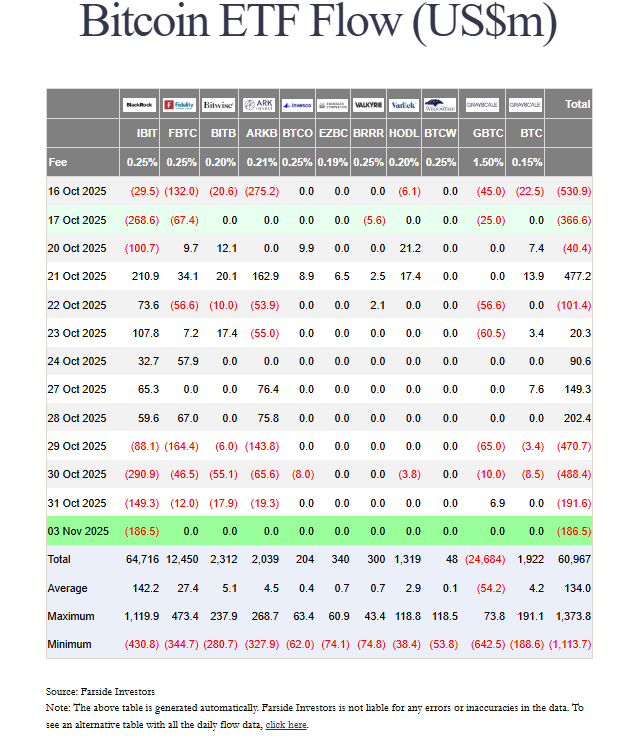 Bitcoin ETF Flow Table October 29 to November 3. Source: Farside Investors
BlackRock’s IBIT posted four straight down days: -$88.1M (Oct. 29), -$290.9M (Oct. 30), -$149.3M (Oct. 31), and -$186.5M (Nov. 3)—roughly -$715M over that stretch.
Selling pressure also hit Fidelity’s FBTC, which recorded sizable withdrawals on Oct. 29 and Oct. 30 before smaller outflows on Oct. 31.
Other issuers were mixed, but the aggregate tape stayed negative as redemptions outweighed subscriptions.
The late-October pullback in flows aligned with weaker Bitcoin prices and softer risk appetite after the Fed’s cautious guidance.
As of Nov. 3’s close, the flow picture remained net negative, signaling investors have been trimming exposure rather than adding to spot ETF holdings.
Coinglass heatmap flags upside liquidity after $1.17B long liquidations
Crypto commentator CryptosRus said a “short squeeze” could form on Bitcoin after a sharp reset in derivatives.
He cited Coinglass data showing about $1.17 billion in long positions liquidated over the past 24 hours and a cluster of resting liquidity above spot.
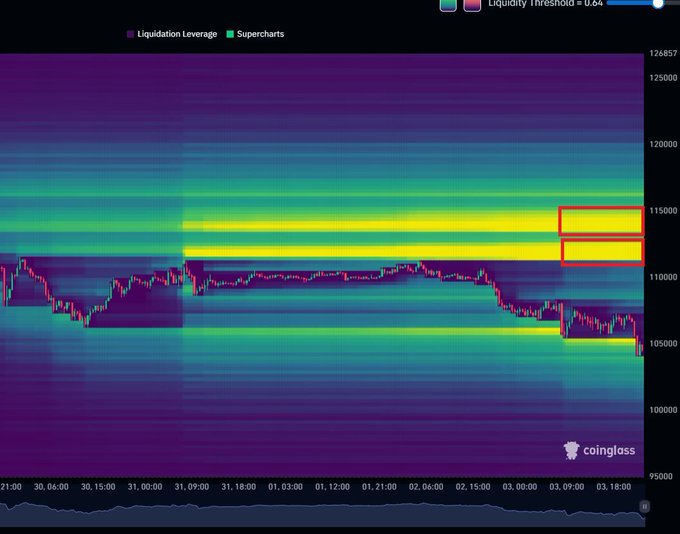 Bitcoin Liquidity Heatmap. Source: Coinglass / X
According to the post, heatmap levels between roughly $111K–$115K now hold concentrated liquidity.
Traders often track these bands because price can gravitate toward thick orders as market makers seek fills.
The note follows a day of downside in Bitcoin, which pressured leveraged longs and cleared near-term support. After the flush, order-book liquidity appears heavier on the top side, suggesting any rebound could target those zones first.
CryptosRus framed the setup as fuel for an upside move, while the underlying Coinglass chart highlights where stops and orders may sit.
The observation reflects positioning and liquidity, not a guarantee of direction.
Bitcoin Breaks Support as Rising Wedge Pattern Signals Shift
The chart created on Nov. 4, 2025, shows Bitcoin trading near $103,747, after falling below a key support zone at $105,000.
The daily pattern displays a rising wedge, a structure that often signals exhaustion before a downward correction.
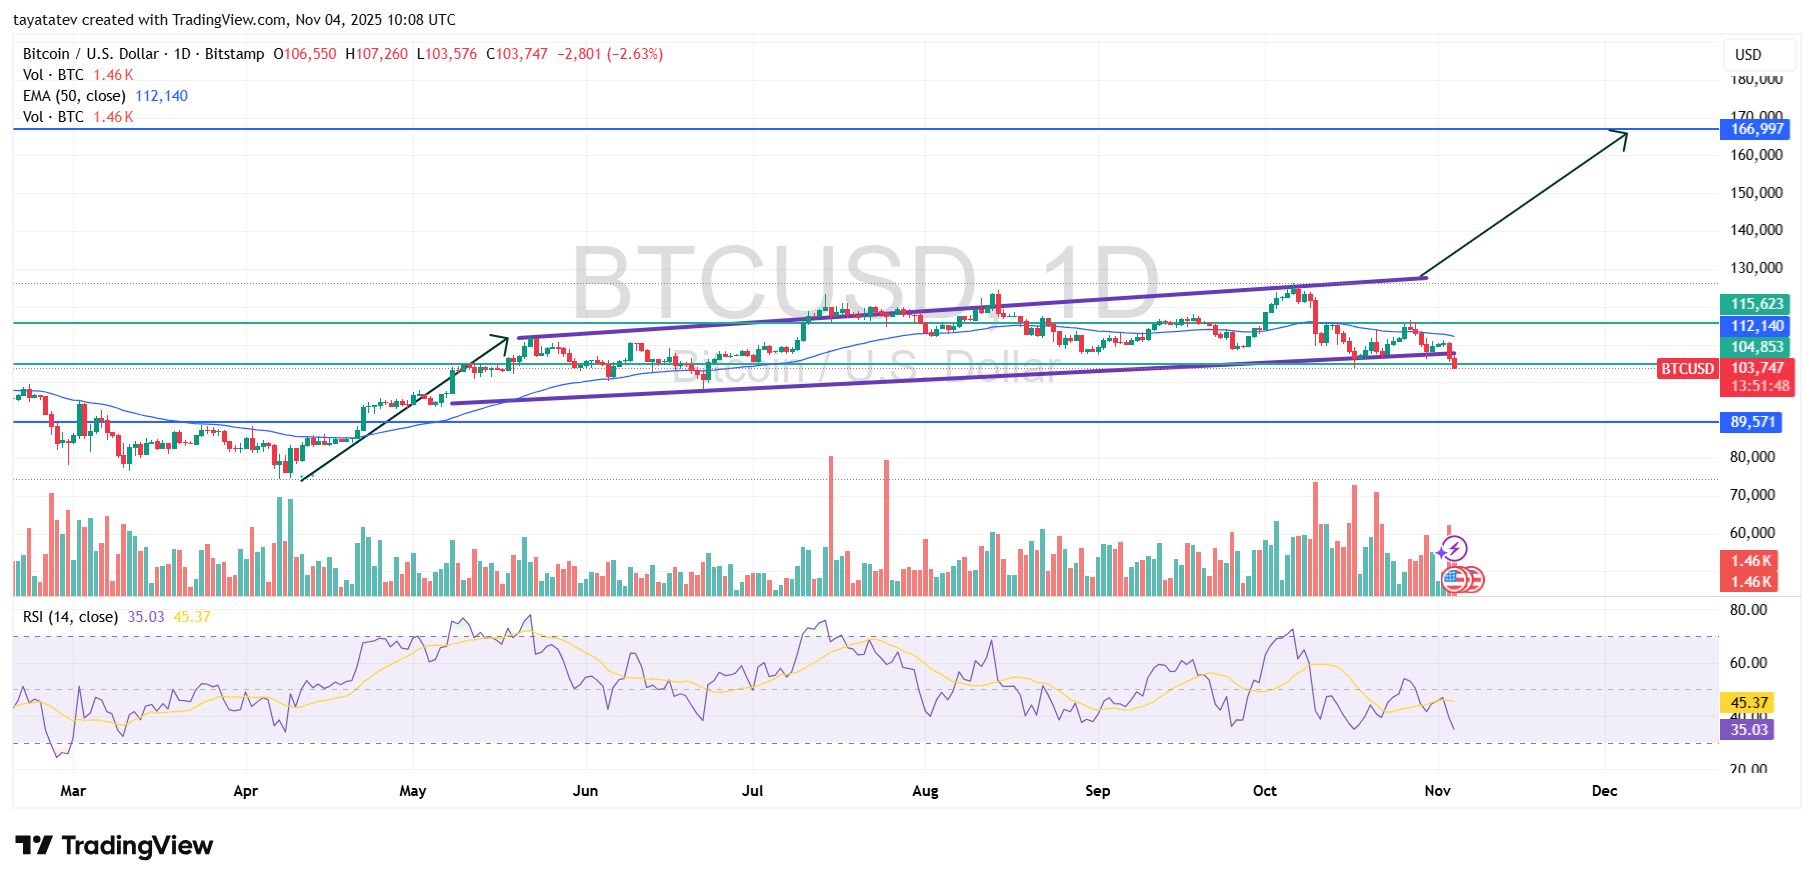 Bitcoin Rising Wedge Breakdown. Source: TradingView
A rising wedge pattern forms when price makes higher highs and higher lows within converging trendlines.
It reflects weakening momentum as buying pressure slows while sellers begin to step in.
Typically, once price breaks below the wedge’s lower boundary, it confirms a bearish reversal or a sharp correction.
In this case, Bitcoin broke beneath the wedge support, confirming a short-term bearish shift. The next visible support stands near $100,000, while resistance now forms at $112,000 (50-day EMA) and $115,000.
Despite this breakdown, the broader wedge structure suggests a possible rebound if price respects the pattern’s integrity.
Technically, Bitcoin could still rise about 61% from the current level, which points to a potential upside target near $166,997 once momentum flips and buyers regain control.
However, the move’s timing remains uncertain. Current fundamentals—including fading ETF inflows and Fed-driven risk aversion—may temporarily limit upward traction.
If the market stabilizes above $100,000, the rebound toward $115,000 would confirm that Bitcoin continues to follow its long-term technical structure.

Editor at Kriptoworld
LinkedIn | X (Twitter)
Tatevik Avetisyan is an editor at Kriptoworld who covers emerging crypto trends, blockchain innovation, and altcoin developments. She is passionate about breaking down complex stories for a global audience and making digital finance more accessible.
📅 Published: November 4, 2025 • 🕓 Last updated: November 4, 2025