Bitcoin May Face "The Last Drop": The Real Scenario of Liquidity Squeeze Is Unfolding

Bitcoin may be in the "final drop" stage of this correction. At the intersection where fiscal spending resumes and the next interest rate cut cycle begins, a new liquidity cycle will also be restarted.
Bitcoin may be in the "final drop" phase of this round of correction. At the intersection of resumed fiscal spending and the start of a future rate-cutting cycle, a new liquidity cycle will also be reignited.
Written by: ET, SoSoValue Community Researcher
I. Introduction
While investors are still searching for emotional and technical explanations for bitcoin's decline, the real answer has quietly been written into the ledgers of the US financial system: US dollar liquidity is experiencing a structural tightening. Specifically, this is manifested as:
- The Treasury's TGA account balance is close to $1 trillion, absorbing a large amount of market liquidity;
- Short-term funding market pressures have surged, with the SOFR–FDTR spread widening to +30bp at one point;
- The Federal Reserve was forced to restart temporary repo operations (Overnight Repo), injecting nearly $30 billion in liquidity into the market—this is the first time since the 2019 repo crisis.
This liquidity "vacuum" is not accidental; the core reason is the government shutdown. The Treasury, facing a budget deadlock and the risk of a potential government shutdown, preemptively "hoarded cash," issuing large amounts of debt and locking cash into the TGA account, directly draining bank reserves. The amount of "market dollars" available is decreasing, putting pressure on risk assets—bitcoin is the earliest and most sensitive victim.
However, the script is not entirely pessimistic. Historical experience shows that every time the Treasury restocks and liquidity is extremely tight, it often signals that a reversal is near.
As of November 5, the number of days the US government has been shut down has reached a historical high, and fiscal, economic, and livelihood pressures are rapidly accumulating. SNAP food assistance is restricted, some airport security checks and federal air traffic control services have been temporarily suspended, and confidence among the public and businesses is declining in tandem. Against this backdrop, there are signs of easing in the bipartisan standoff, especially as the recent pullback in US stocks from their highs will help accelerate the resolution of the government shutdown issue.
The market expects that the Senate may push for a compromise plan before the Thanksgiving recess on November 15, ending the government shutdown. At that time, the Treasury will resume spending, the TGA balance is expected to fall from its high, liquidity will return, risk appetite will recover, and bitcoin may be in the "final drop" phase of this round of correction—at the intersection of resumed fiscal spending and the start of a future rate-cutting cycle, a new liquidity cycle will also be reignited.
II. BTC Is Facing a US Dollar Liquidity Shock
As a non-yielding asset, BTC is highly sensitive to liquidity. Tight US dollar liquidity often puts downward pressure on BTC, which is one of the reasons for BTC's obvious weakness since mid-October, especially against the backdrop of the Nasdaq hitting record highs.
As shown in Figure 1, as of October 31 (UTC+8):
- The SOFR–FDTR spread turned positive, reaching as high as +30bp → the real cost of funds between banks exceeded the upper limit of the policy rate, meaning banks are borrowing at higher costs and liquidity is tight;
- RRP balance rebounded to $5.03 billion → the market is once again seeking collateralized liquidity from the Fed;
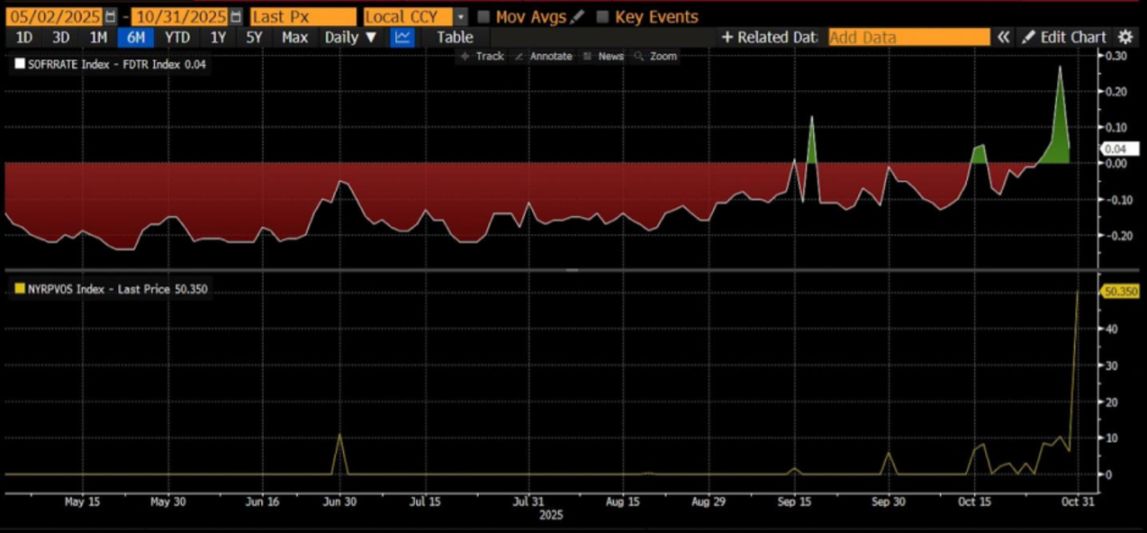
Figure 1: SOFR–FDTR Spread and RRP Balance
This indicates that there are clear signs of tension in the US short-term funding market. The Federal Reserve was forced to restart temporary repo operations (Overnight Repo Operations), injecting nearly $30 billion in liquidity into the market on October 31 (UTC+8).
This is the first time such operations have occurred since the 2019 repo crisis, marking that the liquidity shortage has shifted from a temporary phenomenon to a structural problem.
Overall, macro money supply (M2) remains loose, but the safety cushion of bank reserves is being rapidly drained, and the rise in market interbank lending rates shows that liquidity pressure is no longer just anticipated but is a reality that is happening.
Therefore, monitoring liquidity conditions going forward is an important reference for judging the direction of BTC prices.
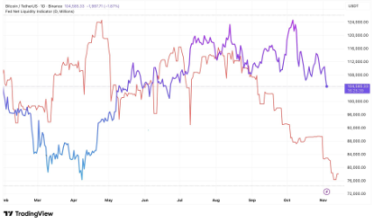
Figure 2: BTC Price and Federal Reserve Liquidity
III. Dissecting US Dollar Liquidity
US dollar liquidity = Bank reserves + Cash in circulation = Total size of the Federal Reserve's balance sheet − ON RRP (Overnight Reverse Repo) − Treasury TGA account
This is the core framework for observing the "disposable US dollar balance in the US financial system." It reveals:
Total US dollar liquidity = The Fed's "supply side" - The Treasury and money market's "absorption side".
The specific components are as follows:
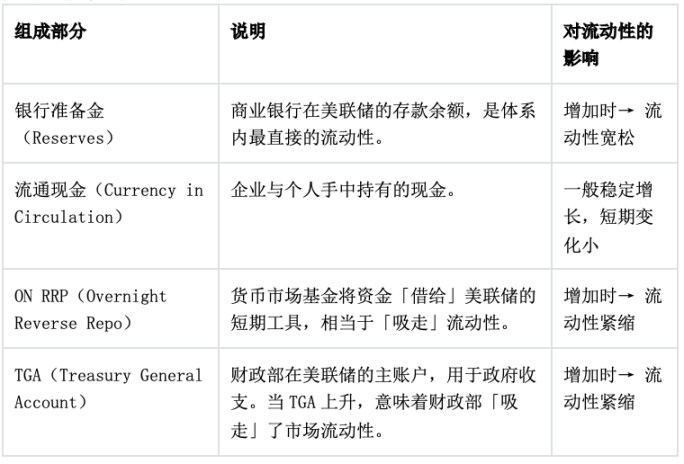
1. Logical Relationships
This formula actually describes the path of capital flows among the Federal Reserve, the Treasury, and the money market:
- The Fed expands its balance sheet → increases reserves and cash → liquidity increases. For example, during QE (Quantitative Easing), the Fed buys assets and increases bank reserves.
- TGA rises → the Treasury issues debt and absorbs cash → liquidity decreases. When the government increases debt issuance and tax inflows to the TGA, market funds are "sucked away."
- ON RRP rises → money market funds deposit idle cash at the Fed → liquidity decreases. This is equivalent to money market funds "parking" market funds at the Fed, no longer circulating in the banking system.
Therefore:
Liquidity ↑ = Fed assets ↑ + TGA ↓ + RRP ↓
2. Practical Application
This indicator is key to observing the liquidity cycle of risk assets:
- When TGA + RRP both decline → bank reserves surge → US dollar liquidity is loose → usually accompanied by a rise in risk assets (stocks, bitcoin).
- When TGA is replenished and RRP rises → liquidity is withdrawn → risk assets come under pressure.
Specific examples:
- Second half of 2023: After the debt ceiling was lifted, TGA restocked → liquidity tightened briefly → US stocks and crypto assets fluctuated.
- Early 2024: RRP fell rapidly, funds flowed back to banks → reserves rose → market risk appetite increased.
3. Extended Observation: Correlation with the Market
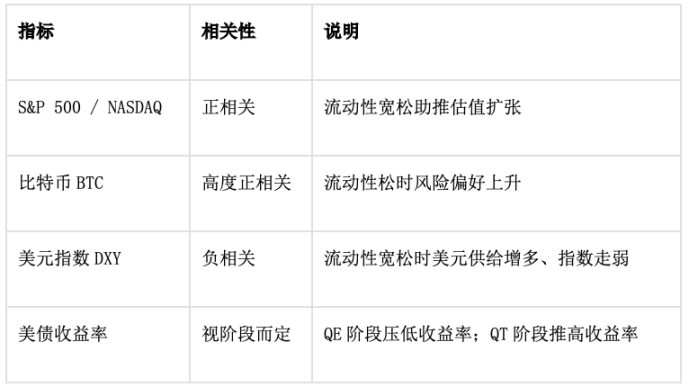
4. Conclusion
This formula is essentially the liquidity balance equation for the entire US dollar system.
The Federal Reserve determines the "total supply."
TGA and ON RRP are two "liquidity valves" that determine how much capital can flow into financial markets.
Therefore, when analyzing the trend of risk assets, it is more important to observe changes in RRP + TGA than to look at the Fed's balance sheet alone, as these are the real drivers of short-term US dollar liquidity.
IV. Recent Causes of Liquidity Tightness—TGA Continues to Absorb Cash
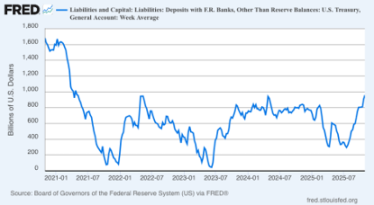
Figure 3: Changes in the US Treasury's TGA Account Balance
1. Indicator Interpretation
The chart above shows the balance of the US Treasury's main account at the Federal Reserve, the TGA (Treasury General Account). The horizontal axis is time (2021–2025), and the vertical axis is the amount (in billions of dollars). This line actually reflects the Treasury's absorption or release of liquidity and is an important adjustment valve for US dollar liquidity. Below is a complete professional interpretation in the context of recent years' government shutdown risks and fiscal operations.
The ups and downs of this line represent whether the Treasury is "absorbing cash from the market (TGA rising)" or "releasing funds to the market (TGA falling)."
- TGA rising → the government absorbs market liquidity (bank reserves decrease)
- TGA falling → the government releases market liquidity (bank reserves increase)
Therefore:
TGA ≈ Inverse indicator of market US dollar liquidity
When TGA rises, market funds tighten; when TGA falls, market funds loosen.
Combining time and events: The five-year liquidity rhythm from 2021–2025
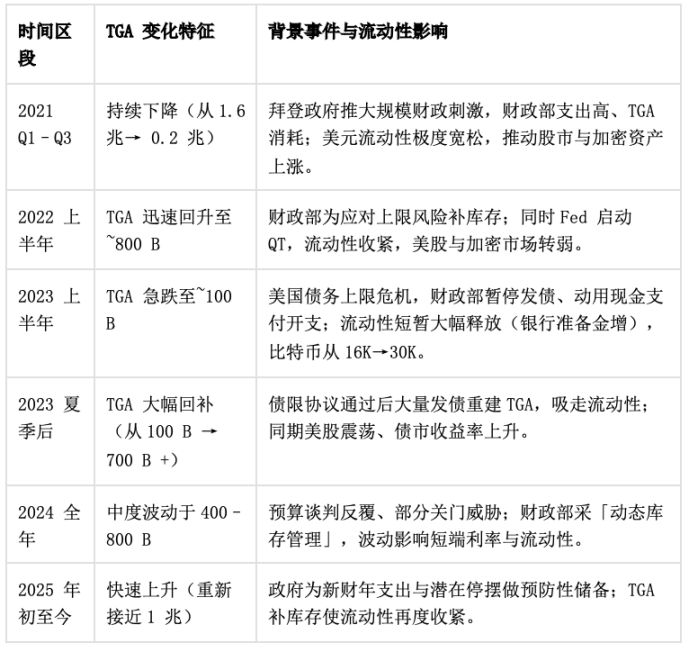
2. Structural Linkage with "Government Shutdown"
Before the shutdown: Treasury raises TGA for emergencies
When a congressional budget deadlock looms and the risk of a shutdown rises, the Treasury will preemptively issue debt and raise the TGA balance to ensure there is enough cash to pay essential expenses during a government shutdown.
During this stage, the market will experience short-term liquidity tightening and short-term interest rates will rise.
During the shutdown: Spending paused, debt issuance restricted
During the shutdown, some government payments are suspended, TGA levels remain flat or fall slightly in the short term, but since there is no new supply of US Treasuries, money market fund demand flows to ON RRP.
This creates a "structural liquidity mismatch": total liquidity is neutral but short-term liquidity is tight.
After the shutdown: Appropriations and back pay → TGA drops sharply
After government spending resumes, TGA falls and liquidity is instantly released. Bank reserves rise, repo market pressures ease, and risk assets often rebound at this stage.
For example, after the debt ceiling was lifted in 2023, BTC surged in the short term and the Nasdaq rebounded.
V. The Federal Reserve in Action: Liquidity Injection
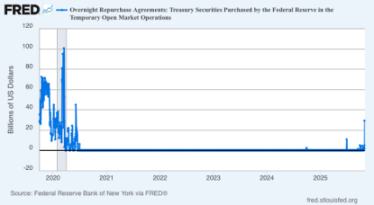
Figure 4: Federal Reserve ON RPs (Overnight Reverse Repo)
1. Indicator Interpretation
Source: FRED (New York Fed)
Latest data (October 31, 2025) (UTC+8): $2.94 billion
For reference: The peak in September 2019 was $4.975 billion
This indicator represents the Federal Reserve providing overnight cash to primary dealers through temporary repo operations (using US Treasuries as collateral), which is a direct means of injecting liquidity.
This tool had been unused for a long time after the pandemic, and its restart this time carries significant policy signals.
2. Three Key Observations
Policy background: The Fed's move is a response to "real shortages" in the short-term funding market. Although QT is about to stop, the continued decline in reserves has intensified interbank lending pressures. The restart of ON RPs means: "The Fed is shifting from passive balance sheet reduction to active liquidity management."
Scale characteristics: Although $2.94 billion is lower than the 2019 crisis level, its symbolic significance is strong, indicating that the liquidity gap has breached the Fed's observation threshold. If the scale of operations continues to rise in the next two weeks, it can be seen as a "quasi-policy shift."
Market mechanism:
- Banks and money market funds are forced to raise financing rates due to reserve shortages;
- The Fed releases liquidity through repos, temporarily suppressing the SOFR and repo spread;
- If this behavior continues, it will have a "mini QE" effect.
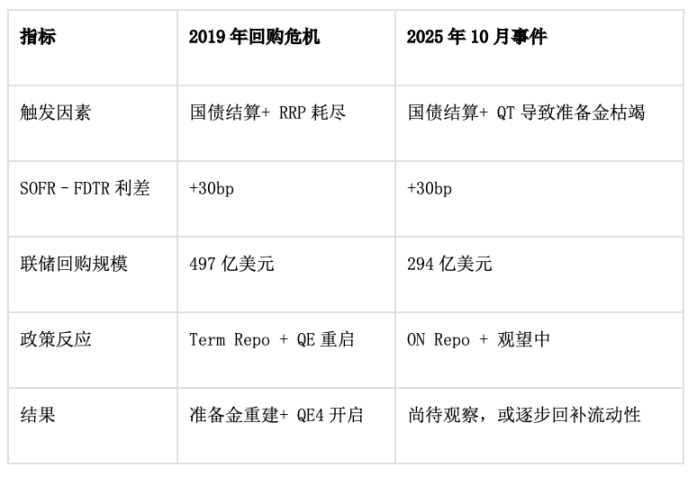
3. Historical Comparison: 2019 vs 2025
VI. Conclusion
1. The current TGA account is close to $1 trillion, which is the main reason for recent liquidity tightness. Once the government reopens and spending resumes, TGA will fall, US dollar liquidity will recover, and risk assets such as BTC are expected to gain support;
2. Before the government restarts, the Federal Reserve will continue to release liquidity through repos, temporarily suppressing the SOFR and repo spread and alleviating market liquidity tensions;
3. Prediction websites are betting real money on mid-November, that is, between November 10 and November 15 (UTC+8), and institutions such as Goldman Sachs expect the government to reopen within two weeks;
4. Therefore, BTC is likely undergoing its "final drop." At the very least, the government reopening and future rate cuts are certain, although the timing remains uncertain.
Disclaimer: The content of this article solely reflects the author's opinion and does not represent the platform in any capacity. This article is not intended to serve as a reference for making investment decisions.
You may also like
Is dropping below $100,000 just the beginning? Bitcoin "whales" have dumped $4.5 billions in one month, and the sell-off may continue until next spring
This wave of sell-offs may continue until next spring, and bitcoin could further drop to 85,000 dollars.

Galaxy Research Report: What Is Driving the Surge in Zcash, the Doomsday Vehicle?
Regardless of whether ZEC's strong price momentum can be sustained, this market rotation has already succeeded in forcing the market to reassess the value of privacy.
Soros predicts an AI bubble: We live in a self-fulfilling market
When the market starts to "speak": an earnings report experiment and a trillion-dollar AI prophecy.

Soros predicts an AI bubble: We live in a self-fulfilling market
The article uses Brian Armstrong's behavior during the Coinbase earnings call to vividly illustrate George Soros' "reflexivity theory," which posits that market prices can influence the actual value of assets. The article further explores how financial markets actively shape reality, using examples such as the corporate conglomerate boom, the 2008 financial crisis, and the current artificial intelligence bubble to explain the workings of feedback loops and their potential risks. Summary generated by Mars AI This summary was generated by the Mars AI model, and the accuracy and completeness of its content are still being iteratively improved.