Irys Launches With Big Swings: Can the New Token Hold Its Early Gains?

Irys launched only a few hours ago, and the price is already showing a wide, early trading range. It is a Layer 1 data chain built to merge on-chain data storage and smart-contract execution, which has made it one of the more anticipated launches this cycle. A possible airdrop-related supply unlock also means early IRYS
Irys launched only a few hours ago, and the price is already showing a wide, early trading range. It is a Layer 1 data chain built to merge on-chain data storage and smart-contract execution, which has made it one of the more anticipated launches this cycle. A possible airdrop-related supply unlock also means early IRYS price volatility is expected.
Now the chart shows the first real test: both upside and downside remain open, and volume signals will decide the first trend.
Early Strength Holds, but Volume Signals a Cautious Start
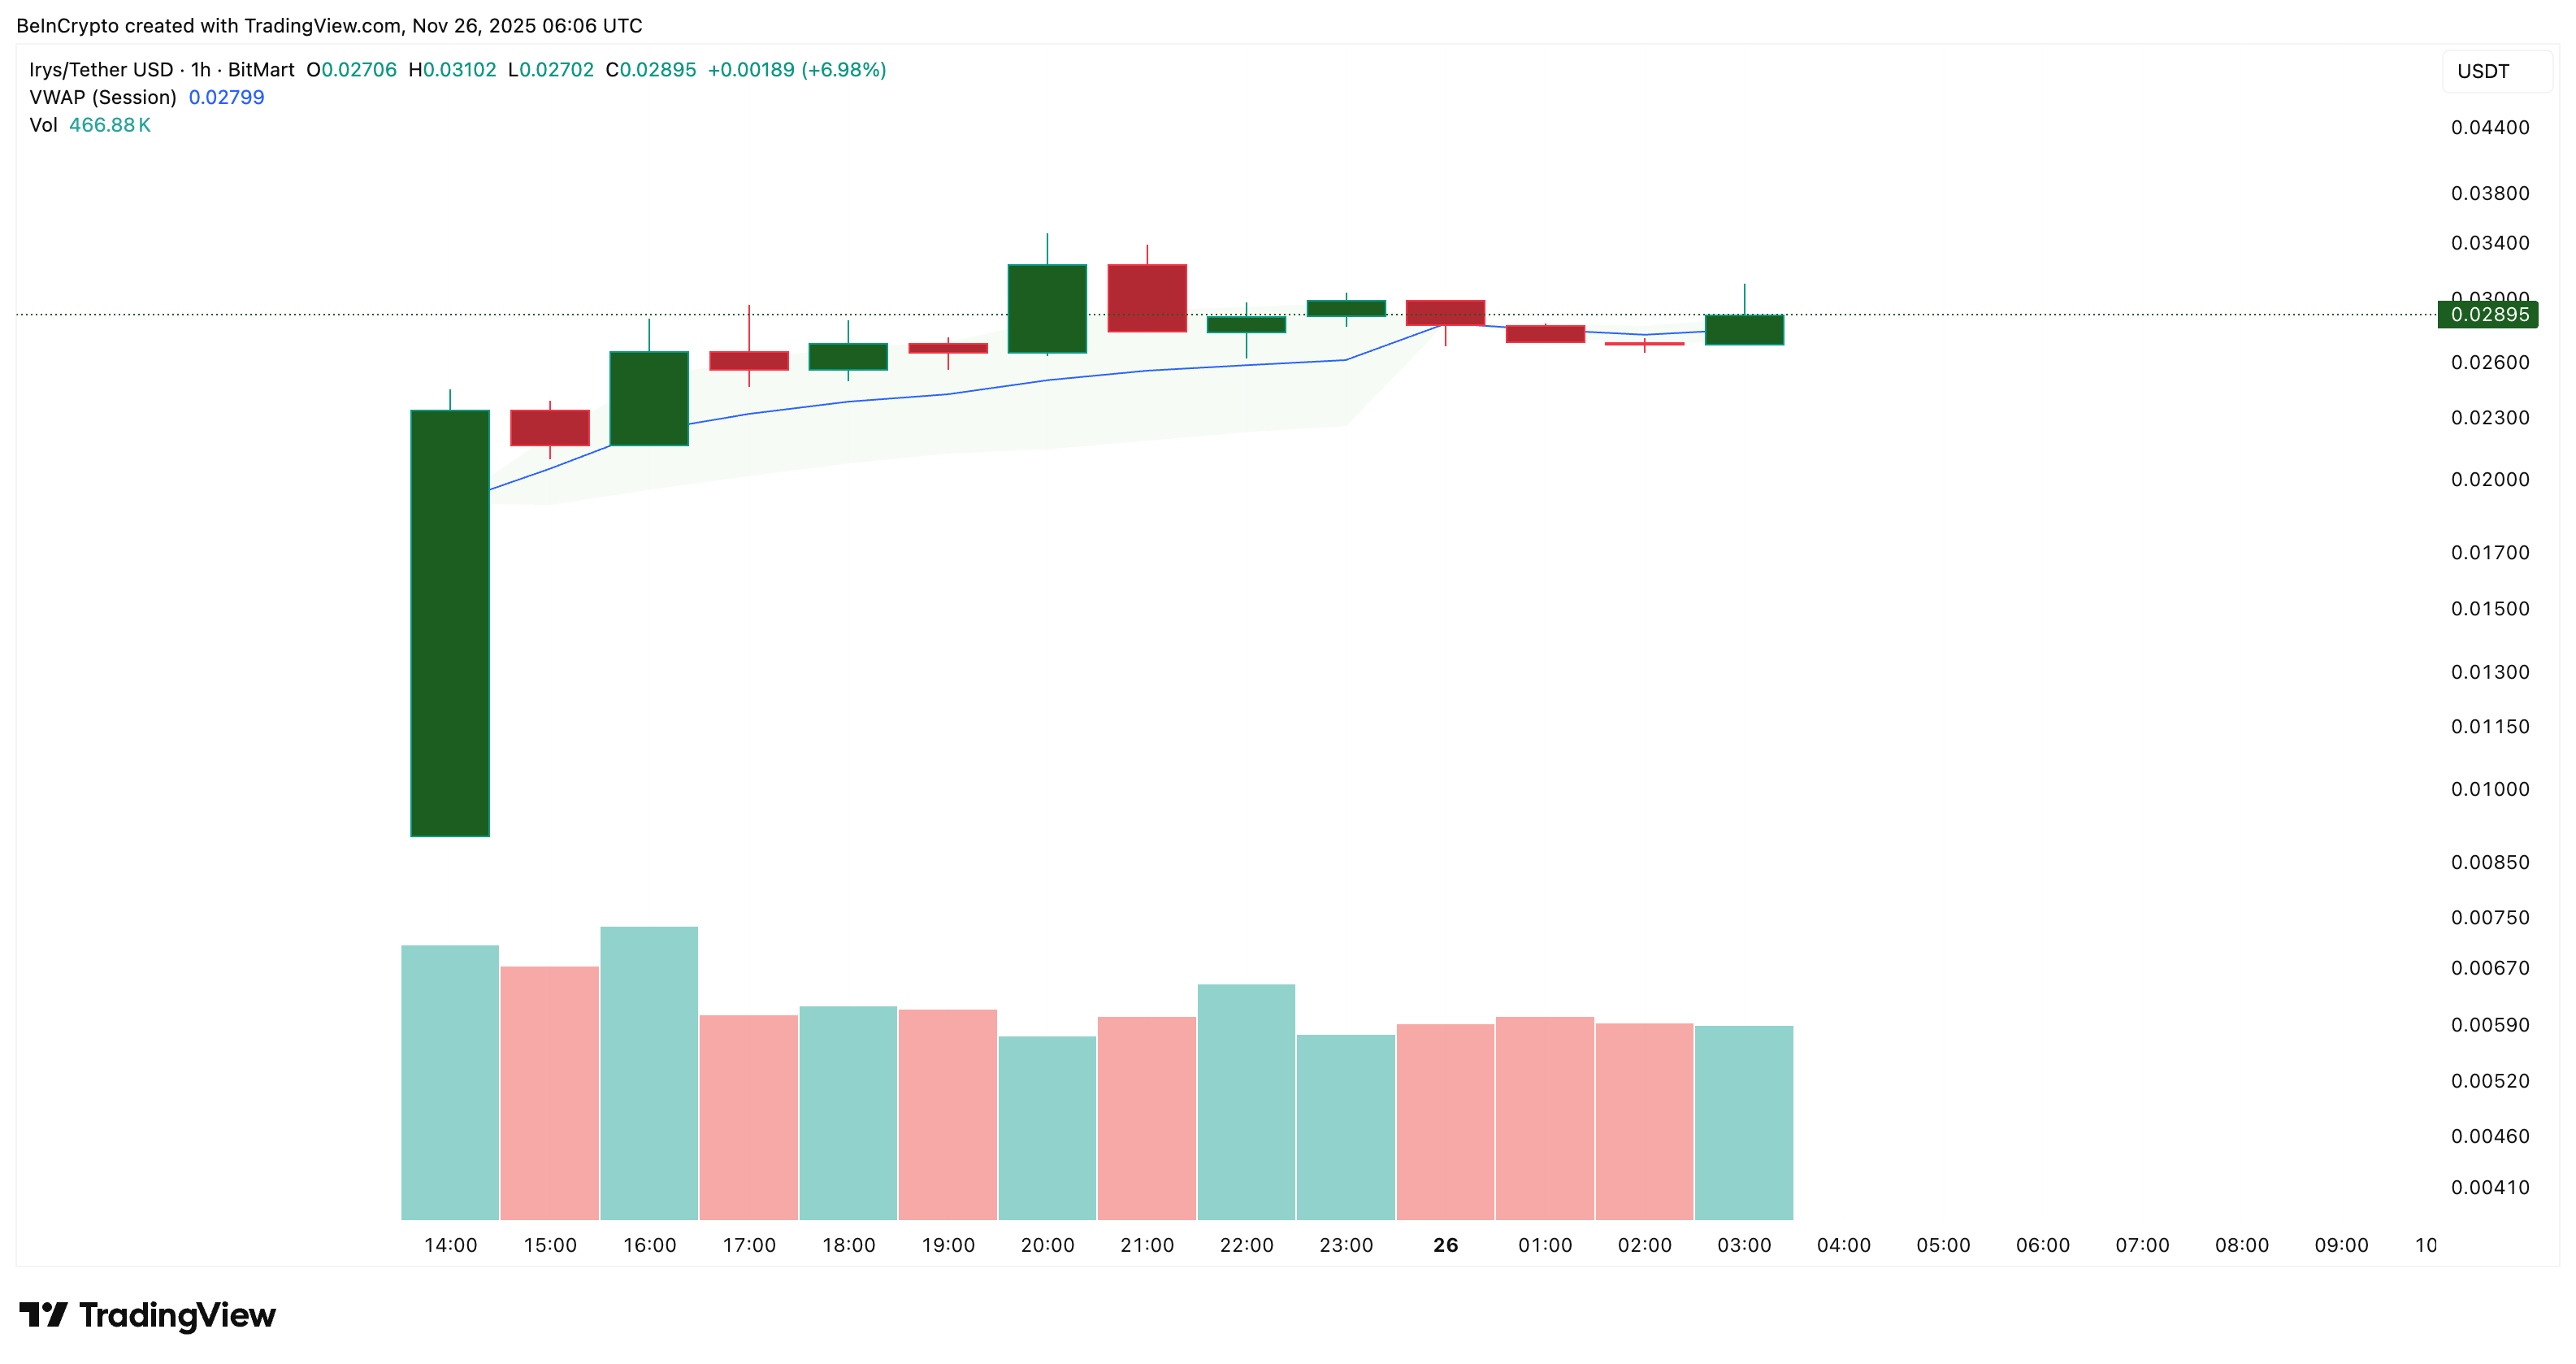
On the 1-hour chart, the IRYS price is using the volume-weighted average price (VWAP) as its main guide. VWAP tracks the average trading price in a session, but weights each trade by its volume, so it shows where the “real” bulk of trading is happening.
Since launch, the first large green candle closed above the VWAP line, which kicked off the initial move.
Standard volume bars back this up: early candles came with heavy volume, then activity cooled but stayed stable while price held near or slightly above VWAP.
The last two candles briefly closed below the line, but the next candle quickly reclaimed it. That shows dips below VWAP are being bought for now, even though no clear volume spike has appeared to confirm a strong trend yet.
 VWAP Shows Active Buying:
TradingView
VWAP Shows Active Buying:
TradingView
Want more token insights like this? Sign up for Editor Harsh Notariya’s Daily Crypto Newsletter
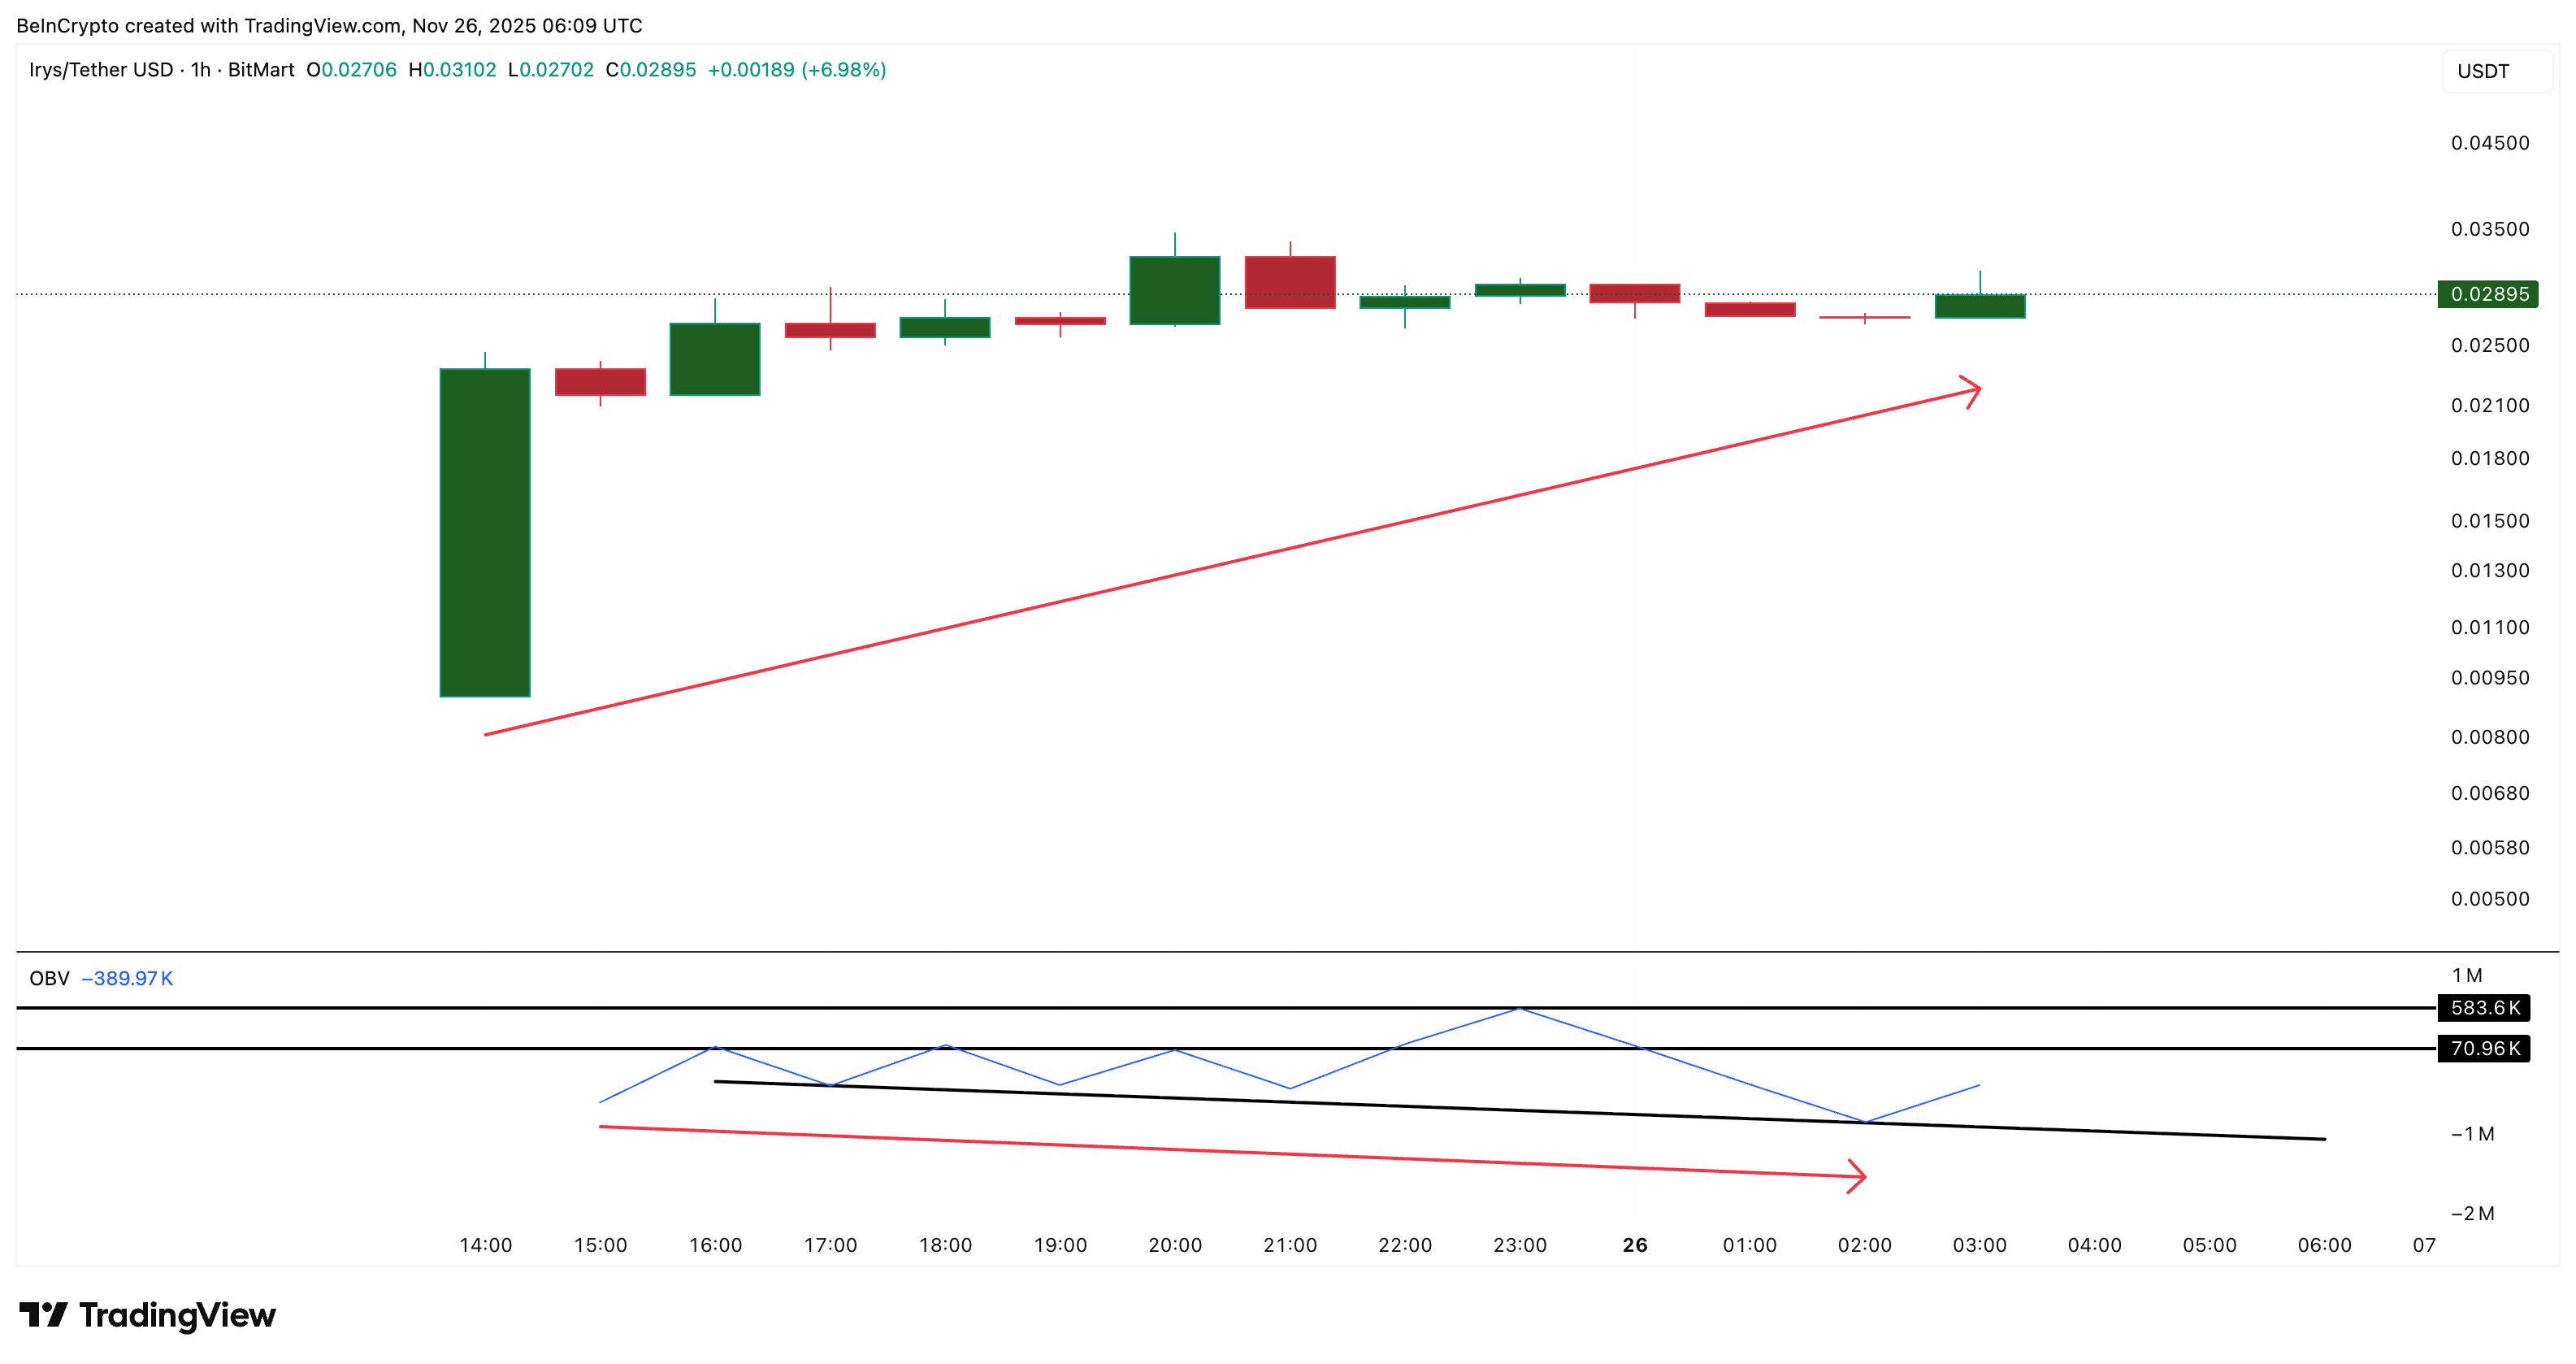
OBV on the 1-hour chart presents the other half of the picture. On-Balance Volume (OBV) tracks whether real trading volume is flowing in or out.
Since launch, the IRYS price has made a higher low. Yet, the OBV has made a lower low, meaning buyers are in control of price but not yet of volume. OBV sits in negative territory near –389,970, and the first level it must reclaim is 70,960. Clearing that level and then the next band at 583,600 would mark a proper higher-high formation.
It would then confirm a volume-supported reversal on the one-hour chart.
 Buyers Gaining Control:
TradingView
Buyers Gaining Control:
TradingView
A possible IRYS airdrop distribution earlier could also explain the initial negative OBV print, as early holders likely claimed and sold small amounts.
Together, VWAP and OBV show the full picture. VWAP tells us where most trading took place, but OBV shows who is actually controlling that volume. Right now, price is holding above VWAP, but OBV still lags. That is why the next move depends on whether volume flows back to buyers.
Key Levels Show a Wide Early Range for IRYS Price
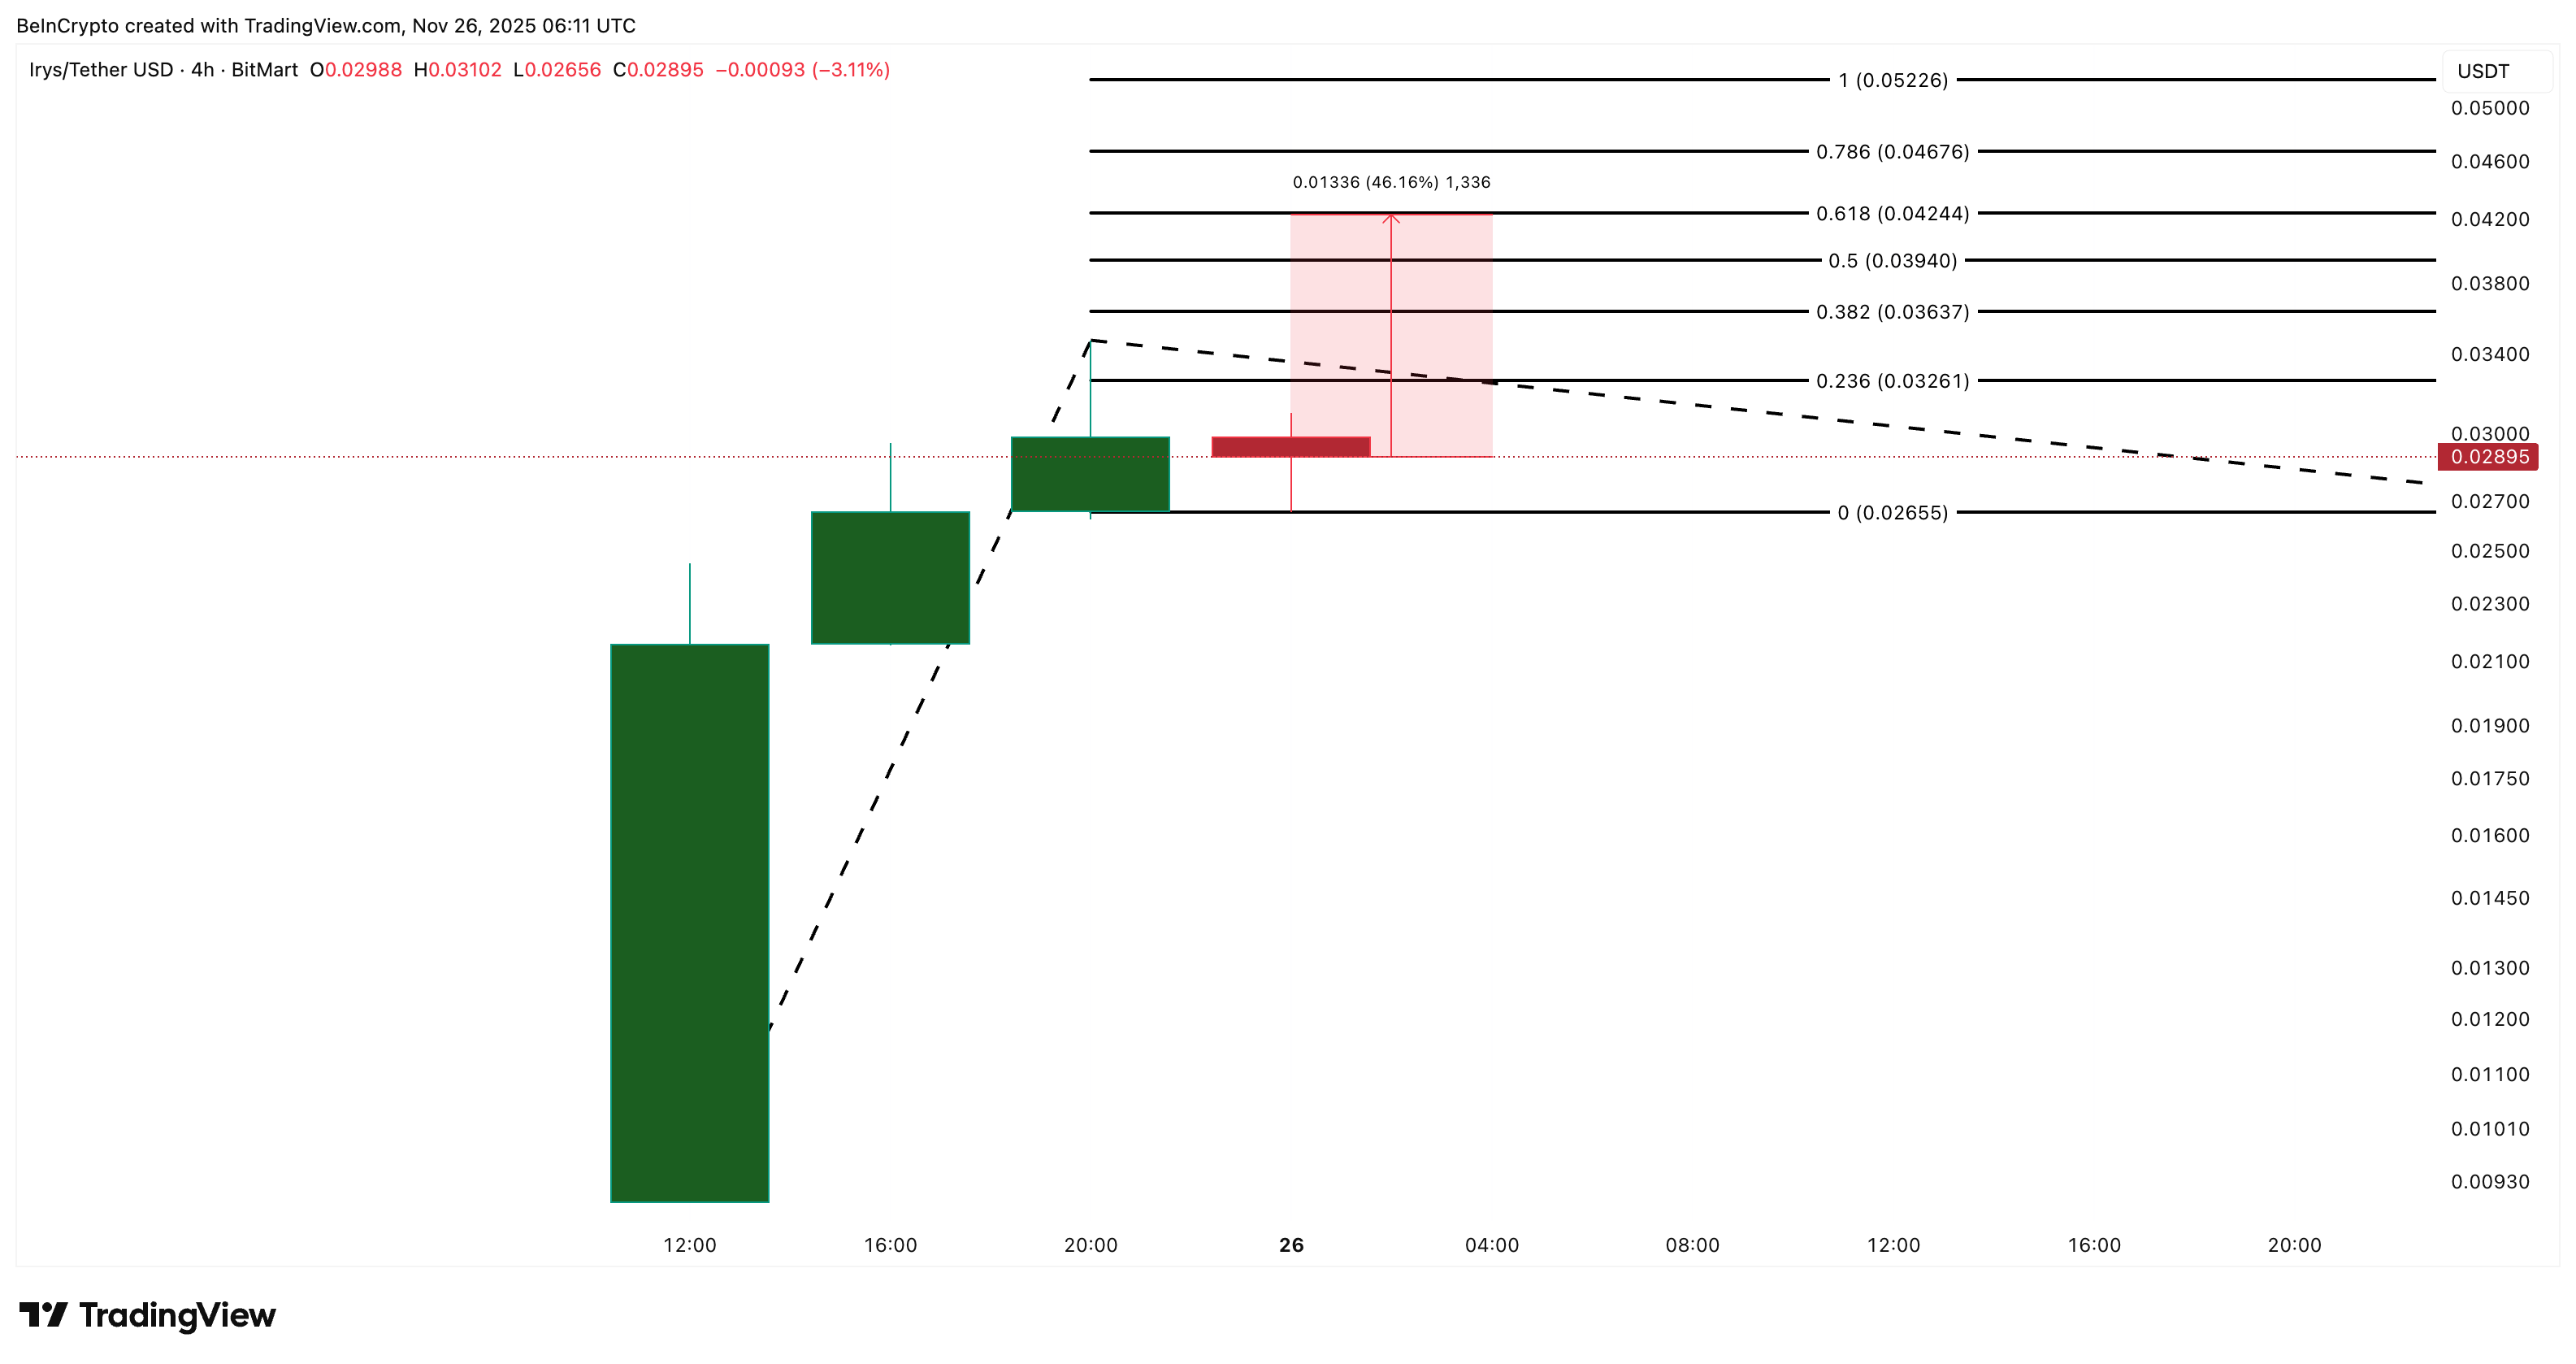
The 4-hour IRYS price chart shows a fresh trend-based Fibonacci layout. The immediate upside level is $0.032, followed by $0.039 and the strongest early resistance at $0.042. This last zone sits near the 0.618 Fib, often the level where early listings find their first real sell wall.
If momentum strengthens, $0.052 remains the top extension for the first leg.
 IRYS Price Analysis:
TradingView
IRYS Price Analysis:
TradingView
But this requires OBV strength and a VWAP-supported expansion, not just isolated green candles.
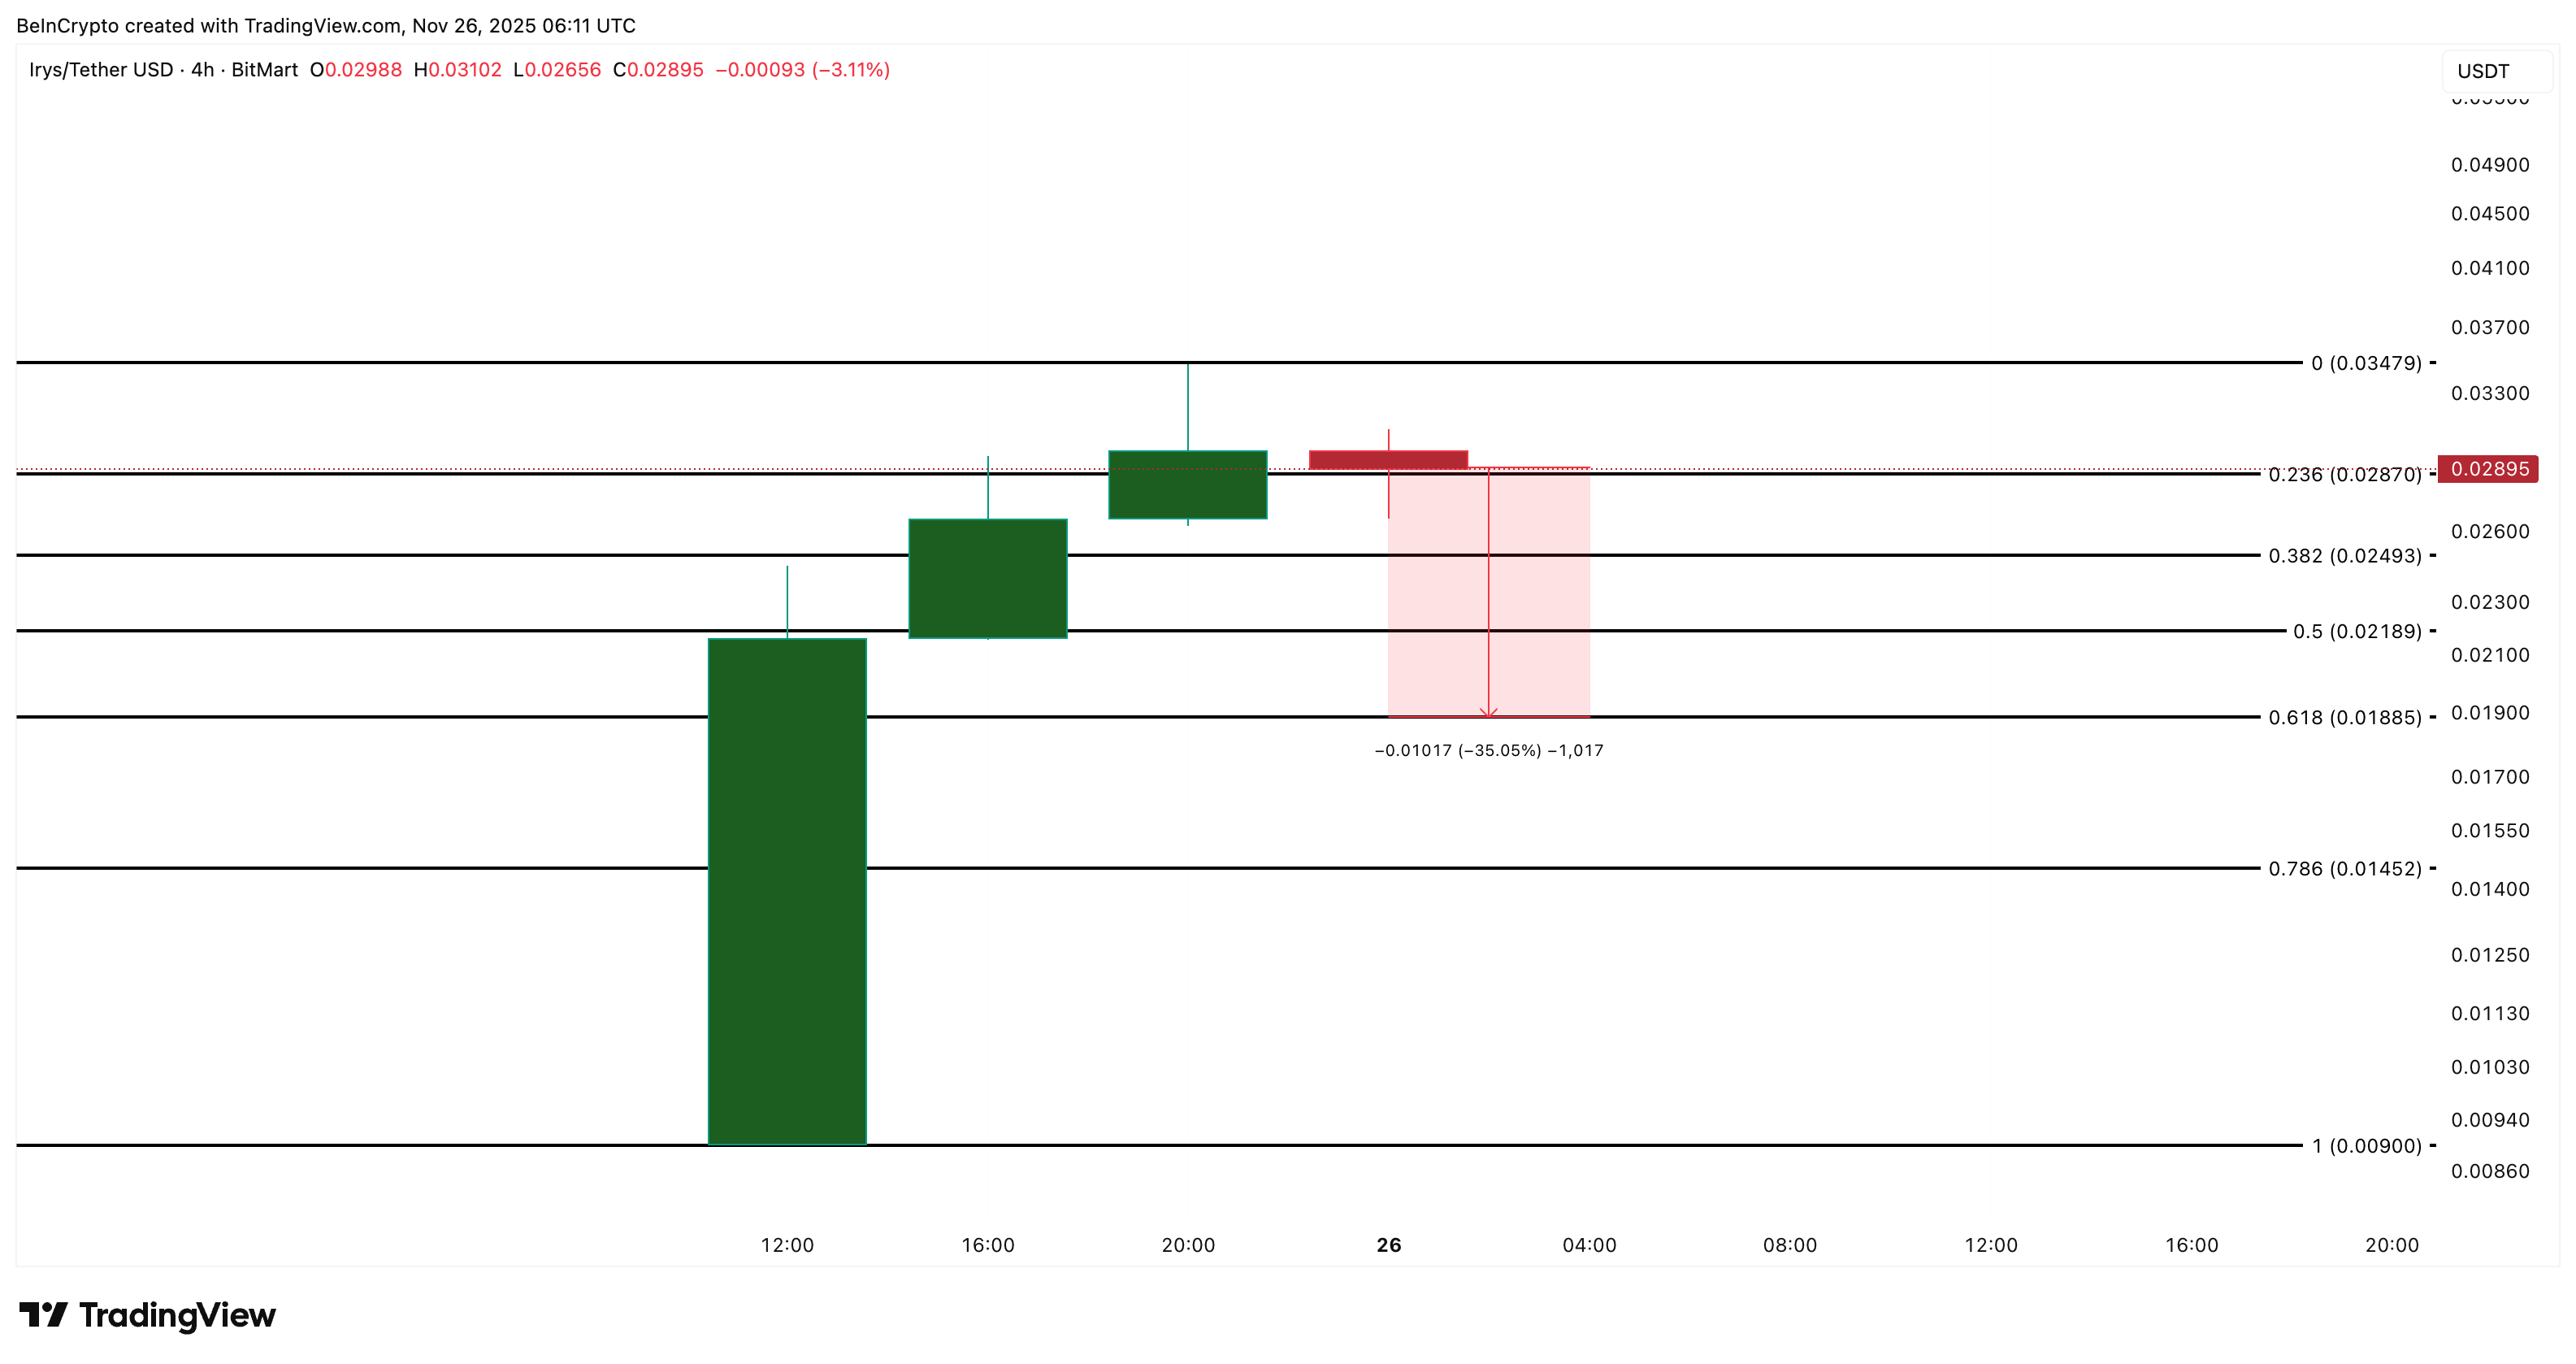
On the downside, the key support sits at $0.024, with deeper support at $0.018, followed by $0.014. A break below $0.018 even exposes $0.009. That would signal that the first post-launch IRYS price phase is turning into a full retracement.
However, that would mean that OBV might have broken down its ascending trendline, highlighted earlier on the 1-hour chart.
 IRYS Price Analysis (Downside Projection):
TradingView
IRYS Price Analysis (Downside Projection):
TradingView
Right now, Irys trades in the middle of this wide band, and both outcomes remain possible. VWAP support and OBV improvement would open the upside. However, fading volume and a break under $0.018 would shift control to sellers.
Read the article at BeInCryptoDisclaimer: The content of this article solely reflects the author's opinion and does not represent the platform in any capacity. This article is not intended to serve as a reference for making investment decisions.
You may also like
The Growing Importance of Education in Influencing Future Workforce Developments and Investment Prospects
- Education and employment are converging as tech, healthcare , and renewable energy reshape workforce demands, prompting universities to overhaul curricula with AI, data science, and digital skills. - Investors are capitalizing on AI-driven edtech platforms and healthcare AI diagnostics, with U.S. edtech funding surging to $2.9B in 2024, reflecting growing demand for tech-savvy professionals. - Renewable energy’s $623B 2023 investment boom highlights skilling initiatives like ComEd’s Power Up Academy and

HYPE Token Price Fluctuations and Institutional Attitudes in the Crypto Market: Weighing Immediate Risks Against Future Opportunities
- HYPE token's 2025 price swings ($24.51-$57.38) highlight crypto's short-term volatility driven by whale activity, token unlocks, and market jitters. - Hyperliquid's 70-80% DEX futures market dominance stems from 90% fee cuts, $47B weekly volumes, and partnerships with BlackRock/Stripe for USDH stablecoin. - Institutional adoption via 21Shares' SEC ETF proposal and $1B treasury buybacks aim to stabilize HYPE, though regulatory uncertainty remains a key risk. - Analysts project $30-$60 stabilization by 202

Exploring New Challenges in Cryptocurrency Portfolio Management
- 2025 crypto landscape balances innovation with rising token scams, driving stricter regulatory enforcement and operational safeguards. - DOJ/SEC actions against fraudsters like Roger Ver and ByBit hackers, plus UK FCA sandboxes, highlight global accountability trends. - Blockchain analytics tools (TRM Labs, Chainalysis) enable real-time AML/KYC compliance and $2.17B+ stolen fund recovery through AI-driven monitoring. - FINRA/Georgetown and university programs build crypto literacy, while Kryptosphere-Del
COAI Price Reduction and Its Impact on Clean Energy Markets
- COAI Index's 88% November 2025 drop exposed crypto AI and clean energy market vulnerabilities, triggered by C3.ai's leadership crisis and $116.8M Q1 loss. - Regulatory ambiguity from the CLARITY Act and corporate governance failures forced capital flight to stable AI infrastructure stocks like Celestica (5.78% weekly gain). - U.S. clean energy investment fell 36% in H1 2025 due to policy uncertainty, contrasting with Europe's $30B offshore wind surge amid Trump-era fossil fuel/nuclear shifts. - CCUS, blu