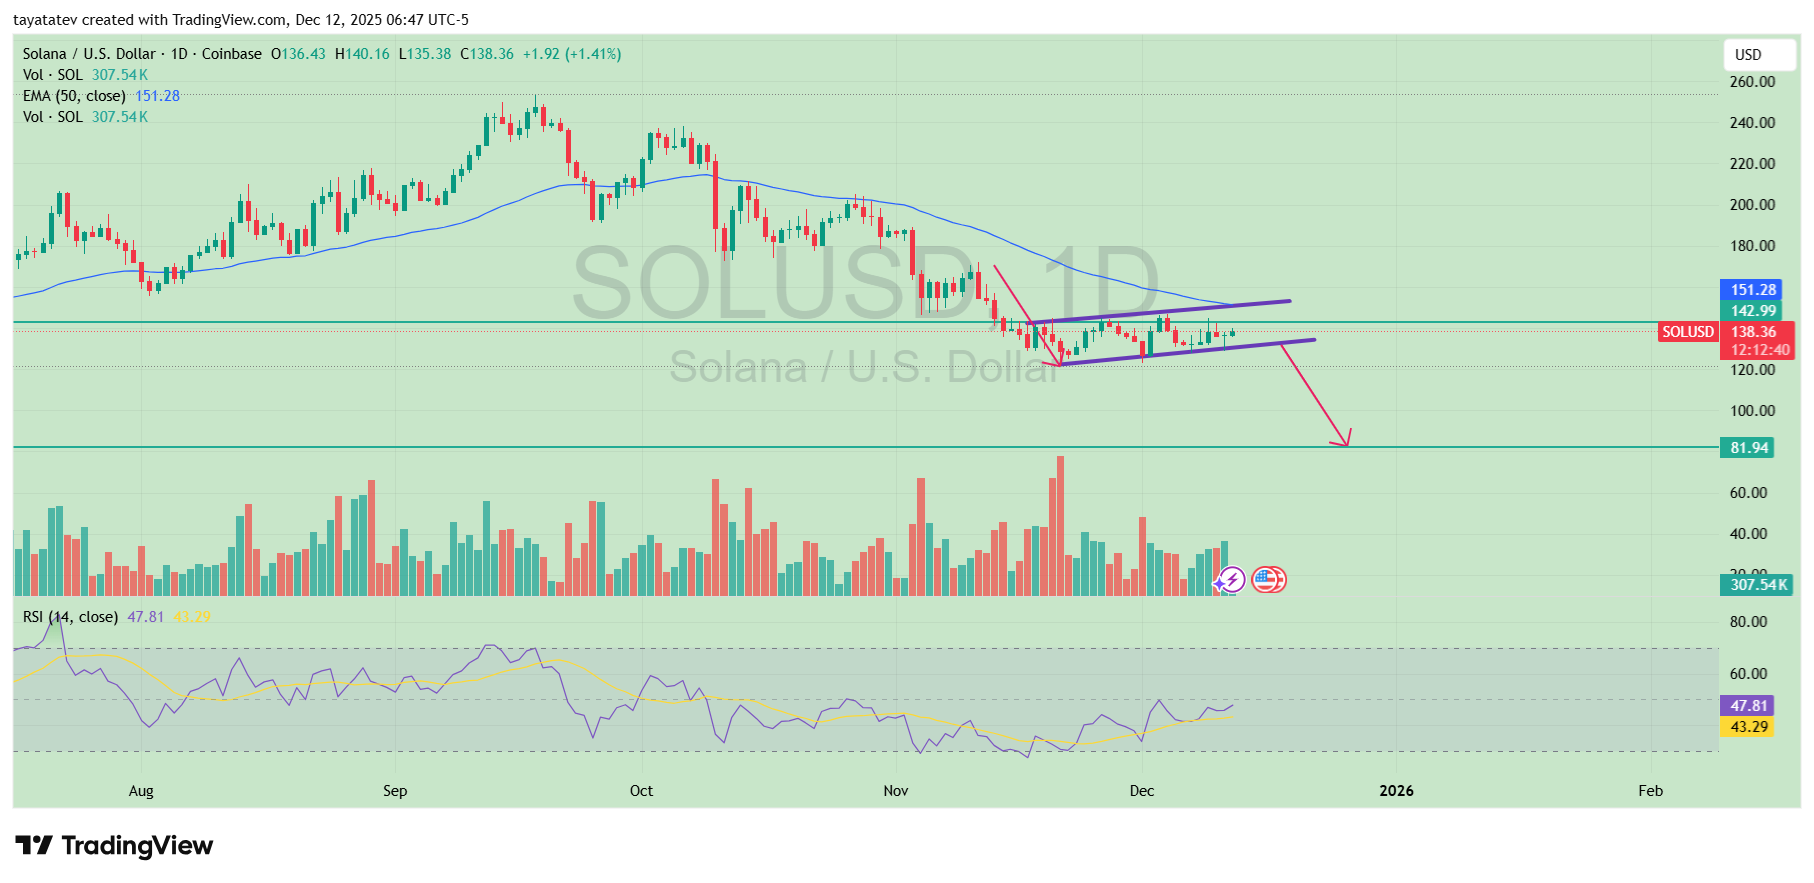
SOLUSD has formed a bearish flag pattern. A bearish flag forms after a sharp drop, then price drifts higher inside a tight rising channel, and the pattern points to another leg down if support breaks.
 Solana Bearish Flag Pattern Breakdown. Source: TradingView
Solana last traded near $138.36 on the 1D Coinbase chart, after printing $140.16 as the session high and $135.38 as the low. Earlier, the market sold off from the September peak zone and then began compressing into a narrow, upward sloping range marked by the two rising trendlines.
However, price still sits below the 50 day EMA near $151.28, while the chart also shows a nearby horizontal level around $142.99 above the market. That setup keeps overhead pressure in place, even as candles grind sideways into early December.
Momentum also looks muted. The 14 day RSI sits near 47.81, which keeps it below the midpoint, and the recent rebound has not pushed RSI back into a stronger bullish zone. Meanwhile, volume remains uneven, which fits a consolidation phase rather than a clean breakout.
If the bearish flag confirms with a breakdown from the flag support, a 5% drop from the current $138.36 level targets about $131.44. After that, the chart’s next major downside reference remains the deeper horizontal support near $81.94, although the 5% move would come first if the breakdown triggers.
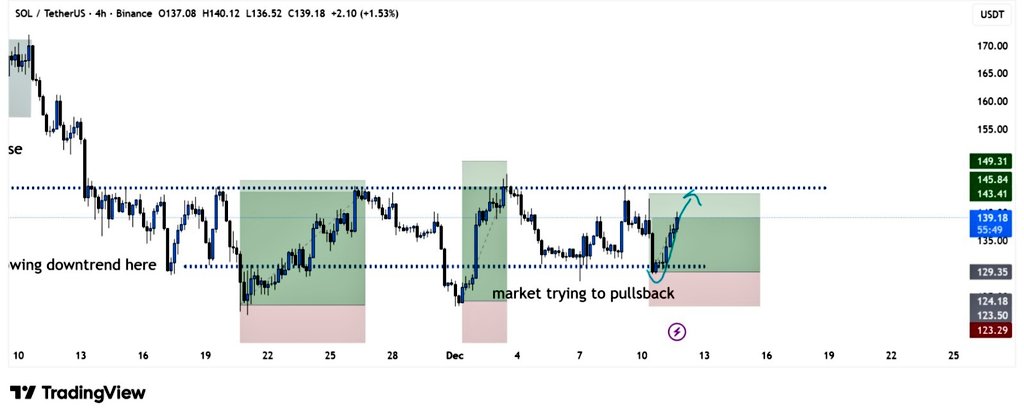
Solana price attempts rebound after downtrend as buyers defend support
Meanwhile, SOLUSDT is attempting a rebound after a prolonged downtrend, with price reacting from a clearly defined support zone on the 4 hour Binance chart. Solana last traded near $139.18, after bouncing from the $129.35 to $123.29 support area, where buyers stepped in following repeated sell offs.
 Solana Pullback and Resistance Test. Source: TradingView / X
The chart shows that price previously moved lower in a steady downtrend, then shifted into a pullback phase as selling pressure eased. This rebound formed after multiple reactions from support, signaling that downside momentum weakened in the short term. As a result, candles pushed back into the middle of the recent range.
However, price now approaches a key resistance band between $143.41 and $149.31, which capped prior upside moves. That zone aligns with earlier breakdown levels, meaning sellers may reappear if momentum fades. For now, the structure shows buyers testing control, but confirmation depends on whether price can hold above the $135.00 area and sustain strength into resistance.
Solana faces overhead supply as chart highlights sell wall near $163
SOLUSD is trading near $139.55 on the 4 hour Coinbase chart as price pushes into a clearly defined resistance zone. The structure shows a recovery from the $124–$126 support area, where buyers previously stepped in after a sharp downside move earlier this month.
 Solana Sell Wall Near $163. Source: TradingView / X
Since then, price has moved higher in a series of short rebounds, but each advance has stalled below overhead supply. The chart marks a heavy resistance band between $142 and $147, which aligns with prior breakdown levels and repeated rejections. This area continues to cap upside momentum and keeps price rotating sideways.
According to the chart, the next major sell wall sits much higher, near $163, where sellers previously defended aggressively. That level acted as a distribution zone during the earlier decline and now stands as a broader upside barrier if price manages to clear nearer resistance first.
For now, Solana remains range bound. Buyers control the short term bounce from support, but sellers still dominate the upper zones. A sustained move above the $147 area would be needed to open the path toward the $163 sell wall, while failure to hold current levels risks another pullback toward the mid range support.

Editor at Kriptoworld
LinkedIn | X (Twitter)
Tatevik Avetisyan is an editor at Kriptoworld who covers emerging crypto trends, blockchain innovation, and altcoin developments. She is passionate about breaking down complex stories for a global audience and making digital finance more accessible.
📅 Published: December 12, 2025 • 🕓 Last updated: December 12, 2025