
News
Stay up to date on the latest crypto trends with our expert, in-depth coverage.

1Bitget UEX Daily|US-Iran Talks Renewed Differences, Oil Prices Jump Again; Google in Talks with Marvell to Develop New AI Chips (2026-04-20)2April 20 Financial Morning Brief: U.S. and Iran Accuse Each Other of Attacking Ships, Strait of Hormuz Closed Again, Gold Price Battles at 4750 Level, Oil Price Rebounds Nearly 7%3A "high sensitivity week" arrives for global markets! US-Iran negotiations, Walsh hearings, and a wave of global data set to make an impact

USD/JPY: Credibility risks lift upside scope – OCBC
101 finance·2026/04/20 11:51
Analyst View on Gold Price | Repeated Middle East Tensions and New Fed Concerns
新浪财经·2026/04/20 11:33
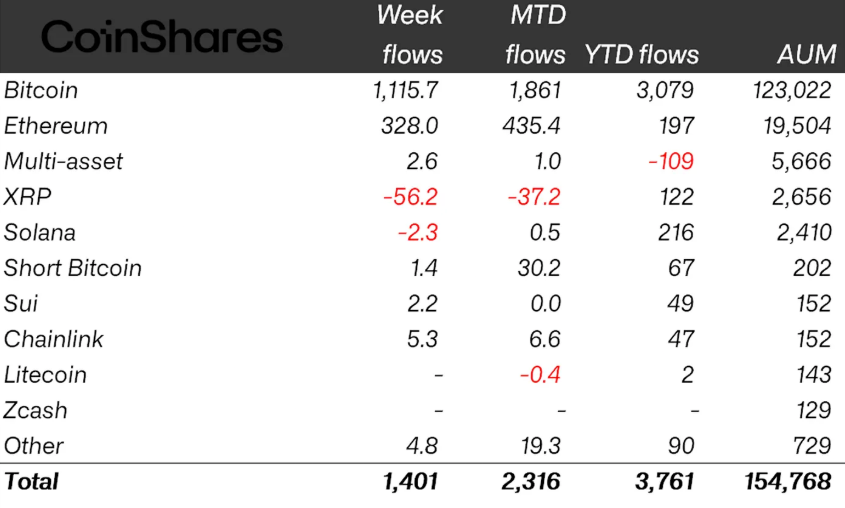
Crypto fund inflows hit $1.4B in second-strongest week since January
Cointelegraph·2026/04/20 11:15
MERL (MerlinChain) rebounds over 40% from its low in 24 hours: trading volume surges driven by BTCL2 popularity
Bitget Pulse·2026/04/20 10:50
April 22 is approaching, can the gold technical bottom still hold?
汇通财经·2026/04/20 10:47
Fed: Leadership clash raises market risk – DBS
101 finance·2026/04/20 10:39
Janction (JCT) fluctuated 42.1% in 24 hours: Volume surge and leveraged futures speculation drive volatility
Bitget Pulse·2026/04/20 10:27
Charles Schwab Launches Spot Crypto Trading for Retail Clients
Coinspaidmedia·2026/04/20 10:12
SPK (Spark) fluctuated by 40.4% in 24 hours: trading volume surged nearly 200%, driving a price rebound
Bitget Pulse·2026/04/20 10:06
Flash
11:47
Southern Crude Oil LOF: Trading will be suspended from market opening until 10:30 on April 21According to Golden Ten Data on April 20, Southern Crude Oil LOF announced that recently, the Southern Fund Management Co., Ltd.'s Southern Crude Oil Securities Investment Fund Class A fund shares have experienced significant price fluctuations in the secondary market. Investors are advised to closely monitor the net asset value of the fund shares. On April 16, 2026, the net asset value per share of this fund was 1.7340 yuan, and on April 20, 2026, the closing price of this fund in the secondary market was 2.135 yuan, which is significantly higher than the net asset value per share as of April 16, 2026. Investors are hereby reminded to pay attention to the premium risk of secondary market trading prices. Investing blindly in fund shares with high premiums may result in significant losses. In order to protect the interests of investors, trading of this fund will be suspended from the market open on April 21, 2026 until 10:30 (UTC+8) on the same day, and trading will resume at 10:30 (UTC+8) on April 21, 2026.
11:46
On-chain whale transactions and inflows of AAVE surgeAccording to Santiment data, AAVE-related whale transactions (over $100,000) surged from 2-6 per hour to 43 in the 90 minutes following the Kelp exploit. Exchange inflow increased from about $38,000 to $3 million, peaking at $8.5 million on Saturday afternoon. Meanwhile, the sentiment balance index dropped to -15, 10 times the month's lowest value. The exploit occurred at 17:35 (UTC), with on-chain activity responding rapidly.
11:40
Golden Ten Futures HeatmapUnder the strong “anti-involution” expectations, polysilicon hit the upper limit with a strong rally today! Looking back in history, how many times has it hit the upper or lower limit? What similarities can be found in the driving factors behind each extreme market movement? See it all in one chart.
News