
News
Stay up to date on the latest crypto trends with our expert, in-depth coverage.


India Gold price today: Gold rises, according to FXStreet data
FXStreet·2026/05/05 05:00
Australian Dollar remains subdued despite RBA rate hike
FXStreet·2026/05/05 05:00
DTCC lines up 50 giants for tokenized securities launch
Crypto.News·2026/05/05 04:57

Prediction Market Traders Push April 2026 Volume to $8.6B, Kalshi Takes the Lead
CryptoNewsNet·2026/05/05 04:48
Tsla
TradingView·2026/05/05 04:48
Amd - This stock still remains bullish!
TradingView·2026/05/05 04:45
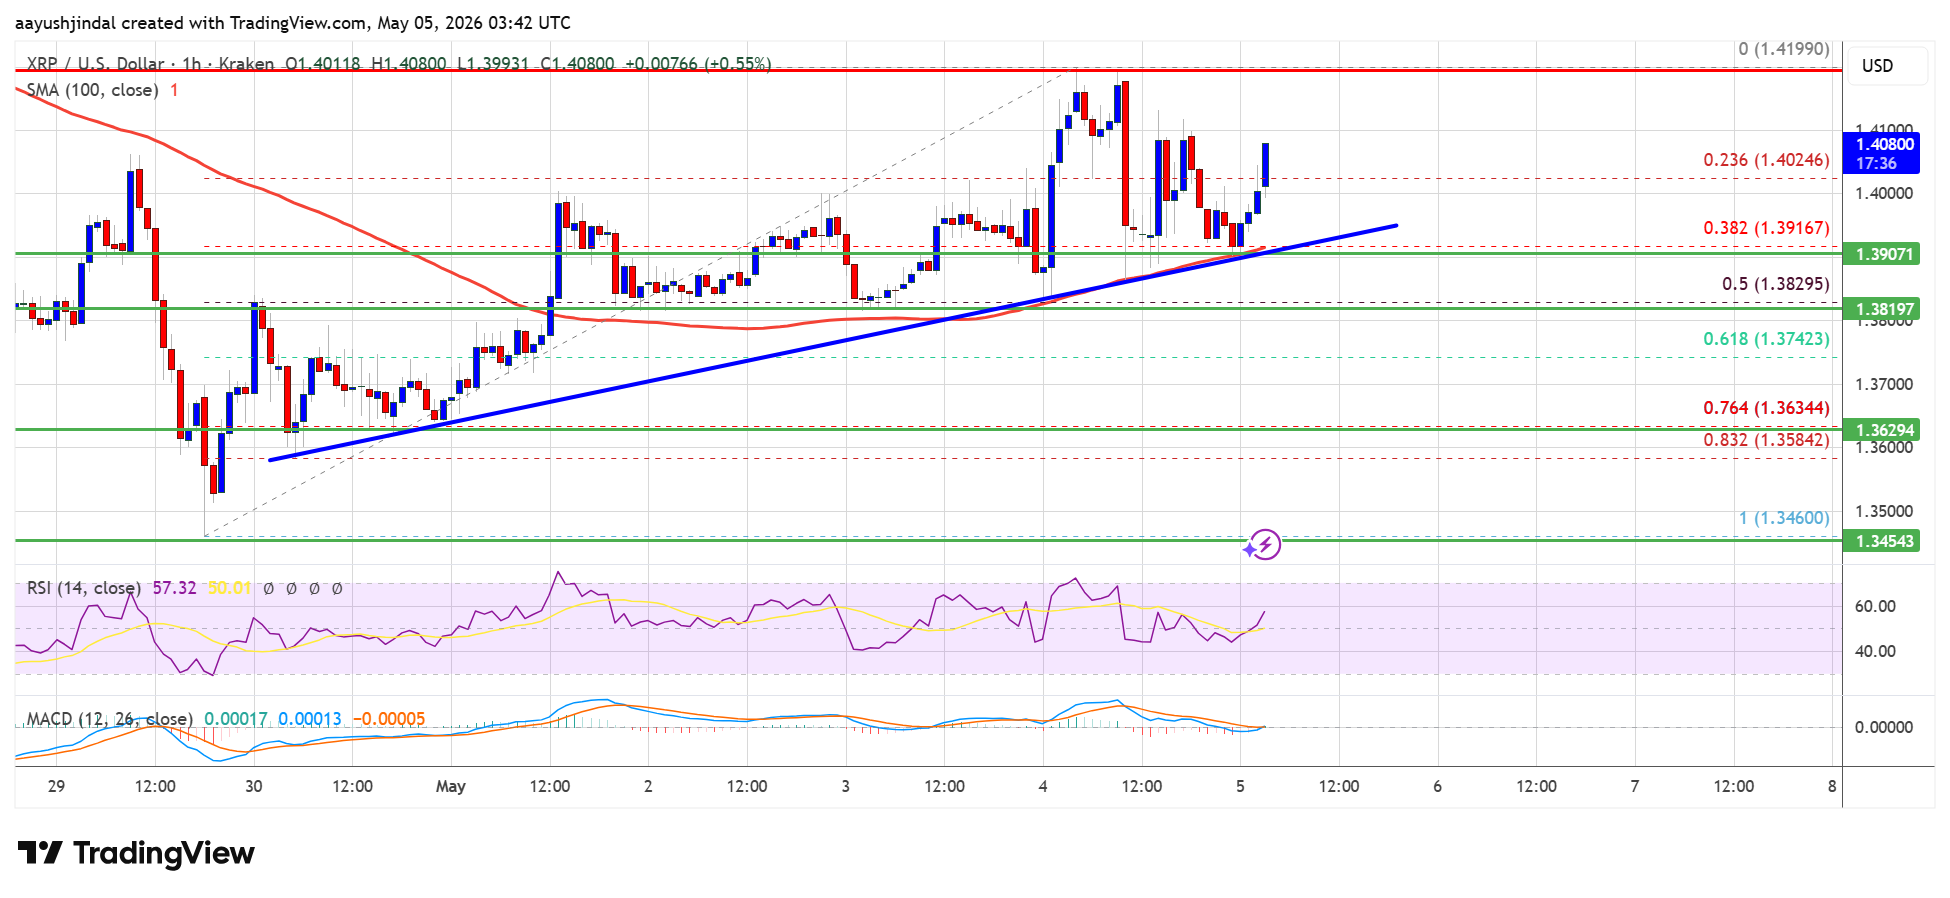
XRP Price Advances, Can It Sustain Fresh Upside Momentum?
Newsbtc·2026/05/05 04:42
Crypto Spring Has Officially Begun, Says Bitmine’s Tom Lee
BeInCrypto·2026/05/05 04:42

Dogecoin jumps 5 percent as price eyes $0.18 target
Cointurk·2026/05/05 04:30
Flash
07:41
The more MU is sold, the higher it rises—who is buying behind the scenes?The 15-minute "Footprint Chart" shows that during MU's rebound, several candlesticks presented negative Delta, with aggressive selling continuously dominating, yet the price did not fall and instead kept rising. According to PRO's "Main Large Order Tracking," a total of over 10.5 million USD in limit buy orders appeared in two key zones during the session. Among them, between 12:05 and 13:05, 8.916 million USD of sell orders were absorbed by major players, and from 14:35 to 14:55, another 1.597 million USD of sell orders were absorbed. This indicates that while there seems to be selling pressure on the surface, there is even greater capital consistently absorbing these sales, thus continually digesting the sell pressure. For traders, rising prices aren't surprising—the real value lies in identifying who is driving the price increase. Through PRO's "Footprint Chart" and "Main Large Order Tracking," one can not only see trades executed, but also judge whether major players are accumulating, distributing, or creating fake-outs, thus understanding market moves from a capital-flow perspective. Next, focus should be on whether the absorbing buy orders continue to stay in the market, and on whether the overhead selling pressure can be further digested.
07:38
Data: Bitcoin net realized profit and loss has been negative for five consecutive months, with $48,000 to $56,000 as the core support rangeChainCatcher reports that CryptoQuant analyst Axel Adler Jr. published a report stating that the realized net profit and loss of Bitcoin (90-day MA) has been negative for the fifth consecutive month, with the current reading at -203.2 million US dollars. This means the market is systematically locking in losses, consistent with the early stages of previous bear market cycles. However, the cost basis of holder groups shows that the core support lies in the $48,000–$56,000 range. Looking at the cost basis for each group: whales (10,000 coins or more) at $48,100, small addresses (10–100 coins) at $47,800, large wallets (1,000–10,000 coins) at $56,500—all remain below the current price. Only the 100–1,000 coins group ($65,700) is in a loss position and is the main source of current loss selling. Adler notes that this contrasts with the full capitulation of 2022—at that time, almost all groups fell below their cost basis. The current market is experiencing a controlled decline rather than capitulation. The main risk is breaking below the $48,000–$56,000 support range; if this range is lost, more holders will be pushed into losses, opening up deeper downside potential.
07:35
Nikkei 225 Index experiences the third largest historical dropJinse Finance reported that, affected by the decline in major U.S. tech stocks the previous day, Japanese stocks—which had reached record highs the day before—experienced profit-taking sell-offs.