

Date: Sat, May 31, 2025 | 02:25 PM GMT
The cryptocurrency market witnessed a sharp pullback over the past 48 hours, dragging major tokens into the red. Bitcoin (BTC) briefly dropped to around $104K, while Ethereum (ETH) slipped to $2,500, down from recent highs of $111K and $2,700 respectively. This broad correction impacted many altcoins —including Bitget Token (BGB).
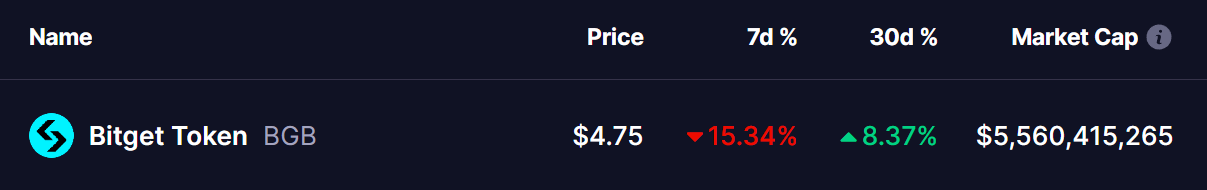
While BGB is showing a modest weekly decline of over 15%, but technical setup suggest that the dip may only be temporary. In fact, a recent breakout followed with ongoing retest could be signaling the early stages of a bullish continuation.
 Source: Coinmarketcap
Retesting Symmetrical Triangle Breakout
BGB began its powerful upward momentum in November 2024, surging over 600% from approximately $1.10 to a high near $8.50. After the explosive rally, the token entered a prolonged consolidation phase, forming a classic Symmetrical Triangle pattern—typically considered a continuation formation in trending markets.
 Bitget Token (BGB) Daily Chart/Coinsprobe (Source: Tradingview)
On May 16, BGB decisively broke above the triangle’s upper trendline, rallying to a local high of $5.84. This breakout confirmed renewed bullish momentum. However, as is common after such moves, the price retraced, revisiting the breakout zone around $4.50. This level, now acting as support, is crucial for establishing the next leg up.
Currently, BGB is trading at $4.75, still holding above both the former resistance line and the 200-day moving average (200 MA)—now sitting at $4.66. This convergence of support zones adds weight to the idea that BGB’s recent pullback may be a healthy retest rather than a full reversal.
What’s Next for BGB?
A successful move above $5.84, the recent breakout high, would likely confirm continuation of the uptrend. If that level is cleared with volume, BGB could target $7.87 and eventually $8.50, the previous all-time high—marking a potential 79% rally from current levels.
Traders will be watching for a strong bounce from the $4.50–$4.70 zone. Losing this support decisively could delay or invalidate the bullish setup.
Disclaimer: This article is for informational purposes only and does not constitute financial advice. Always conduct your own research before making any investment decisions.