Solana (SOL) has reversed back to support, currently down 6.3% for the week so far. That said, a 7-month ascending trendline is also providing support below, and momentum indicators could soon switch positive.
A shallow reversal for $SOL, or more to come?
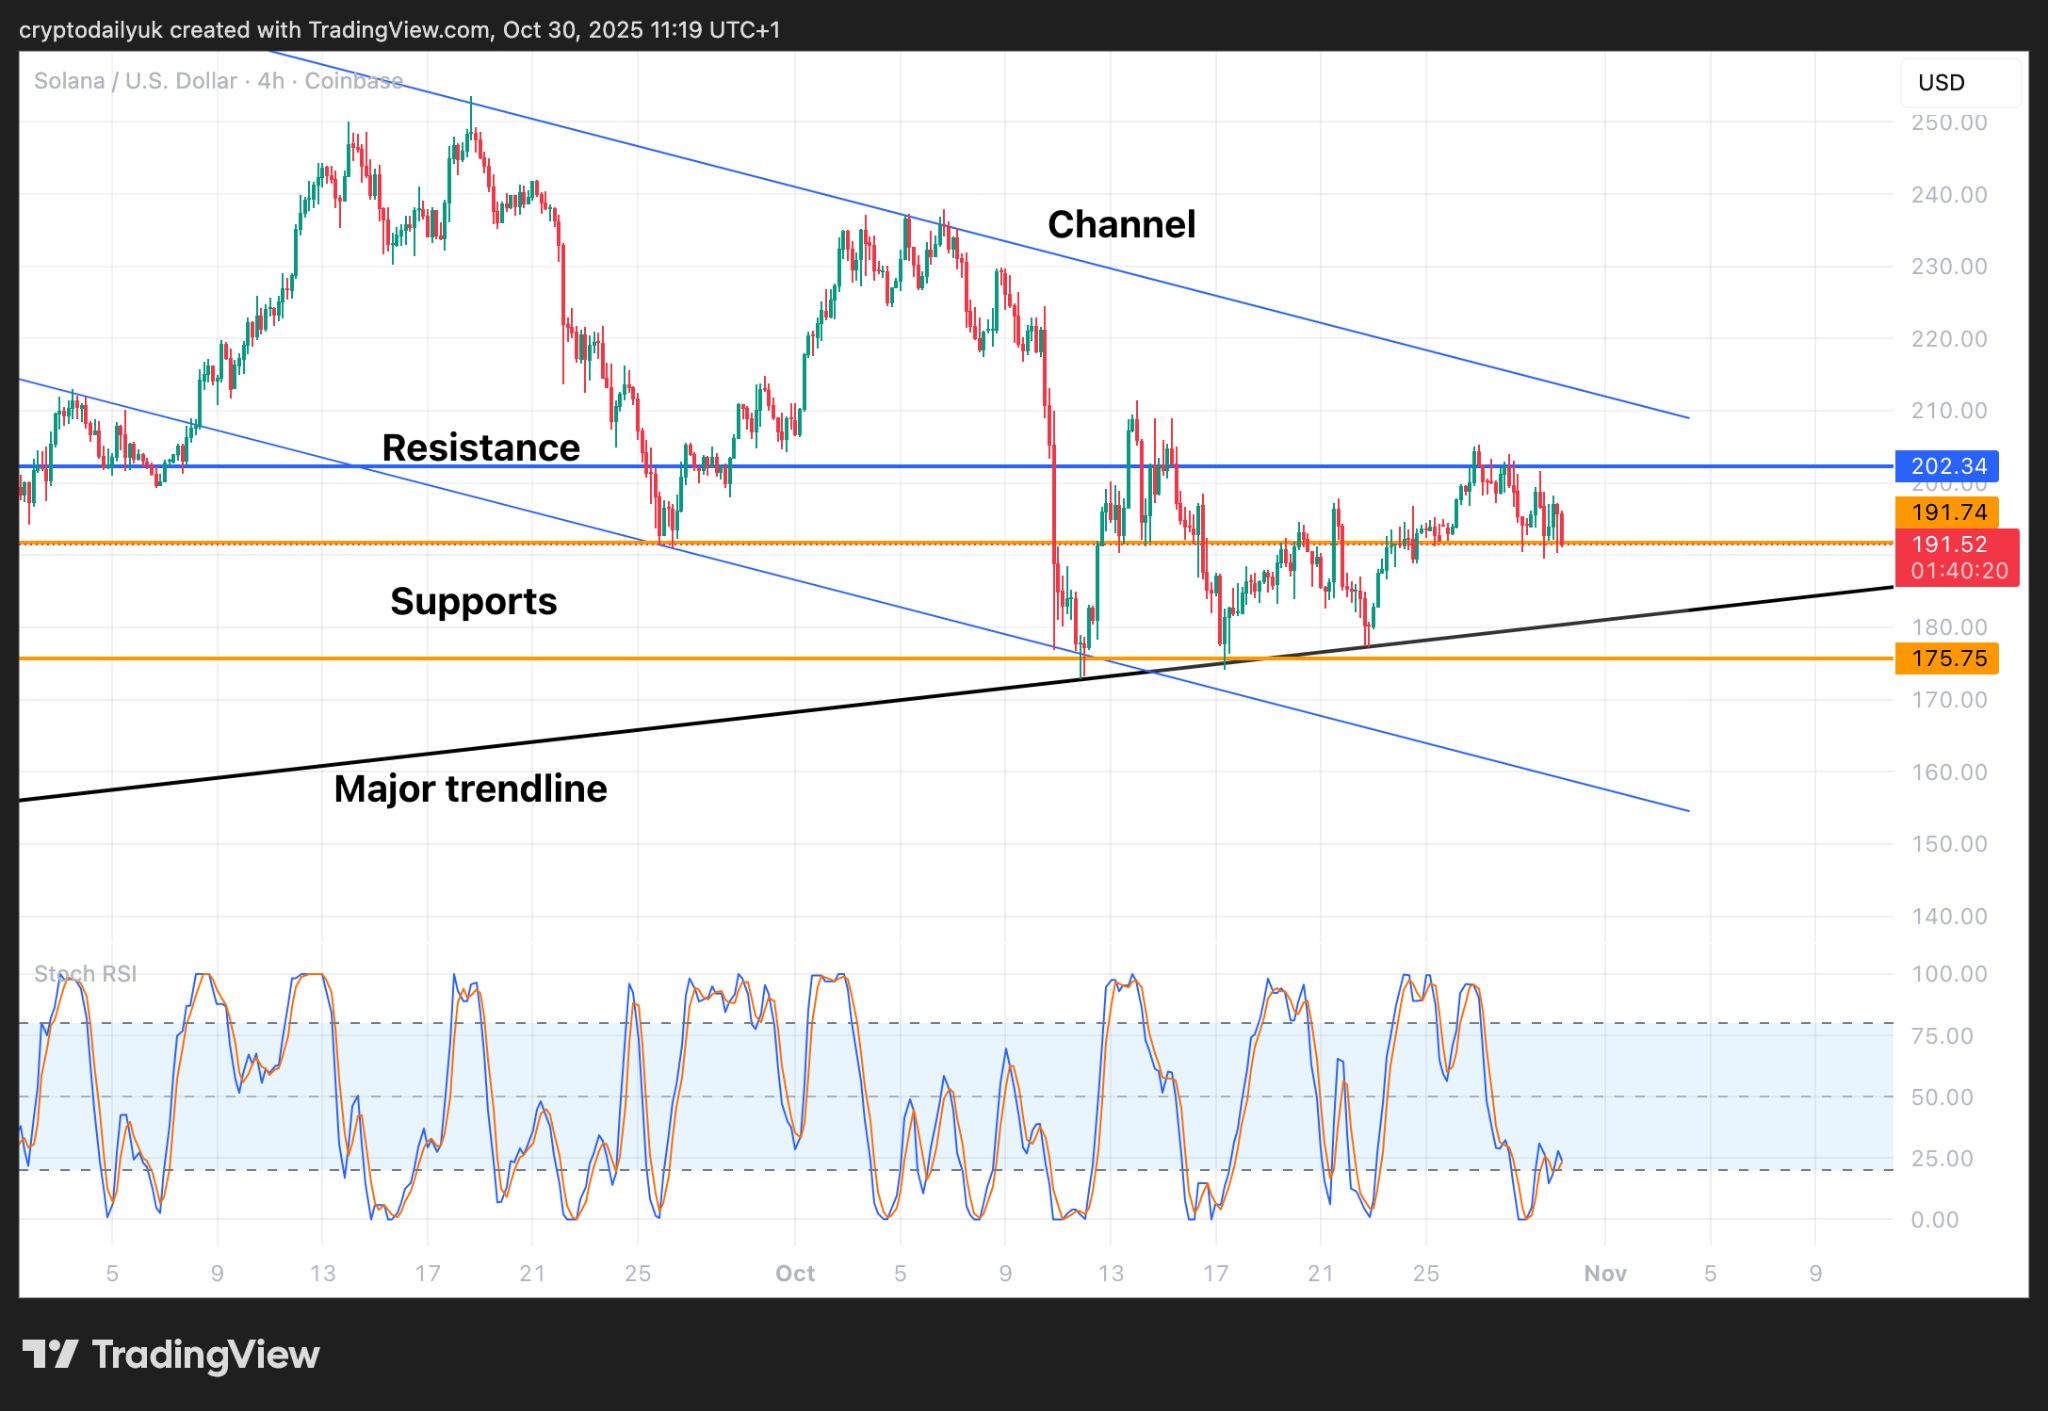
Source: TradingView
Sometimes, especially if trading the shorter time frames, it can be easy to get lost in the weeds of how the price is chopping this way and that. This is always a good time to zoom right out into the high time frames and check the trend, and the major support/resistance levels.
Before doing this, it can be seen in the 4-hour time frame that the $SOL price has come down to the $192 horizontal support level. This level has held up very well during this particular reversal phase and it might provide the next bounce. If the price does drop through, the major trendline below will be a very strong area of support. The only time to worry would be if the price fell below this and made a lower low. The bottom of the channel would be a last ditch line in the sand.
200-day SMA bolsters trendline support
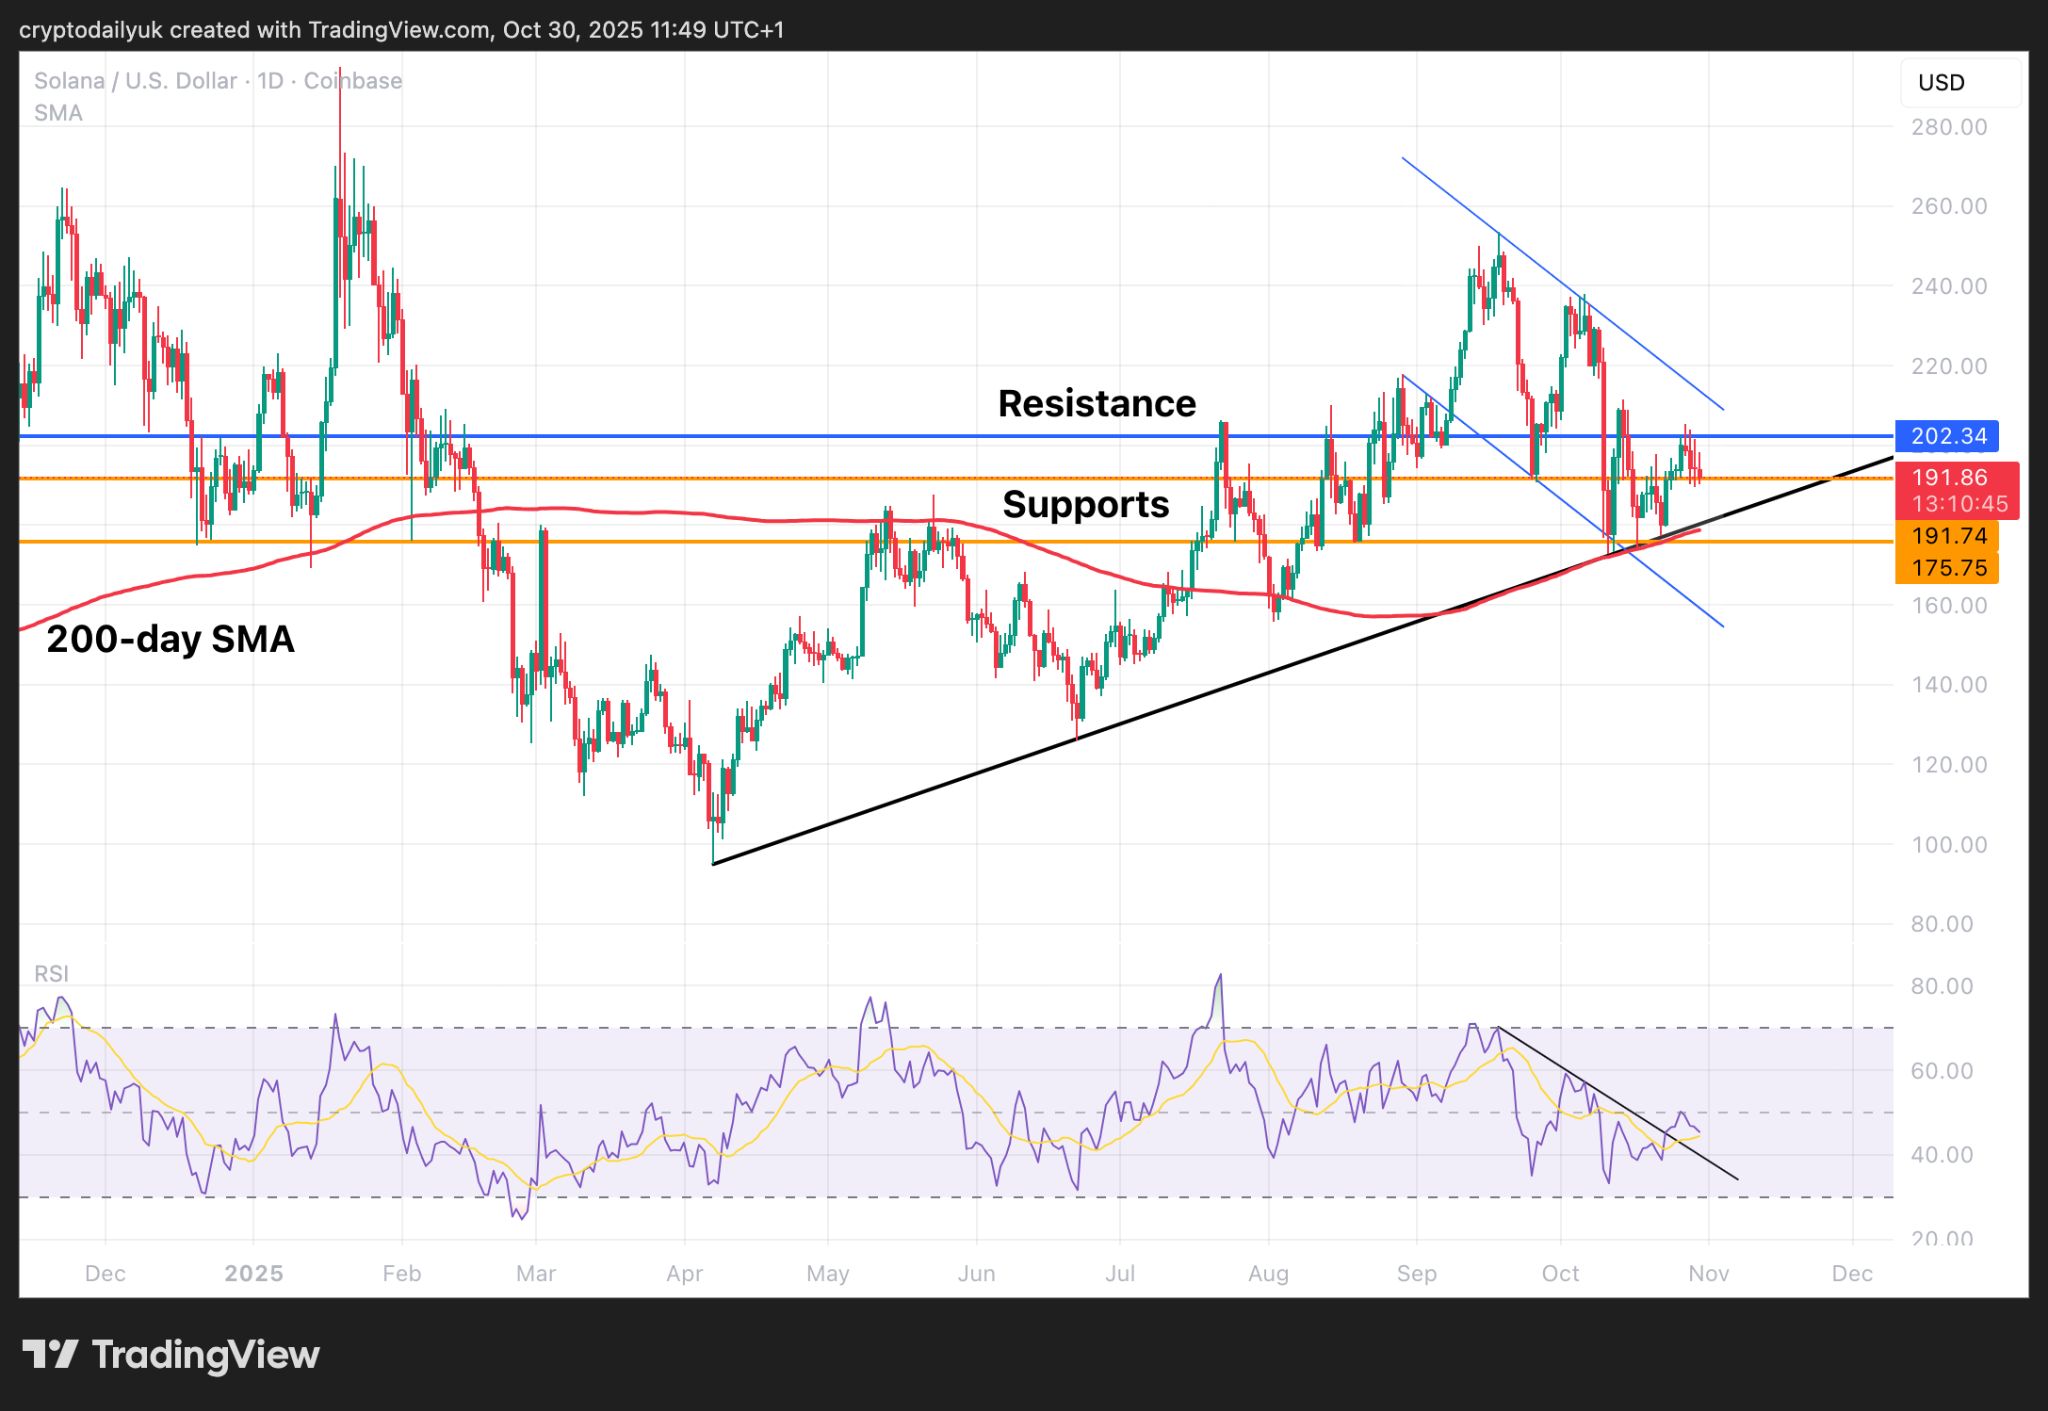
Source: TradingView
The daily chart illustrates how the 200-day SMA has been running along the major trendline, bolstering its strength as support. Looking further back in price history one can also see how important the $192 horizontal support is.
At the bottom of the chart, the Relative Strength Index shows that the indicator line has popped through the descending trendline, and that it may come back to test it as support.
$SOL set to move back to the all-time high
Source: TradingView
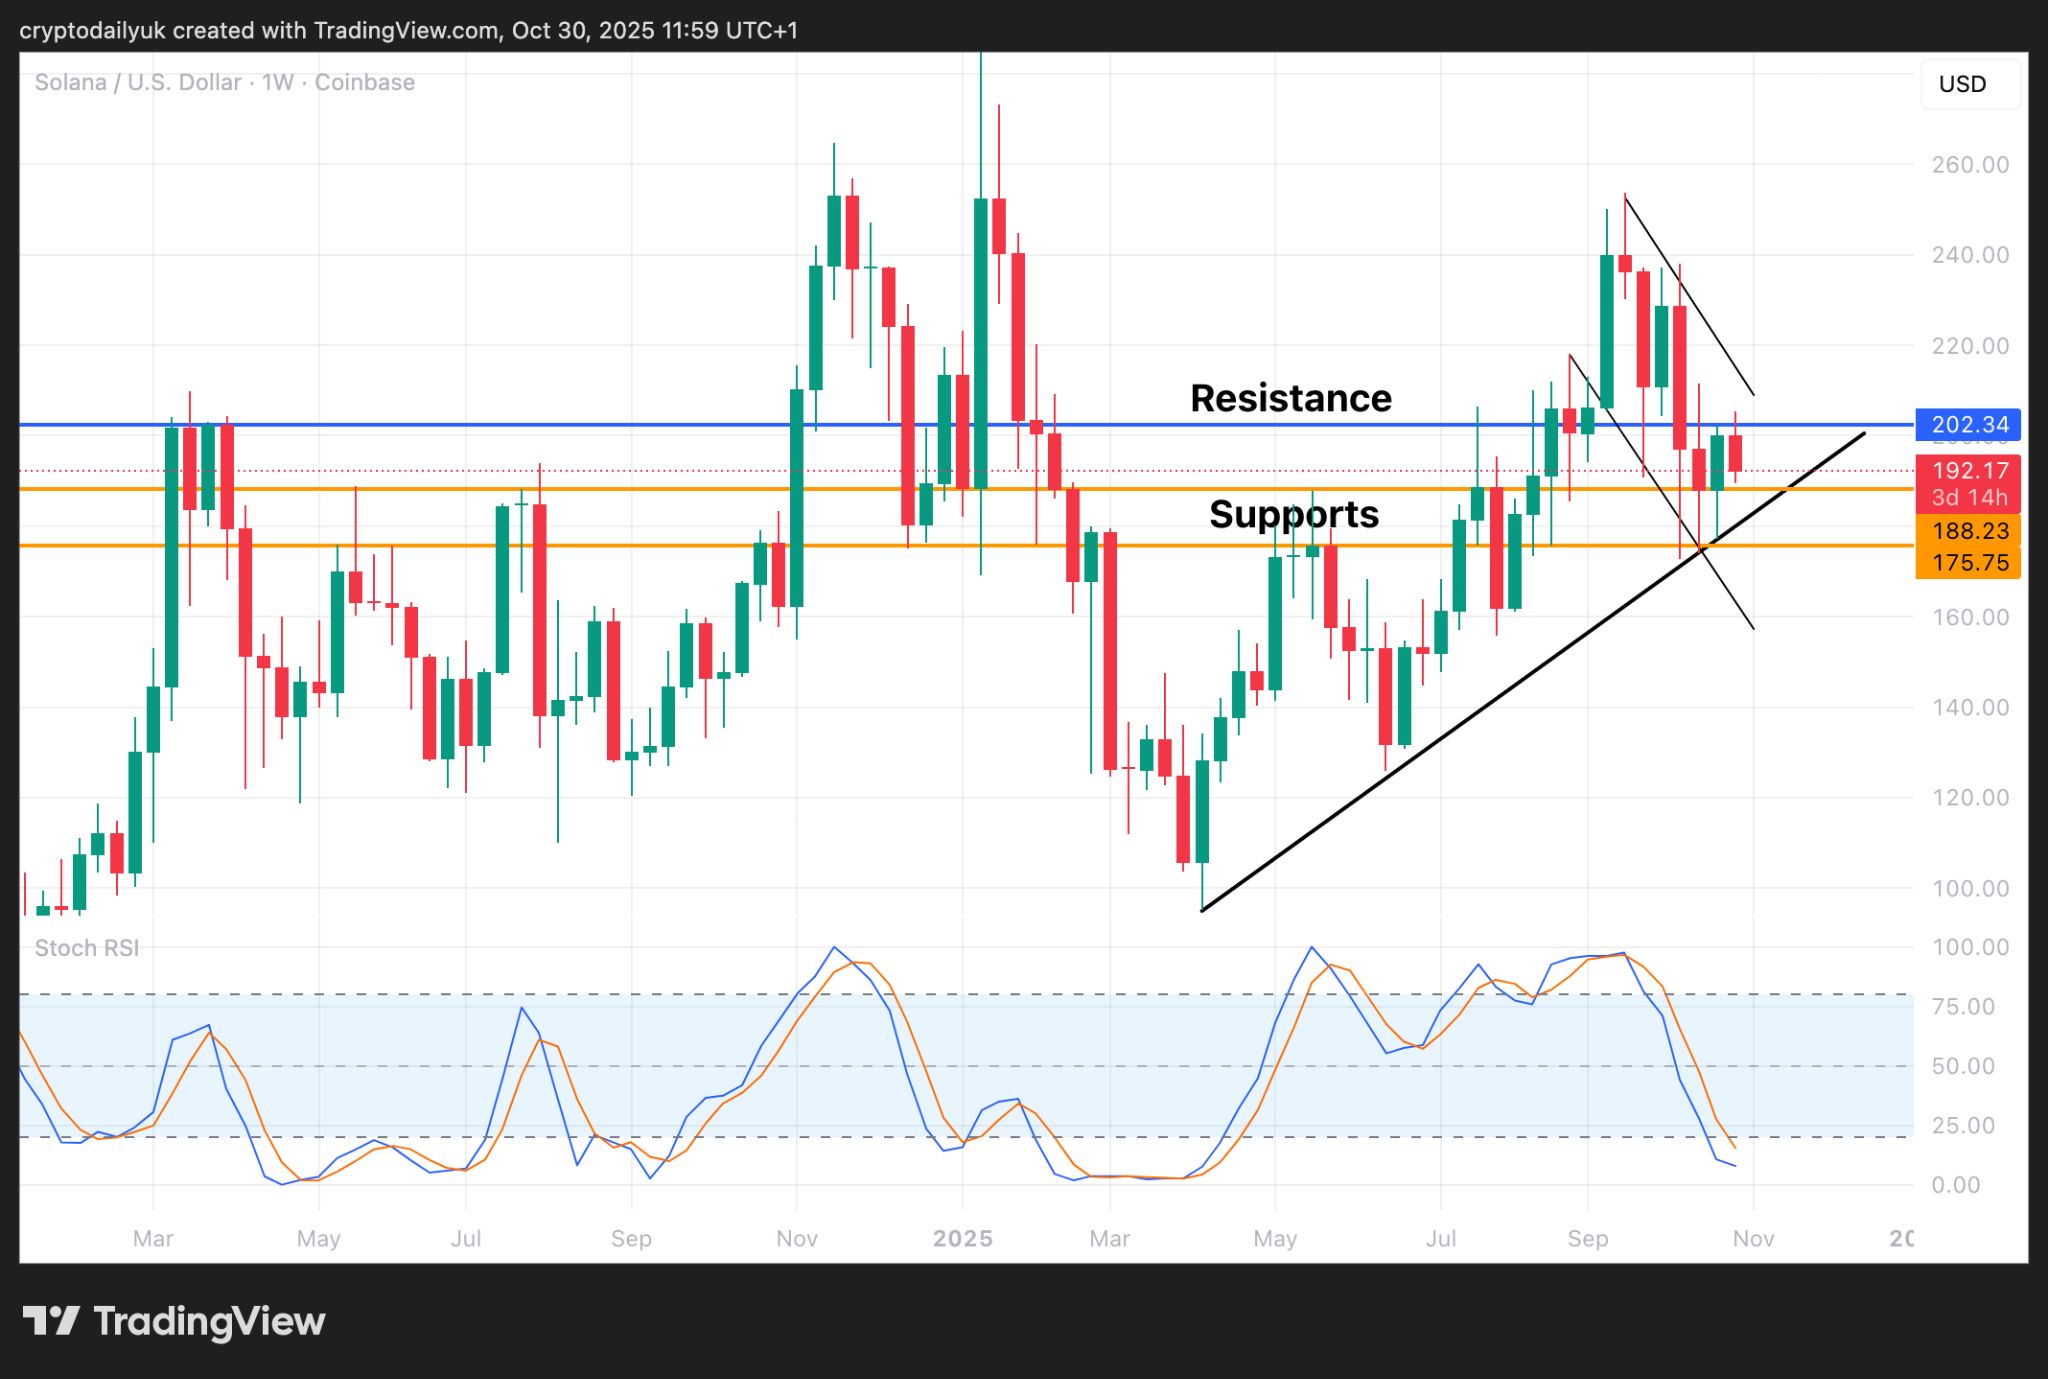
The weekly chart for the $SOL price looks quite serene as far as things stand. The price is still within the noise of the $176 up to $202 range, but once, and if, it can emerge to the upside from there, a surge to $253 could be a possibility.
With the ascending trendline holding beautifully as support, and the Stochastic RSI indicators about to bottom, everything is set for $SOL to emerge from what could be a bull flag, and head up to a new all-time high, which could be the absolute least we should expect of it going into this final stage of the bull run.