Top 3 Price Prediction Bitcoin, Gold, Silver: Charts Hint at Breakdown as US–China Truce Cools Market Fear

Bitcoin, gold, and silver are showing signs of fatigue as technical indicators flash potential breakdowns following the US–China trade truce.
Bitcoin, Gold, and Silver may be poised for a breakdown despite efforts by the bulls to push for further upside. While the digital gold and commodity safe havens are flirting with momentum, it may not be enough to secure more gains.
The US-China truce may have contributed to the potential weakness, with capital likely to rotate in the face of resolved uncertainty.
Bitcoin Eyes Breakdown As Bears Defend $112,000
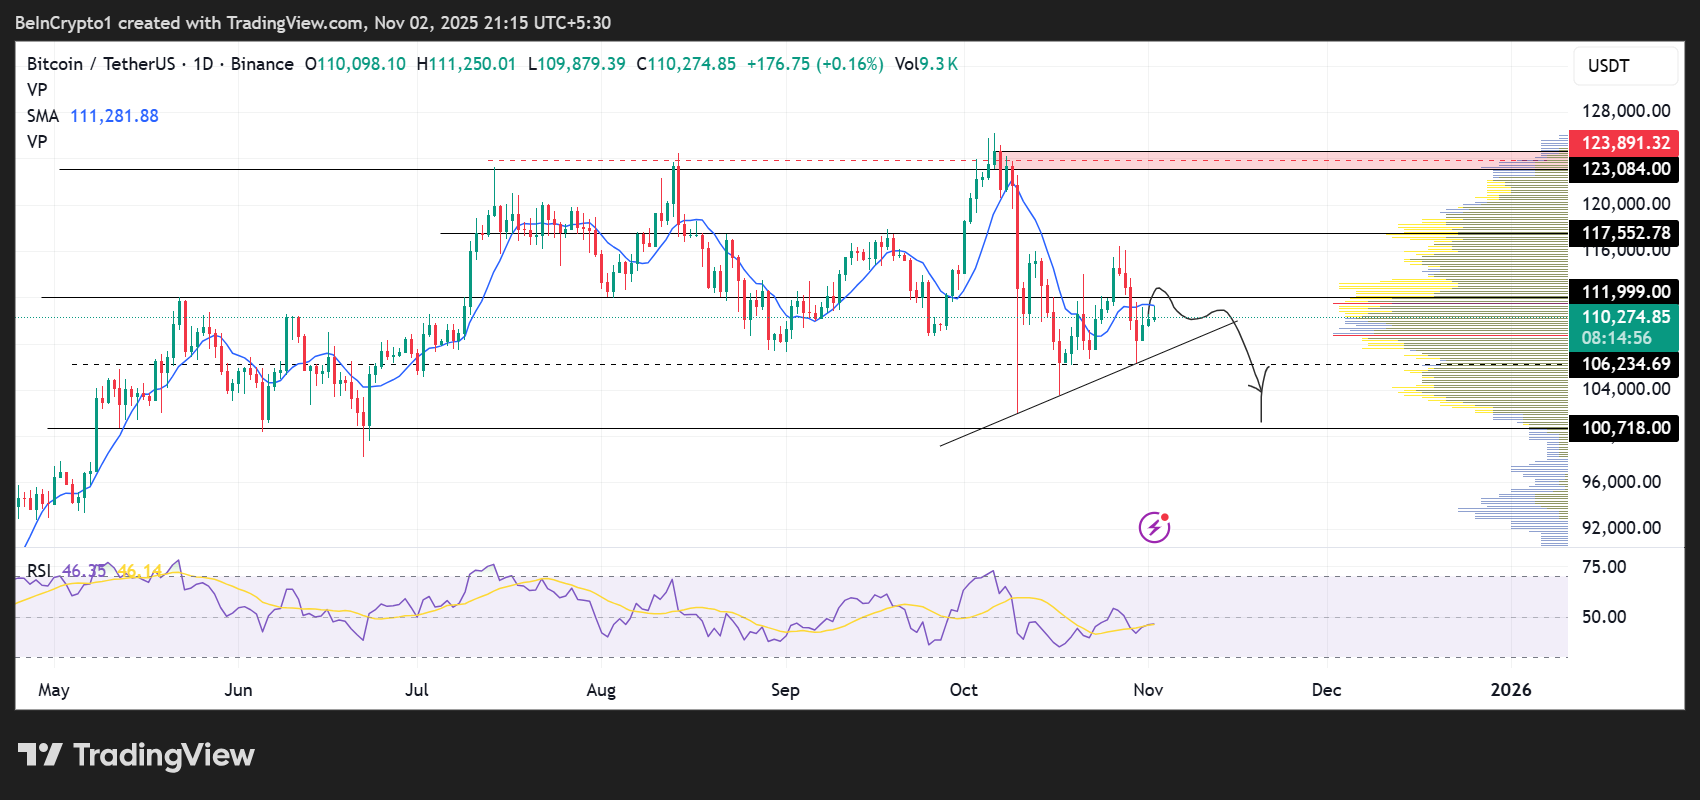
The Bitcoin price has been consolidating along an ascending trendline in October, recording higher highs despite capped upside at $111,999. Now, with bears (yellow horizontal bars) waiting to interact with the price just above $111,999, BTC may be primed for a correction.
Based on the RSI (Relative Strength Index) position at 46, momentum may not be enough to sustain a break above the aforementioned level. As such, BTC price could suffer a rejection due to the $111,999 resistance level.
Meanwhile, the immediate roadblock is due to the 9-day SMA (Simple Moving Average) at $111,281. As long as this moving average tracks the BTC price from above, the asset’s value will drop. As the price attempts to rise back towards the average, it encounters selling pressure (supply exceeds demand) from traders who expect the downtrend to continue. This would cause the price to bounce off the SMA and drop again.
Similarly, a price moving below its average suggests that traders are willing to sell the asset for less than its recent average price, indicating a lack of sufficient buying interest and downward momentum.
In the event of a drop below the ascending trendline, BTC could find initial support at $106,234, or, in the dire case, fall all the way to $100,718.
 Bitcoin Price Performance. Source:
TradingView
Bitcoin Price Performance. Source:
TradingView
Conversely, increased buying pressure could thrust the Bitcoin price past the resistance level at $111,999. A break and successful retest of this level could set the tone for more gains, potentially reaching $117,552. In a highly bullish scenario, the pioneer crypto could reach $123,084.
Nonetheless, only a decisive daily candlestick close above $123,891 would prime BTC to reclaim its peak price of $126,199.
“The next step should be BTC outperformance, but it could happen if the US government shutdown ends,” said analyst Ted.
Gold Consolidation Could Culminate in Price Breakdown
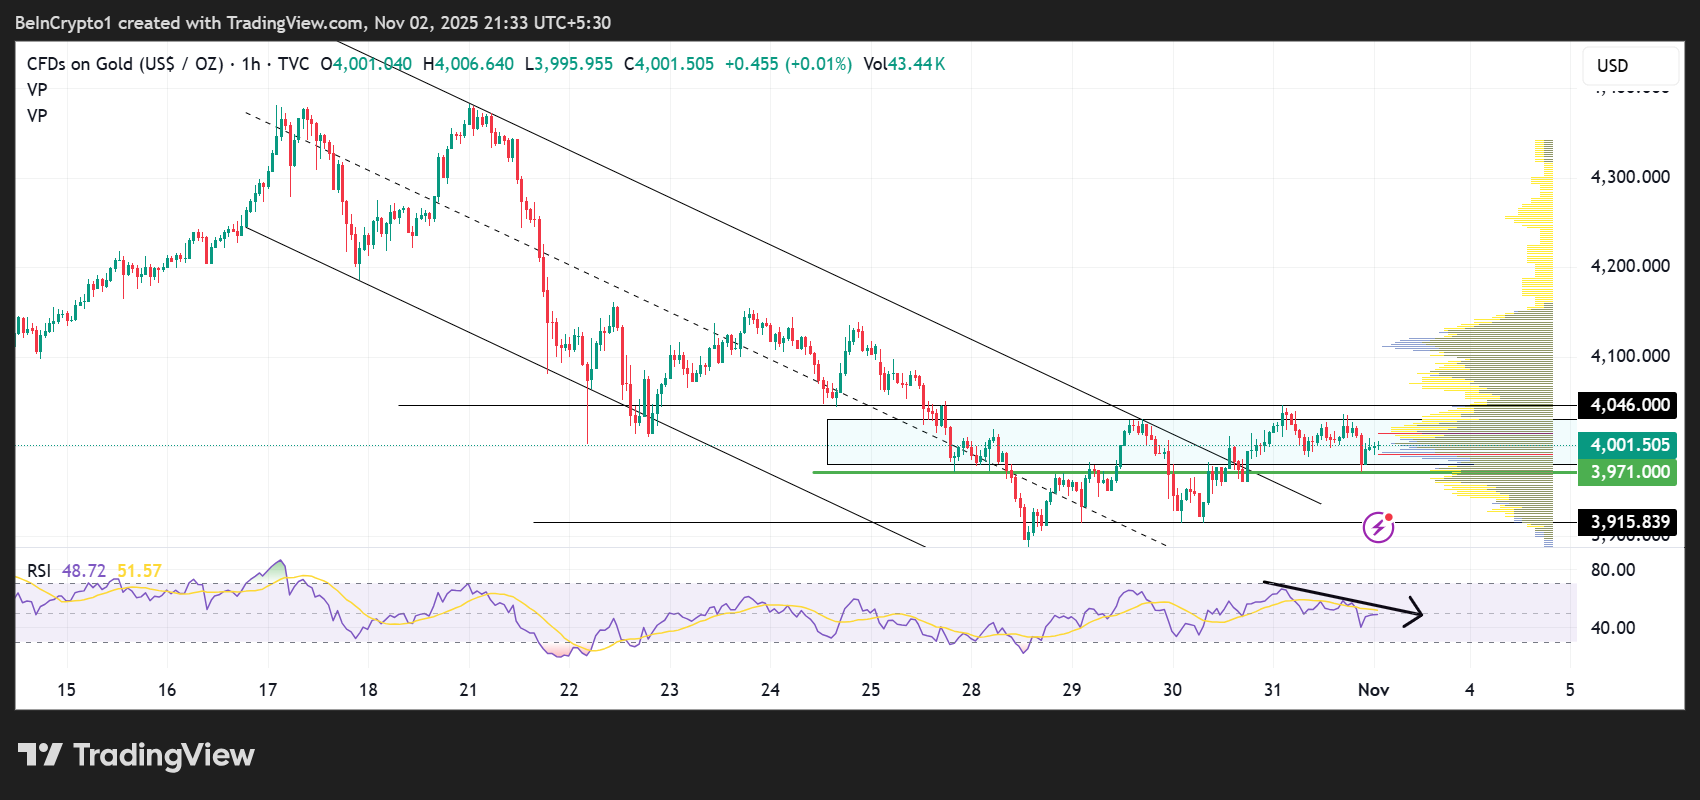
After weeks of rallying, Gold is showing weakness, which could culminate in a break below $4,000. For the most part, the rally was likely due to uncertainty surrounding the US-China trade war, which has now been resolved.
Accordingly, the XAU price’s breakout above a descending parallel channel may be short-lived. With the RSI showing fading momentum (lower highs and its position below 50), gold could drop below the consolidation phase.
A break and close below $3,971 on the hourly timeframe could confirm this directional bias.
 Gold Price Performance. Source:
TradingView
Gold Price Performance. Source:
TradingView
Conversely, bulls are interacting with the gold price at current levels, defending against further downside. This is seen with the grey horizontal bars (bullish volume profiles).
If buying pressure exceeds seller momentum, the gold price could break above the consolidation phase, confirmed by a one-hour candlestick close above $4,046.
Silver RSI Teases with A Sell Signal
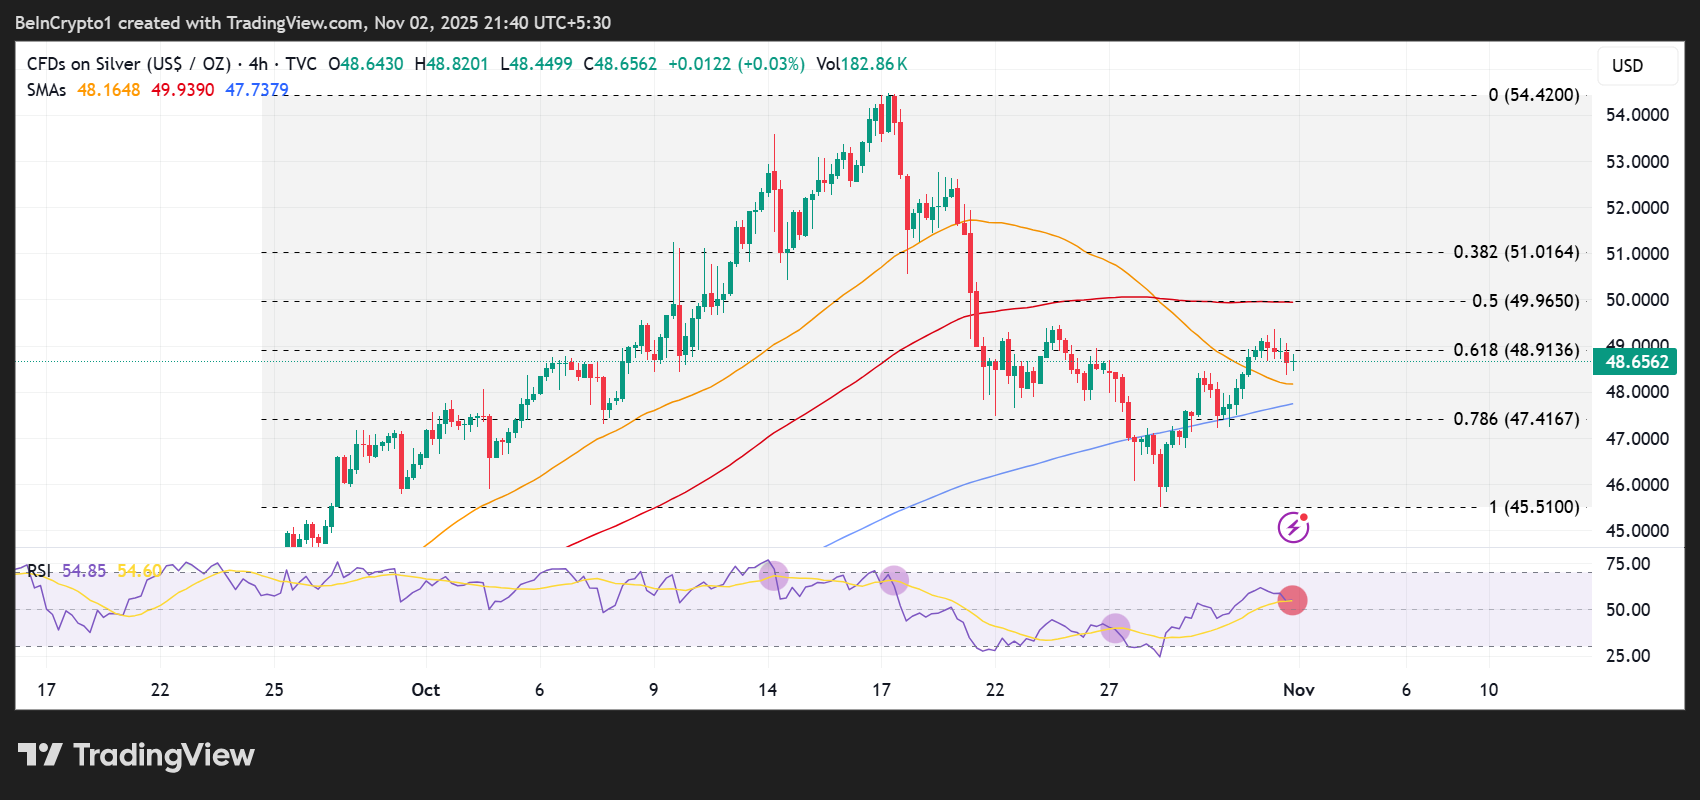
Silver may follow gold in a correction, as the XAG’s RSI indicates an imminent bearish crossover, which will be executed once it crosses below its signal line. History shows that every time such a crossover occurred, the price dropped in tandem, suggesting that investors interpreted this as a sell signal.
In this regard, the next level for Silver could be $47.41, earmarked by the 78.6% Fibonacci retracement level. The dire case could see the Silver price spiral all the way to $45.51, almost 7% below current levels.
 Silver Price Performance. Source:
TradingView
Silver Price Performance. Source:
TradingView
On the flipside, the silver price has significant downward support due to the 50- and 200-day SMAs at $48.16 and $47.73 levels, respectively. Buying pressure from these levels could catalyze an uptrend, providing a refreshing point for the bulls.
Increased buying pressure, enough to flip the most critical Fibonacci retracement level, 61.8%, back into support, could see the silver price climb to confront the confluence of resistance between the 50% Fibonacci retracement level and the 100-day SMA at $49.9.
Beyond this level, the next level of interest would be the 38.2% Fibonacci retracement level of $51.01, almost 5% above current levels.
Disclaimer: The content of this article solely reflects the author's opinion and does not represent the platform in any capacity. This article is not intended to serve as a reference for making investment decisions.
You may also like
Bitcoin May Face "The Last Drop": The Real Scenario of Liquidity Squeeze Is Unfolding
Bitcoin may be in the "final drop" stage of this correction. At the intersection where fiscal spending resumes and the next interest rate cut cycle begins, a new liquidity cycle will also be restarted.

Galaxy Research Report: What Is Driving the Rise of the Doomsday Vehicle Zcash?
Regardless of whether ZEC’s price strength can be sustained, this round of market rotation has successfully forced the market to reassess the value of privacy.
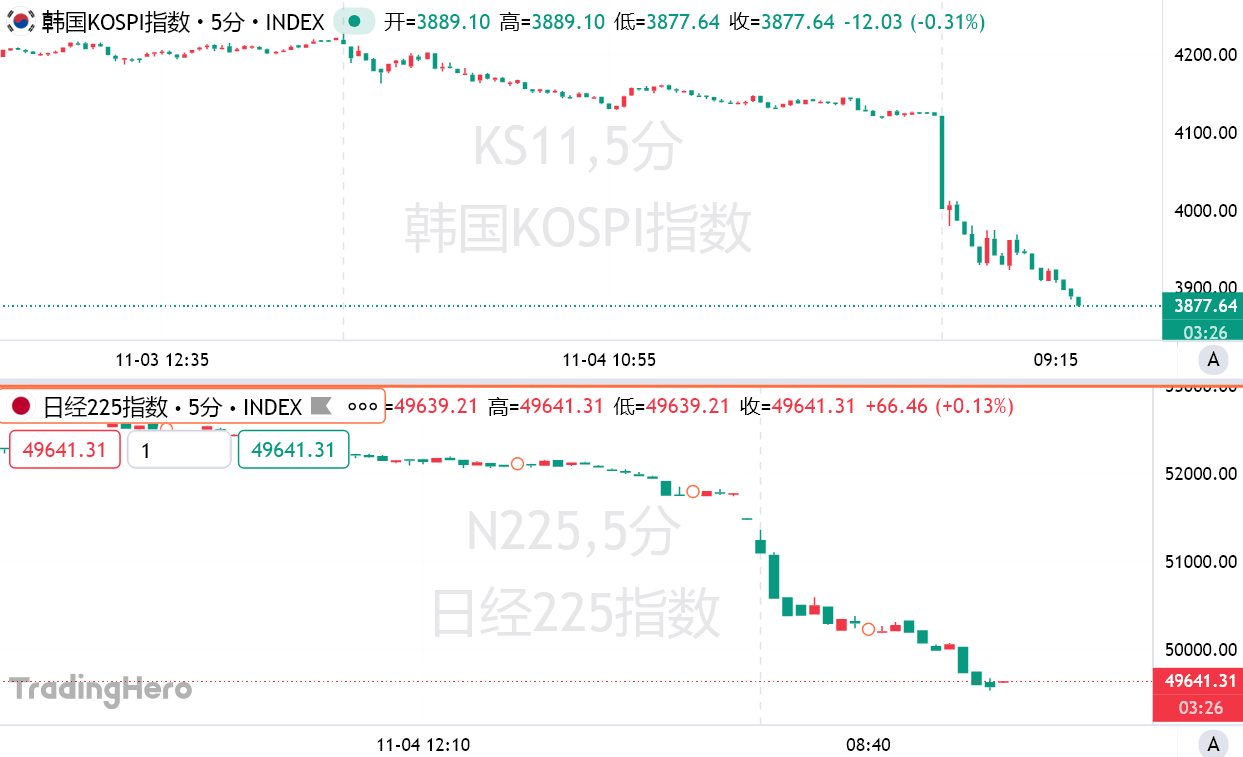
Asian stock markets plunge with circuit breakers triggered; Korea hits circuit breaker during trading, Nikkei falls below the 50,000 mark
Wall Street warns: This is just the beginning, and the panic triggered by the bursting of the AI bubble has only just started.
Only 0.2% of traders can exit at the bull market peak: The art of "smart exits" in the crypto cycle