
News
Stay up to date on the latest crypto trends with our expert, in-depth coverage.

On one hand, Vanguard has opened Bitcoin ETF trading, while on the other hand, CoinShares has withdrawn its applications for XRP, Solana Staking, and Litecoin ETFs, highlighting a significant divergence in institutional attitudes toward ETFs for different cryptocurrencies.


Bitcoin's price remains stable above the real market mean, but the market structure is similar to Q1 2022, with 25% of supply currently at a loss. The key support range is between $96.1K and $106K; breaking below this range will increase downside risk. ETF capital flows are negative, demand in both spot and derivatives markets is weakening, and volatility in the options market is underestimated. Summary generated by Mars AI. The accuracy and completeness of this summary are still being iteratively updated by the Mars AI model.


Ethereum has activated the key "Fusaka" upgrade, increasing Layer-2 data capacity eightfold through PeerDAS technology. Combined with the BPO fork mechanism and the blob base price mechanism, this upgrade is expected to significantly reduce Layer-2 operating costs and ensure the network’s long-term economic sustainability.

Cryptocurrency projects related to the Trump family were once market favorites, but are now experiencing a dramatic collapse in trust.
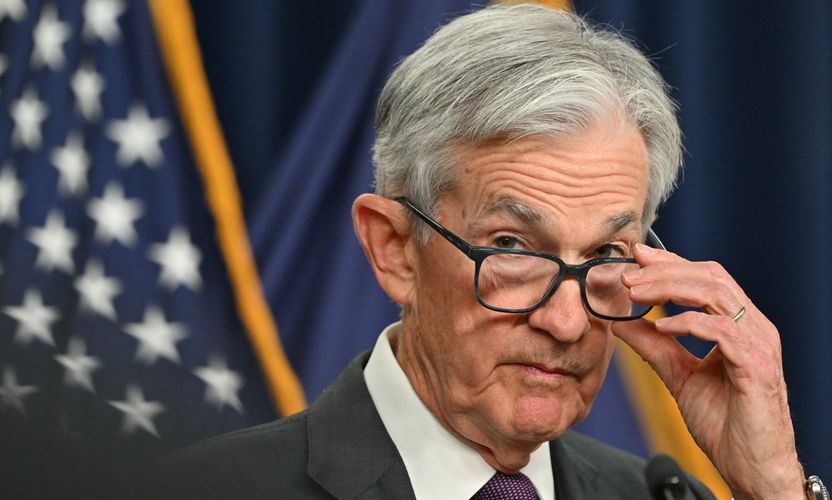
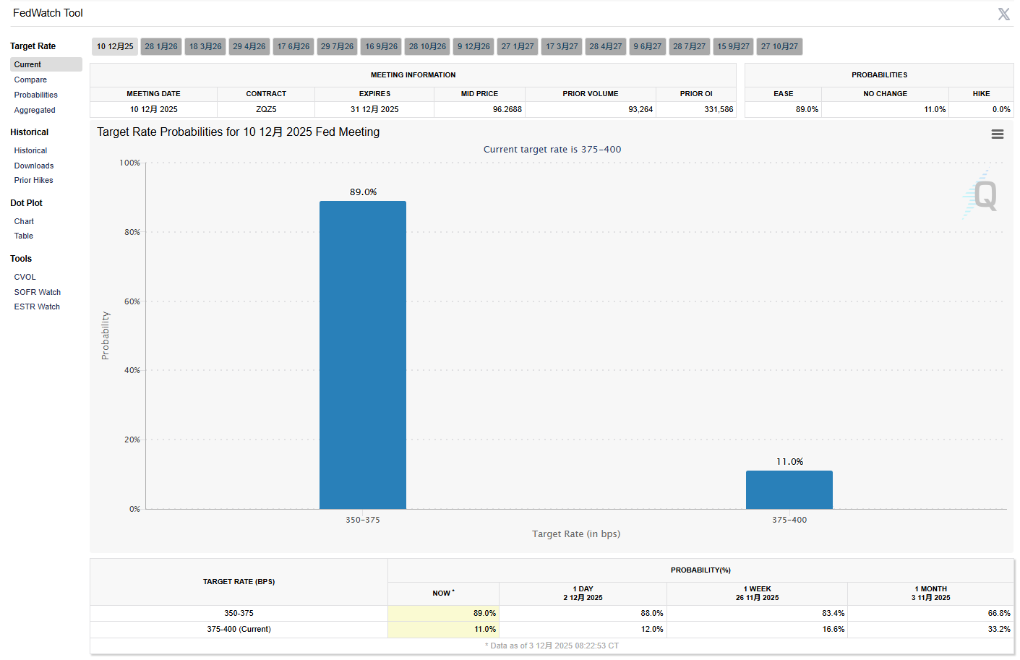
Bank of America believes that there is little to fear if Trump nominates a new Federal Reserve Chair, as the White House's ability to exert pressure will be significantly limited if Powell remains as a board member. In addition, a more hawkish committee would leave a Chair seeking to accommodate Trump's hopes for rate cuts with no room to maneuver.

BTC has strongly returned to $93,000. Although there appears to be no direct positive catalyst, in reality, four macro factors are resonating simultaneously to trigger a potential structural turning point: expectations of interest rate cuts, improving liquidity, political transitions, and the loosening stance of traditional institutions.

- 08:02Crypto trader paulwei adjusts BTC order placement strategy, with the long and short trigger range approximately between $91,000 and $94,400.BlockBeats News, on December 4, according to Coinbob Hot Address Monitor, crypto trader paulwei has raised the BTC long order range today, increasing his long entry level from $83,500 to $91,100, with 75% of funds allocated to placing long orders; the short target range is set between $94,400 and $99,000, with 15% of funds allocated to placing short orders; meanwhile, 10% of funds are reserved. The current position is a 2x leveraged BTC long, with a size of approximately $1,580 and an average price of $90,300. This trader previously increased 1.8 BTC to over 80 BTC within two years starting from May 1, 2020. Since November 16, he has been publicly trading live on Hyperliquid, with initial funds still around 1 BTC, and has currently recorded a profit of about $3,300.
- 08:02Bitunix Analyst: ADP Employment Data Disappoints and Capital Divergence Intensifies, Making BTC 93k the Key Short-term Bull-Bear WatershedBlockBeats News, December 4 — The latest data shows that in November, the US "ADP National Employment Report" unexpectedly decreased by 32,000 jobs, far below market expectations, indicating that the labor market is cooling at an accelerated pace. This report serves as an important reference for the Federal Reserve's December interest rate decision, and the weakening employment data adds further uncertainty to potential policy shifts. After the data release, safe-haven assets strengthened, gold prices rebounded to the $4,220 level, and the crypto market saw an expansion in range-bound volatility. From a macro perspective, the decline in employment mainly came from small and micro enterprises, with companies employing fewer than 50 people cutting 120,000 jobs in a single month—the largest drop since March 2023—reflecting simultaneous pressure on end demand and the financing environment. The annual wage growth rate fell to 4.4%, indicating marginal easing of inflationary pressures. The probability of a 25 basis point rate cut in December has risen to nearly 90% in the interest rate futures market, with short-term rate expectations turning dovish, the US dollar index experiencing increased volatility, and risk assets entering a repricing phase. In the crypto market, ETF capital flows have shown significant divergence: BTC spot ETFs saw a net outflow of $14.9 million in a single day, while ETH recorded a net inflow of $140.2 million, indicating a rotation of funds from BTC to the Ethereum ecosystem. In terms of liquidation structure over the past 24 hours, BTC long positions were liquidated for $45.07 million and short positions for $50.73 million; ETH long positions for $26.38 million and short positions for $103.37 million, with ETH short liquidations being significantly higher, and short-term volatility remaining elevated. Currently, it remains to be seen whether BTC can hold above $93,000; if it fails, $90,500 will become a key short-term support level. According to Bitunix analysts, against the backdrop of weakening employment and rising expectations of rate cuts, the market is entering a "macro turning point expectation + internal crypto capital rotation" composite phase. ETF capital flows and liquidation structures indicate that risk appetite is diverging rather than expanding in unison, and the short term remains a structurally volatile pattern. Going forward, attention should be paid to whether rate expectations are further revised downward and whether capital continues to rotate from bitcoin to high-beta assets, as this will determine the risk level and trend slope of the next market phase.
- 08:02If Bitcoin surpasses $95,000, the cumulative short liquidation intensity on major CEXs will reach $1.051 billionBlockBeats News, December 4, according to Coinglass data, if bitcoin breaks through $95,000, the cumulative short liquidation intensity on major CEXs will reach 1.051 billions. Conversely, if bitcoin falls below $91,000, the cumulative long liquidation intensity on major CEXs will reach 1.368 billions. BlockBeats note: The liquidation chart does not show the exact number of contracts to be liquidated, nor the precise value of contracts being liquidated. The bars on the liquidation chart actually represent the relative importance, or intensity, of each liquidation cluster compared to adjacent clusters. Therefore, the liquidation chart shows the extent to which the underlying price will be affected when it reaches a certain level. Higher "liquidation bars" indicate that once the price reaches that level, there will be a stronger reaction due to a wave of liquidity.