
News
Stay up to date on the latest crypto trends with our expert, in-depth coverage.
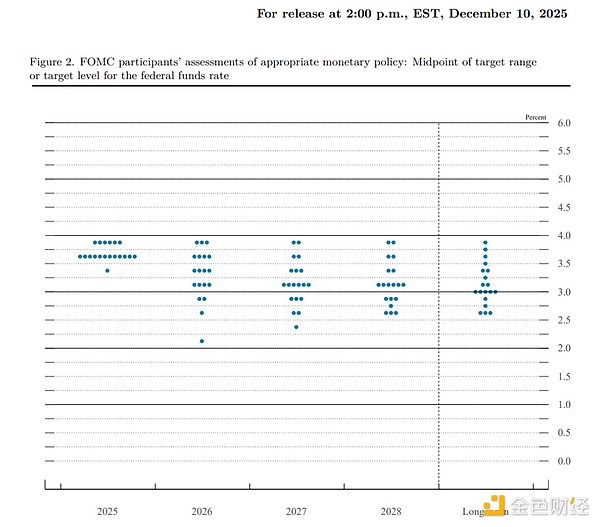
1Bitget Daily Digest (Dec. 11)|The Federal Reserve announced a 25 bps cut to the benchmark rate; Bitmine purchased 33,504 ETH; CBOE has approved the listing and registration of the 21Shares XRP ETF2Conflicted Fed cuts rates but Bitcoin’s ‘fragile range’ pins BTC under $100K3Full text of the Federal Reserve decision: 25 basis point rate cut, purchase of $4 billion in Treasury bills within 30 days

Historic Fundraising: Real Finance Attracts $29 Million to Revolutionize RWAs
Cointribune·2025/12/11 02:33

Bold Bitcoin OG Doubles Down: Expands Massive ETH Long Position to $392 Million
BitcoinWorld·2025/12/11 02:24
Bitcoin Price Plummets: Key Factors Behind the Sudden Drop Below $91,000
BitcoinWorld·2025/12/11 02:24
Essential Guide: Claim Your Talus Network Airdrop Tokens Starting Today
BitcoinWorld·2025/12/11 02:24
XRP ETF Triumph: CBOE Greenlights 21Shares Spot Fund in Landmark Move
BitcoinWorld·2025/12/11 02:24
Before You Buy Ripple Shares, Read This: CTO David Schwartz Lists Secondary-Market Risks
Coinpedia·2025/12/11 02:09
Solana ETF Nears Launch as Invesco Galaxy Clears Key SEC Filing
Coinpedia·2025/12/11 02:09
Exclusive: Expert Reveals How XRP Price Can Hit $10 And Above
Coinpedia·2025/12/11 02:09
Pi Network News: Analyst Says $307 Pi Price Claim in Lawsuit Has ‘Zero Basis’ in Reality
Coinpedia·2025/12/11 02:09
Flash
- 02:53Data: Whale "pension-usdt.eth" closed BTC long positions to successfully exit at the top, earning $23 million in 30 daysAccording to ChainCatcher, Coinbob's popular address monitoring shows that at 4:00 today, the whale labeled "pension-usdt.eth" fully closed its 2x leveraged BTC long position, with the liquidation amount exceeding $64 million in a short period and a small profit of about $560,000. In addition, over the past 7 days, this address has shorted twice and gone long three times, accumulating a total profit of $7.12 million. Monitoring also shows that this address often conducts short-term swing trades and opens large BTC and ETH positions with low leverage, with an average holding period of about 20 hours. In the past 30 days, profits have exceeded $23 million.
- 02:53Data: The total net inflow for the US XRP spot ETF in a single day was $10.2 million.ChainCatcher News, according to SoSoValue data, the total net inflow of XRP spot ETFs is $10,200,000. The XRP spot ETF with the highest single-day net inflow is Bitwise XRP ETF, with a single-day net inflow of $7,000,000. Currently, the historical total net inflow of XRP has reached $200,000,000. Next is Grayscale XRP ETF, with a single-day net inflow of $3,200,000 and a historical total net inflow of $217,000,000. As of press time, the total net asset value of XRP spot ETFs is $939,000,000, with an XRP net asset ratio of 0.75%, and the historical cumulative net inflow has reached $954,000,000.
- 02:53Data: If Bitcoin falls below $88,000, the cumulative long liquidation intensity on major CEXs will reach $489 millions.According to ChainCatcher, citing Coinglass data, if bitcoin falls below $88,000, the cumulative long liquidation intensity on major CEXs will reach $489 million. Conversely, if bitcoin breaks through $92,000, the cumulative short liquidation intensity on major CEXs will reach $558 million. The liquidation chart does not display the exact number of contracts pending liquidation, nor the precise value of contracts being liquidated. The bars on the liquidation chart actually represent the relative importance, or intensity, of each liquidation cluster compared to adjacent clusters. Therefore, the liquidation chart shows the extent to which the underlying price reaching a certain level will be affected. A higher "liquidation bar" indicates that when the price reaches that level, there will be a stronger reaction due to a wave of liquidity.
News