
News
Stay up to date on the latest crypto trends with our expert, in-depth coverage.
1Bitget Daily Digest (Dec. 5) | 21Shares Launches 2x Leveraged SUI ETF on Nasdaq; U.S. Treasury Debt Surpasses $30 Trillion; JPMorgan: Strategy’s Resilience May Determine Bitcoin’s Short-Term Trend2Bitcoin looks increasingly like it did in 2022: Can BTC price avoid $68K?3The Chainlink ETF Disappoints Despite $41 Million Inflows — Why?


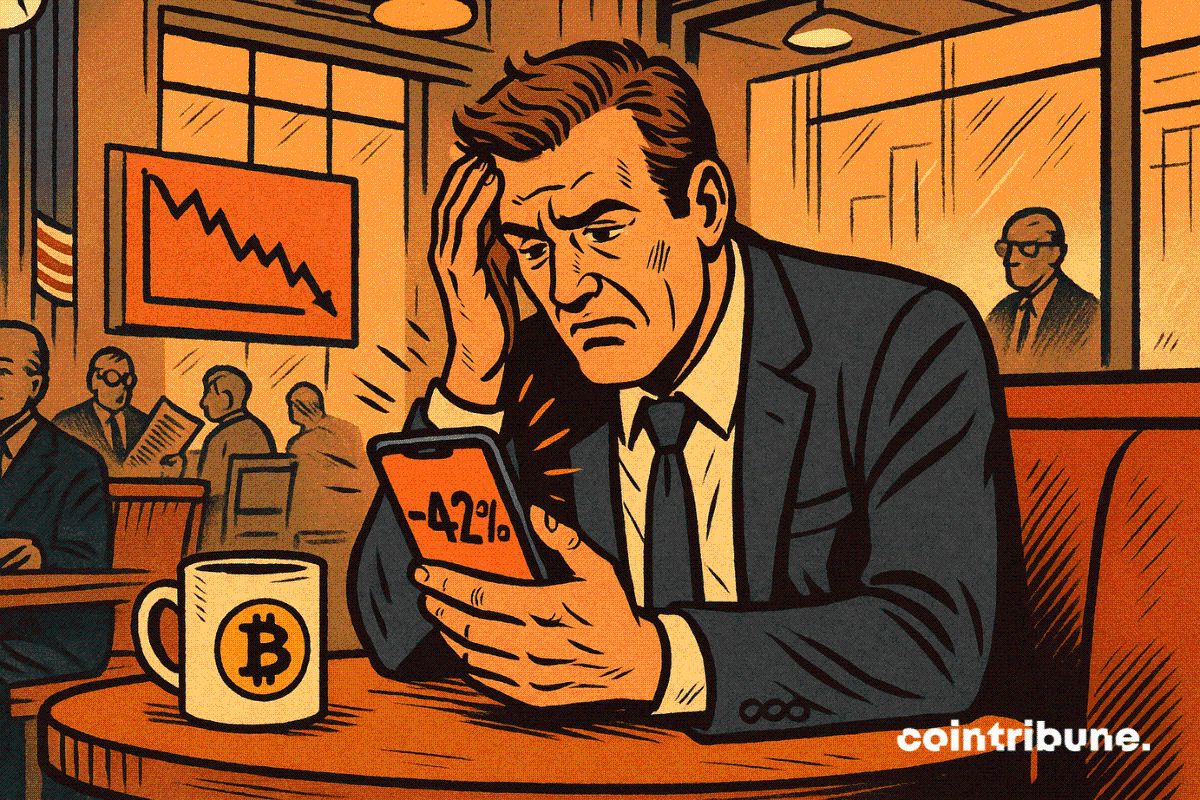
Crypto Markets Face a Rollercoaster: What Happened in the Past 24 Hours?
In Brief Bitcoin price dropped by 2.4%, influencing overall crypto market sentiment. The top 10 cryptocurrencies saw a general decline over the past 24 hours. Market seeks stability amid cautious investor behavior and potential short-term volatility.
Cointurk·2025/12/06 09:15
Meta Slashes VR Spending By 30 % In Strategic Pivot
Cointribune·2025/12/06 09:15
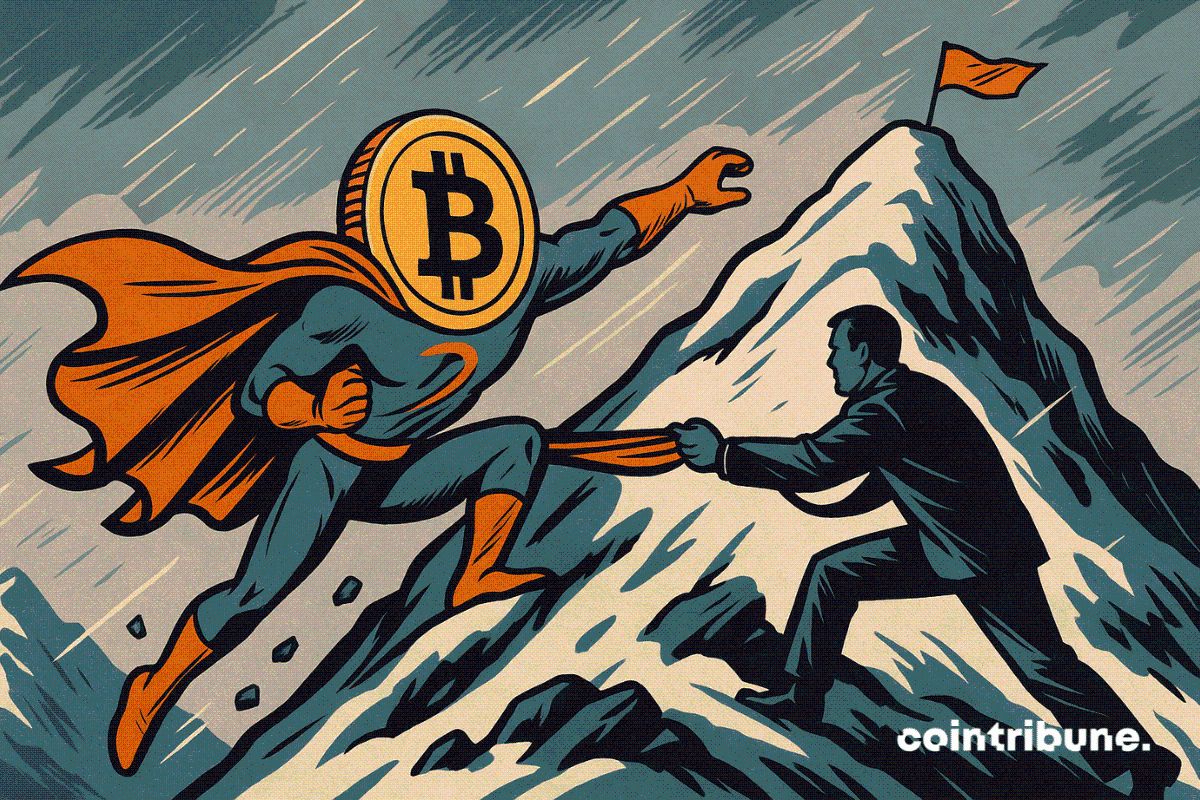
January’s Impact On Bitcoin Price Questioned By Experts
Cointribune·2025/12/06 09:15
Crypto Futures Liquidations: The Alarming Domination of Long Positions
BitcoinWorld·2025/12/06 09:06
Alarming Trend: US Spot ETH ETFs Bleed $75.2M for Second Consecutive Day
BitcoinWorld·2025/12/06 09:06
Japan’s Crucial Rate Hike Threatens Bitcoin Liquidity and Global Risk Assets
BitcoinWorld·2025/12/06 09:06
Stunning Bitmain ETH Purchase: $68.7 Million Move Signals Major Crypto Confidence
BitcoinWorld·2025/12/06 09:06
Flash
- 09:40Data: A certain whale accumulated 2,640 ETH at an average price of $3,027.33, with a total value of approximately $8 million.According to ChainCatcher, on-chain analyst Ai Aunt (@ai_9684xtpa) has monitored that the whale address "0xDE3...ddFCc" spent 8 million USDT in the past hour to purchase 2,640 ETH at an average price of $3,027.33. This is the first time this address has established a position in ETH.
- 09:24Data: Two wallets actively accumulated PIPPIN tokens, purchasing a total of $1.5 million worth of PIPPIN before and after the price surge.According to ChainCatcher, as monitored by Onchain School, PIPPIN has surged over 80% in the past 24 hours. Two wallets have been actively accumulating before and after the price increase, purchasing a total of $1.5 million worth of PIPPIN tokens. Among them: the HWBDGG wallet currently holds PIPPIN tokens valued at $4.47 million, and DywiW8 currently holds PIPPIN tokens valued at $636,000.
- 09:20Analyst: Market sentiment is quietly reaching a turning point, BWTS pattern indicates rebound conditions are in placeOn December 6, on-chain analyst Murphy stated that the short-term Behavior-Weighted Trend Signal (BWTS) can be used to identify genuine long-term holder selling pressure and trend-driven capitulation behavior. This indicator not only considers whether investors are selling BTC at a loss, but also measures the forced selling of coins that have been "held for a period of time." Historical data shows that whenever the BWTS (red line) and BTC price (black line) diverge, it signals the gradual clearing of panic selling, often leading to a rebound or reversal in the market. After the Luna crash in May 2022, the BWTS, which had already returned to the zero axis, deviated sharply again, breaking the previous divergence pattern. The rebound ultimately did not turn into a reversal, but instead led to a deeper bear market. Currently, the BWTS pattern is similar to before, which can be interpreted as having the conditions for a rebound, or in other words, as long as the divergence is not broken, the rebound may not be over yet.
News