Bitget App
Trade smarter
Buy cryptoMarketsTradeFuturesEarnWeb3SquareMore
Trade
Spot
Buy and sell crypto with ease
Margin
Amplify your capital and maximize fund efficiency
Onchain
Going Onchain, without going Onchain!
Convert
Zero fees, no slippage
Explore
Launchhub
Gain the edge early and start winning
Copy
Copy elite trader with one click
Bots
Simple, fast, and reliable AI trading bot
Trade
USDT-M Futures
Futures settled in USDT
USDC-M Futures
Futures settled in USDC
Coin-M Futures
Futures settled in cryptocurrencies
Explore
Futures guide
A beginner-to-advanced journey in futures trading
Futures promotions
Generous rewards await
Overview
A variety of products to grow your assets
Simple Earn
Deposit and withdraw anytime to earn flexible returns with zero risk
On-chain Earn
Earn profits daily without risking principal
Structured Earn
Robust financial innovation to navigate market swings
VIP and Wealth Management
Premium services for smart wealth management
Loans
Flexible borrowing with high fund security
Chainlink (LINK) Price Gives First Bearish Signs Since August – What’s Next?

Chainlink (LINK) Price Gives First Bearish Signs Since August – What’s Next?

BeInCryptoBeInCrypto2023/12/20 11:06
By:By Valdrin Tahiri

The Chainlink (LINK) price has decreased since its yearly high of $17.30 on December 9.

This is LINK’s first sign of weakness since the price broke out from a long-term descending resistance trend line. Can LINK regain its footing before the end of the year?

Chainlink Creates Bearish Engulfing Candlestick

The LINK price has increased since June , when it traded at a low of $4.90. The increase accelerated in September, and the price broke out from a long-term descending resistance trend line the next month. At the time of the breakout, the trend line had been in place for almost 900 days.

The increase accelerated afterward, and the LINK price reached a new yearly high of $17.30 two weeks ago. However, it has fallen since and created a bearish engulfing candlestick last week , the first such candlestick since August.

The decrease validated a long-term horizontal resistance area.

When evaluating market conditions, traders use the RSI as a momentum indicator to determine whether a market is overbought or oversold and whether to accumulate or sell an asset. If the RSI reading is above 50 and the trend is upward, bulls still have an advantage, but if the reading is below 50, the opposite is true.

The RSI shows signs of weakness since it is falling and has generated bearish divergence (green).

LINK Price Prediction: Is the Bottom In?

Utilizing the Elliott Wave theory , technical analysts examine long-term price patterns and investor psychology that recur to determine the direction of a trend.

The most likely wave count suggests that LINK completed a five-wave upward movement that began in June. The bearish divergence that developed in November indicates the upward movement is complete.

Despite this LINK price weakness, cryptocurrency trader The CryptoBull is bullish on the long-term trend. He tweeted:

If you’re emotional about $LINK price, simply put a sell order at $250, delete related apps, enjoy life, come back in 1-2 year tops. Profit.

Steve is also bullish because the Grayscale Chainlink Trust currently trades near $50, and he believes the price will follow.

In any case, if the count is correct, LINK has begun an A-B-C corrective structure (white). The first potential target for the bottom of this movement is at $12.50, 12% below the current price, while the second is at $11.05, 23% below the price.

The targets are found by the 0.382 and 0.5 Fib retracement support levels, respectively. 

Despite this bearish short-term LINK price prediction , increasing above the yearly high of $17.30 will mean the upward movement is ongoing. The LINK price could increase by nearly 40% to the next resistance at $20.

Disclaimer

In line with the Trust Project guidelines, this price analysis article is for informational purposes only and should not be considered financial or investment advice. BeInCrypto is committed to accurate, unbiased reporting, but market conditions are subject to change without notice. Always conduct your own research and consult with a professional before making any financial decisions. Please note that our  Terms and Conditions ,  Privacy Policy , and  Disclaimers  have been updated.

0

Disclaimer: The content of this article solely reflects the author's opinion and does not represent the platform in any capacity. This article is not intended to serve as a reference for making investment decisions.

PoolX: Earn new token airdrops
Lock your assets and earn 10%+ APR
Lock now!

You may also like

PEPE's Surge vs. LILPEPE's Explosive Potential: Is This the Next Meme-Coin Paradigm Shift?

- PEPE, the OG Pepe the Frog-inspired meme-coin, struggles with declining prices (-0.60% weekly) and waning community engagement despite a $4.73B market cap. - LILPEPE, an Ethereum Layer 2-based project, gains traction with $20M presale, CertiK audit, and infrastructure addressing scalability and governance gaps in meme-coins. - LILPEPE's $32.3M market cap and community-driven roadmap contrast PEPE's speculative nature, signaling a shift toward utility-driven meme-coin innovation. - Analysts suggest projec

ainvest2025/08/27 13:57
PEPE's Surge vs. LILPEPE's Explosive Potential: Is This the Next Meme-Coin Paradigm Shift?

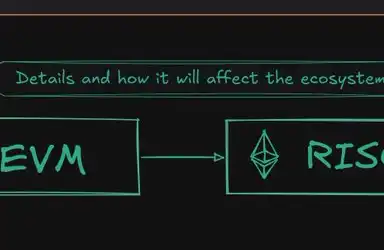
Ethereum may undergo the largest upgrade in history: EVM to be phased out, RISC-V to take over

By embracing RISC-V, Ethereum can address its scalability bottleneck and position itself as the foundational trust layer for the next generation of the Internet.

BlockBeats2025/08/27 13:56
Ethereum may undergo the largest upgrade in history: EVM to be phased out, RISC-V to take over

Ethereum's 2025 Price Outlook and the Rise of Disruptive Altcoins: A Strategic Investment Dilemma

- Ethereum's 2025 price outlook shows 35.4% growth potential driven by institutional adoption and deflationary mechanisms. - RTX targets cross-border remittances with a 0.1% fee model, projecting 150x returns via real-world utility and deflationary tokenomics. - Investors face a strategic dilemma between Ethereum's stability and RTX's high-risk, high-reward disruption in the evolving crypto landscape.

ainvest2025/08/27 13:45
Ethereum's 2025 Price Outlook and the Rise of Disruptive Altcoins: A Strategic Investment Dilemma