ANALYSIS: Bitcoin's Daily RSI Indicator Signals Clear Bullish Divergence
At press time, $58,018 was the level at which bitcoin was attracting the most liquidity, according to CoinGlass data, and its price is eroding buying support below $57,000. Additionally, from July 4 to 5, long Bitcoin bursts totaled more than $220 million. Short positions then experienced a blowout over the weekend, with trader Daan Crypto Trades noting that some short positions were closed when Bitcoin reached a localized high of $58,500. Still other analysts are seeing encouraging signals, including bullish divergences, from the Bitcoin Relative Strength Index (RSI) on the daily time frame. Analyst Wolf posted on X: "My initial bearish target was $52,000, but it looks like the bulls may be one step ahead of me. The daily RSI indicator is showing a clear bullish divergence and the expanding wedge pattern is further increasing investor interest."
Disclaimer: The content of this article solely reflects the author's opinion and does not represent the platform in any capacity. This article is not intended to serve as a reference for making investment decisions.
You may also like
Bitget Wallet's "Chain Scanner" Feature Now Supports Five Major New Token Platforms Including Pump.fun and BONK.fun
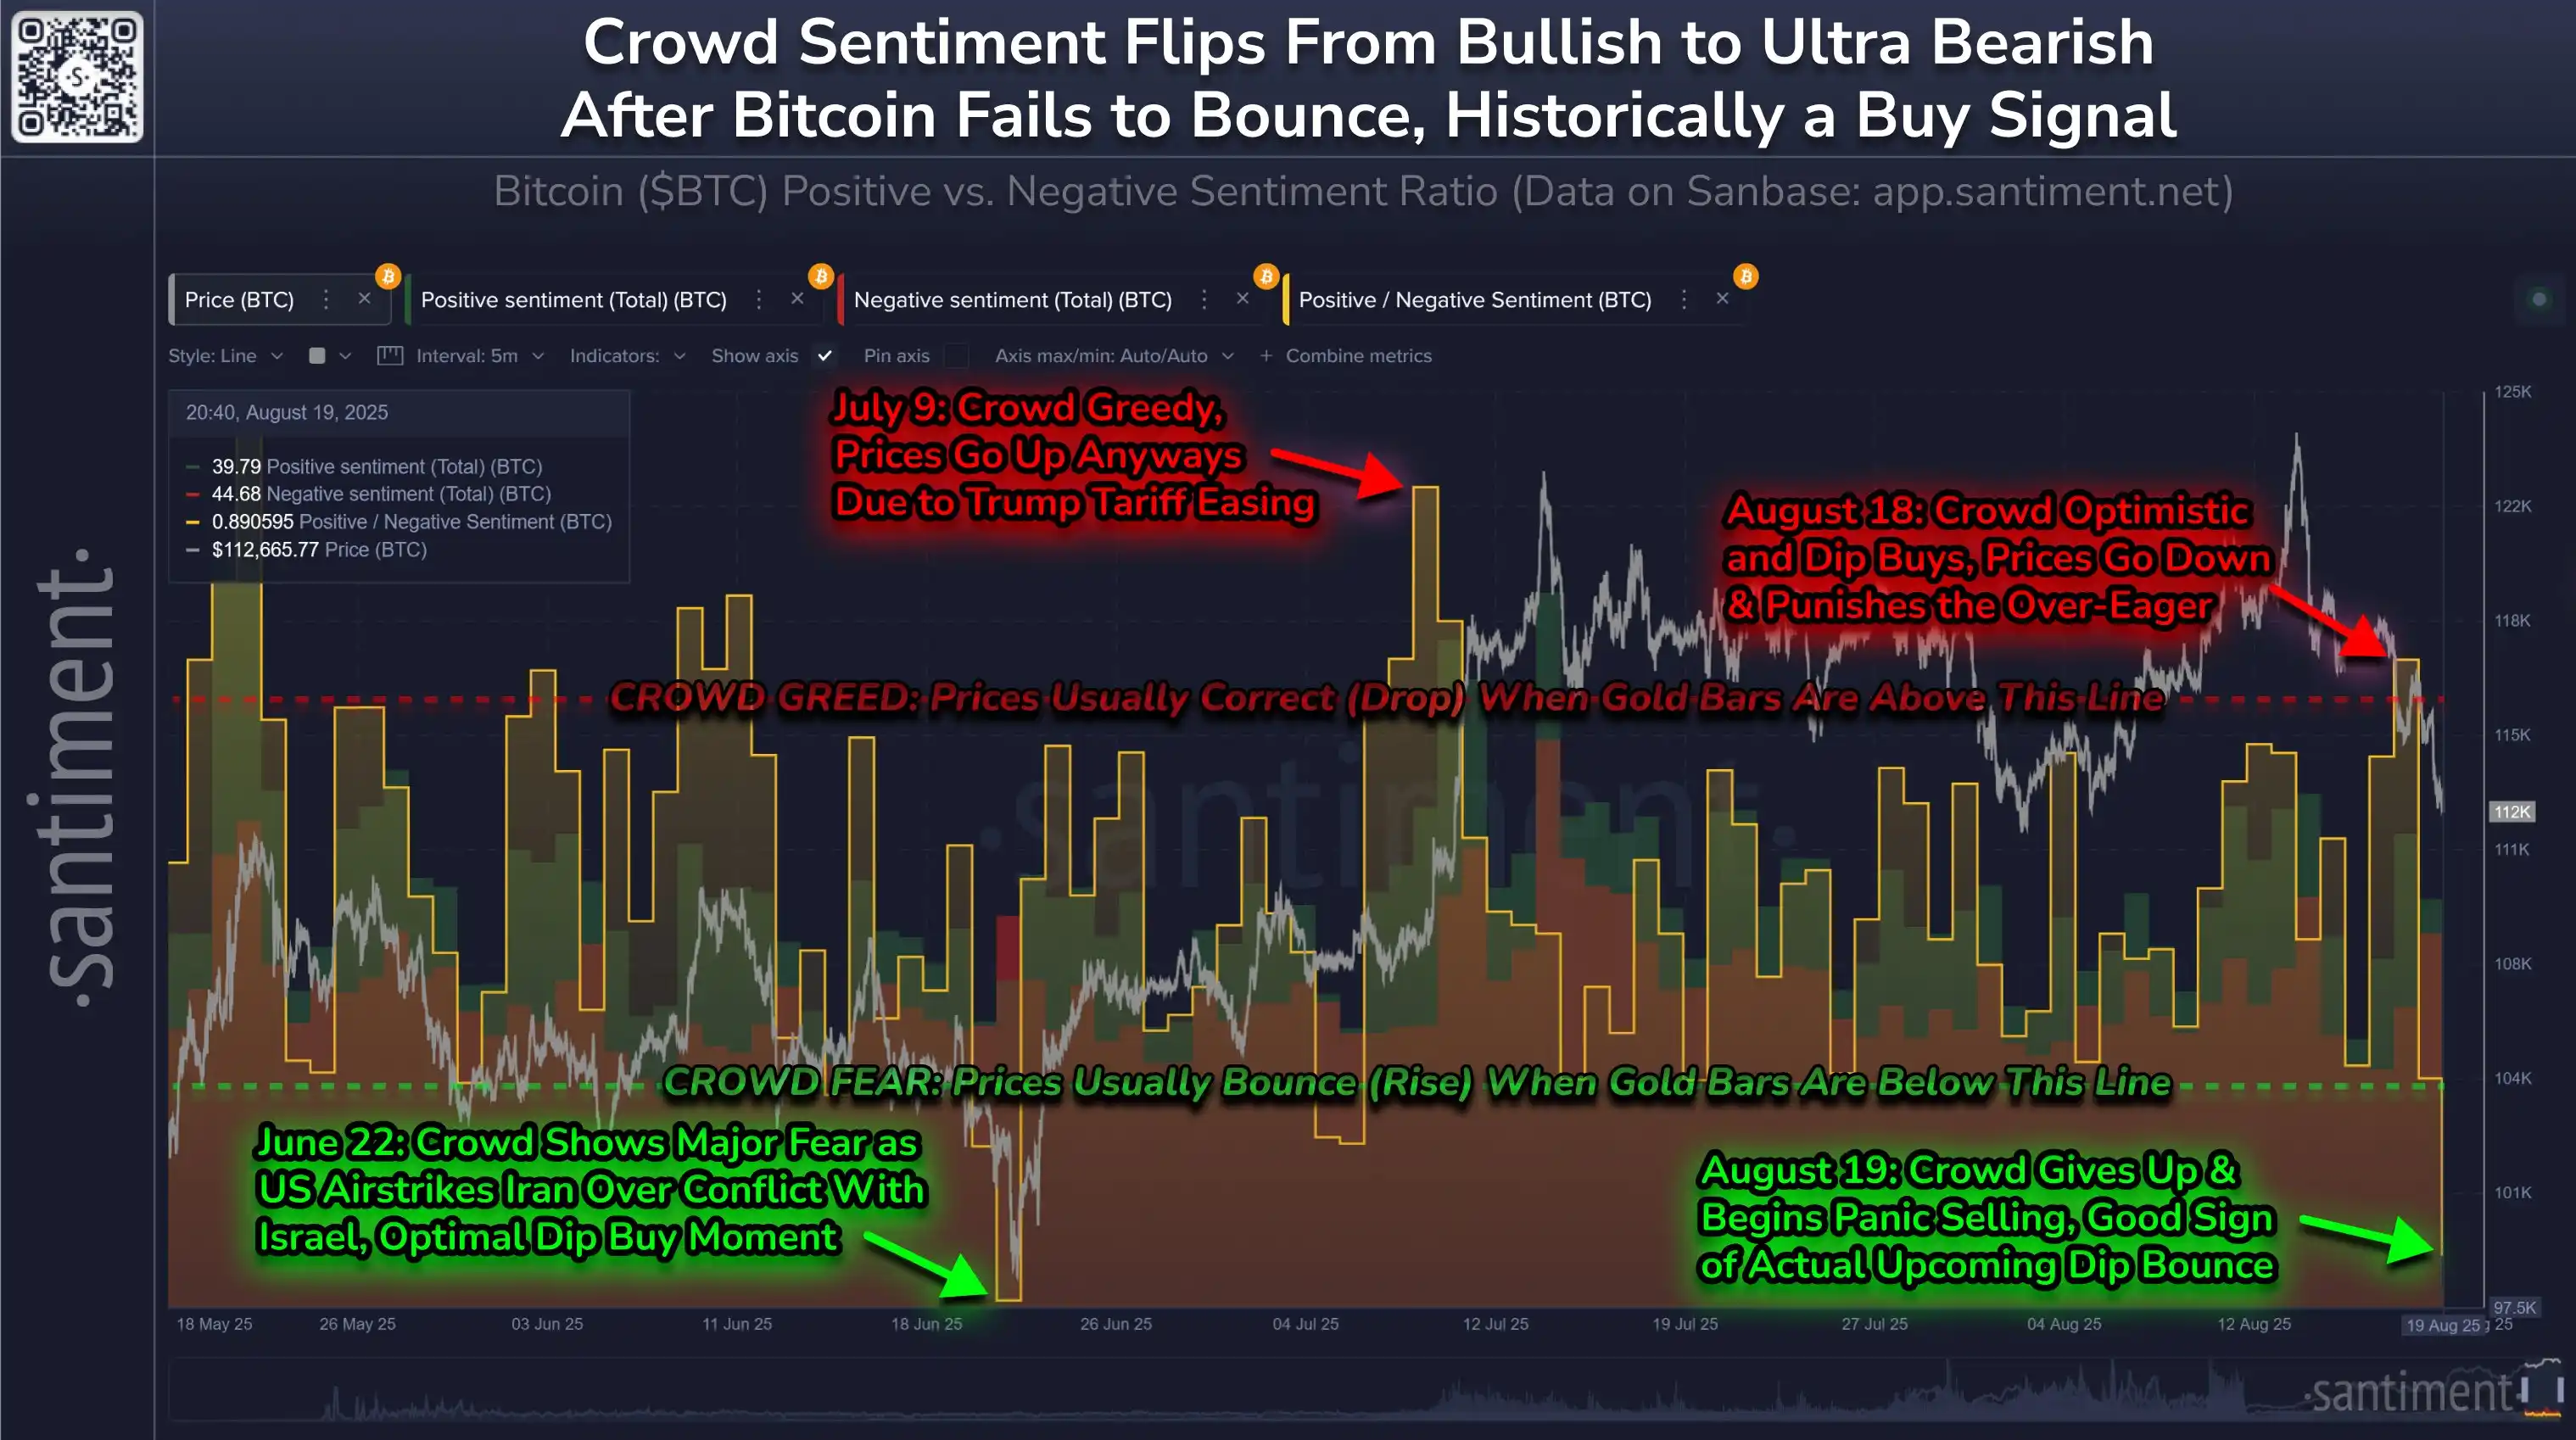
Santiment: Retail Investor Market Pessimism Hits Highest Level Since June 22, Potential Buying Opportunity Emerges
Santiment: Retail Sentiment Turns Extremely Bearish, Potential Signal for Market Reversal