

Bitcoin just took us all on one hell of a ride. Last week, it dropped nearly 33% from its all-time high, hitting levels we haven’t seen since February.
Yeah, it’s bounced back a bit, but don’t get too comfortable. Bitfinex analysts say the market’s still flashing some serious warning signs, and anyone with skin in the game should be paying attention.
Key metrics are telling us that despite the rebound, bearish sentiment is still hanging around like a bad smell.
Bitcoin’s price currently hovers around $59,518.14, down by 0.28% in the latest session. It’s trying to stabilize, but all simple moving averages are showing us that it’s not going to be easy.
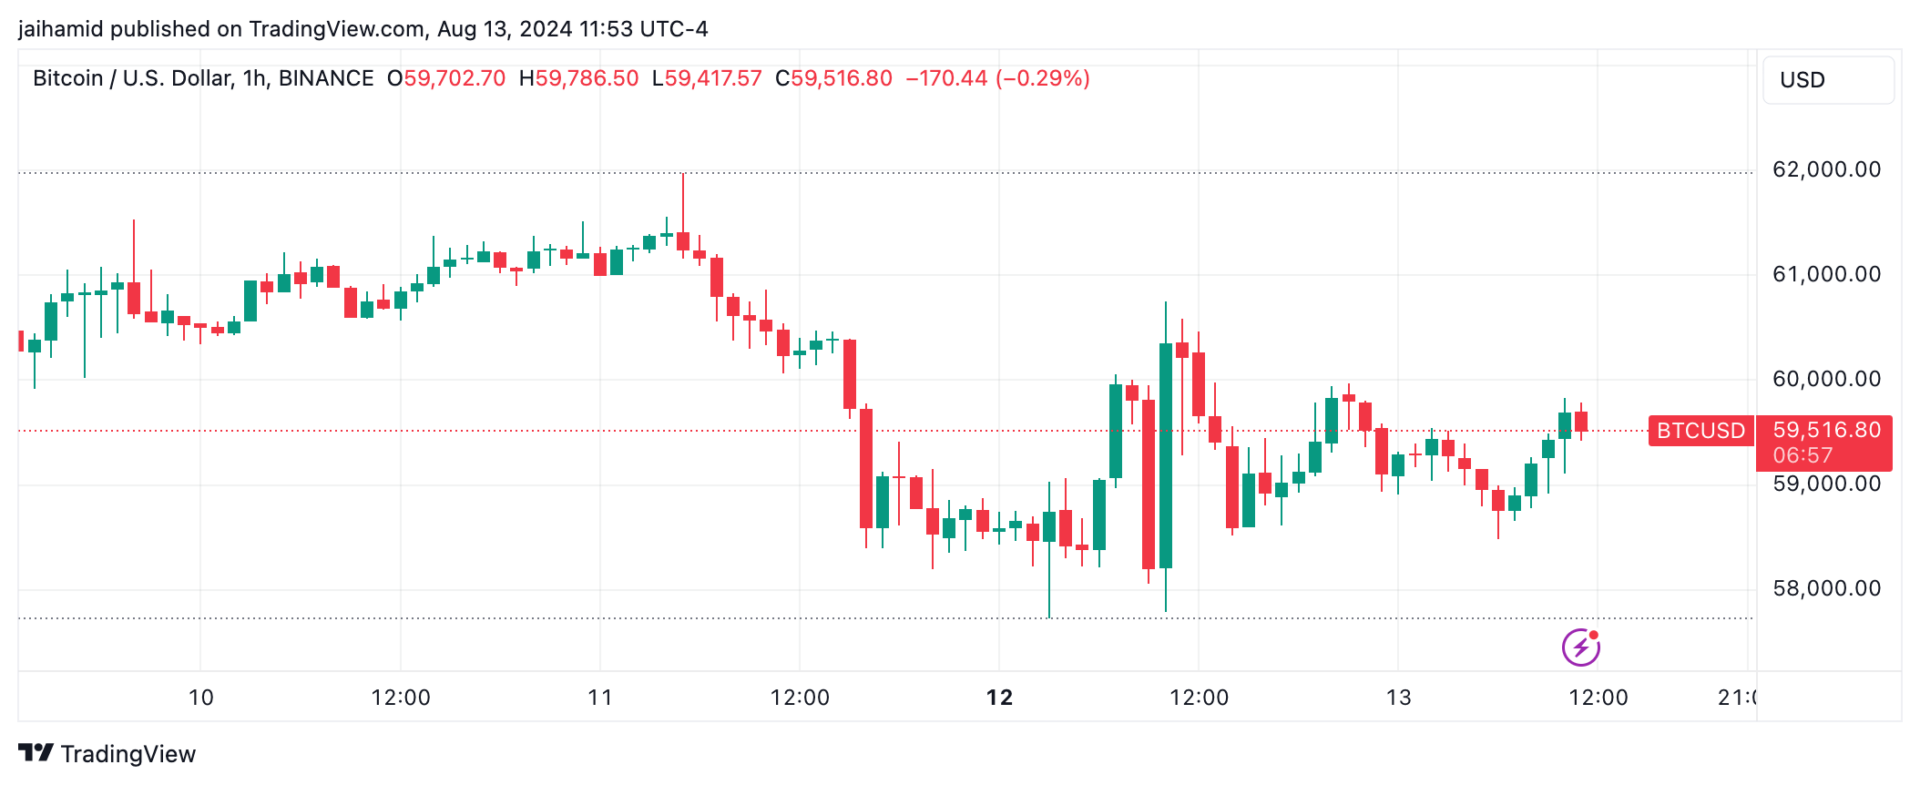
The 50-period SMA is at $60,054.59, the 100-period SMA is at $59,184.24, and the 200-period SMA is sitting at $58,478.34.
The fact that Bitcoin is trading below the 50-period SMA and is just hovering near the 100-period SMA tells us one thing—there’s resistance up ahead.
The bulls are going to have to fight hard to push past this if they want to see any huge gains.
Bitcoin’s rough patch
Bitfinex analysts told us they have been watching this closely. They’ve pointed out that Bitcoin’s price recently approached the 1SD band, a level that’s historically seen prices drop to extreme lows.
Only about 7.1% of trading days have recorded prices deviating below this band, which underscores just how severe this recent drop was.
According to these analysts, this is a signal of the kind of stress and negative sentiment that’s been brewing among investors, especially the newer ones who might not be used to these wild swings.
The chart below is showing a Double Top pattern with a Relative Risk (RR) ratio of 26.0231657815. For those who aren’t familiar, a Double Top is not what you want to see if you’re hoping for Bitcoin to go up.
It’s a classic sign that the price could be heading for a bearish reversal, meaning more downward action could be on the way unless we see some serious buying pressure.
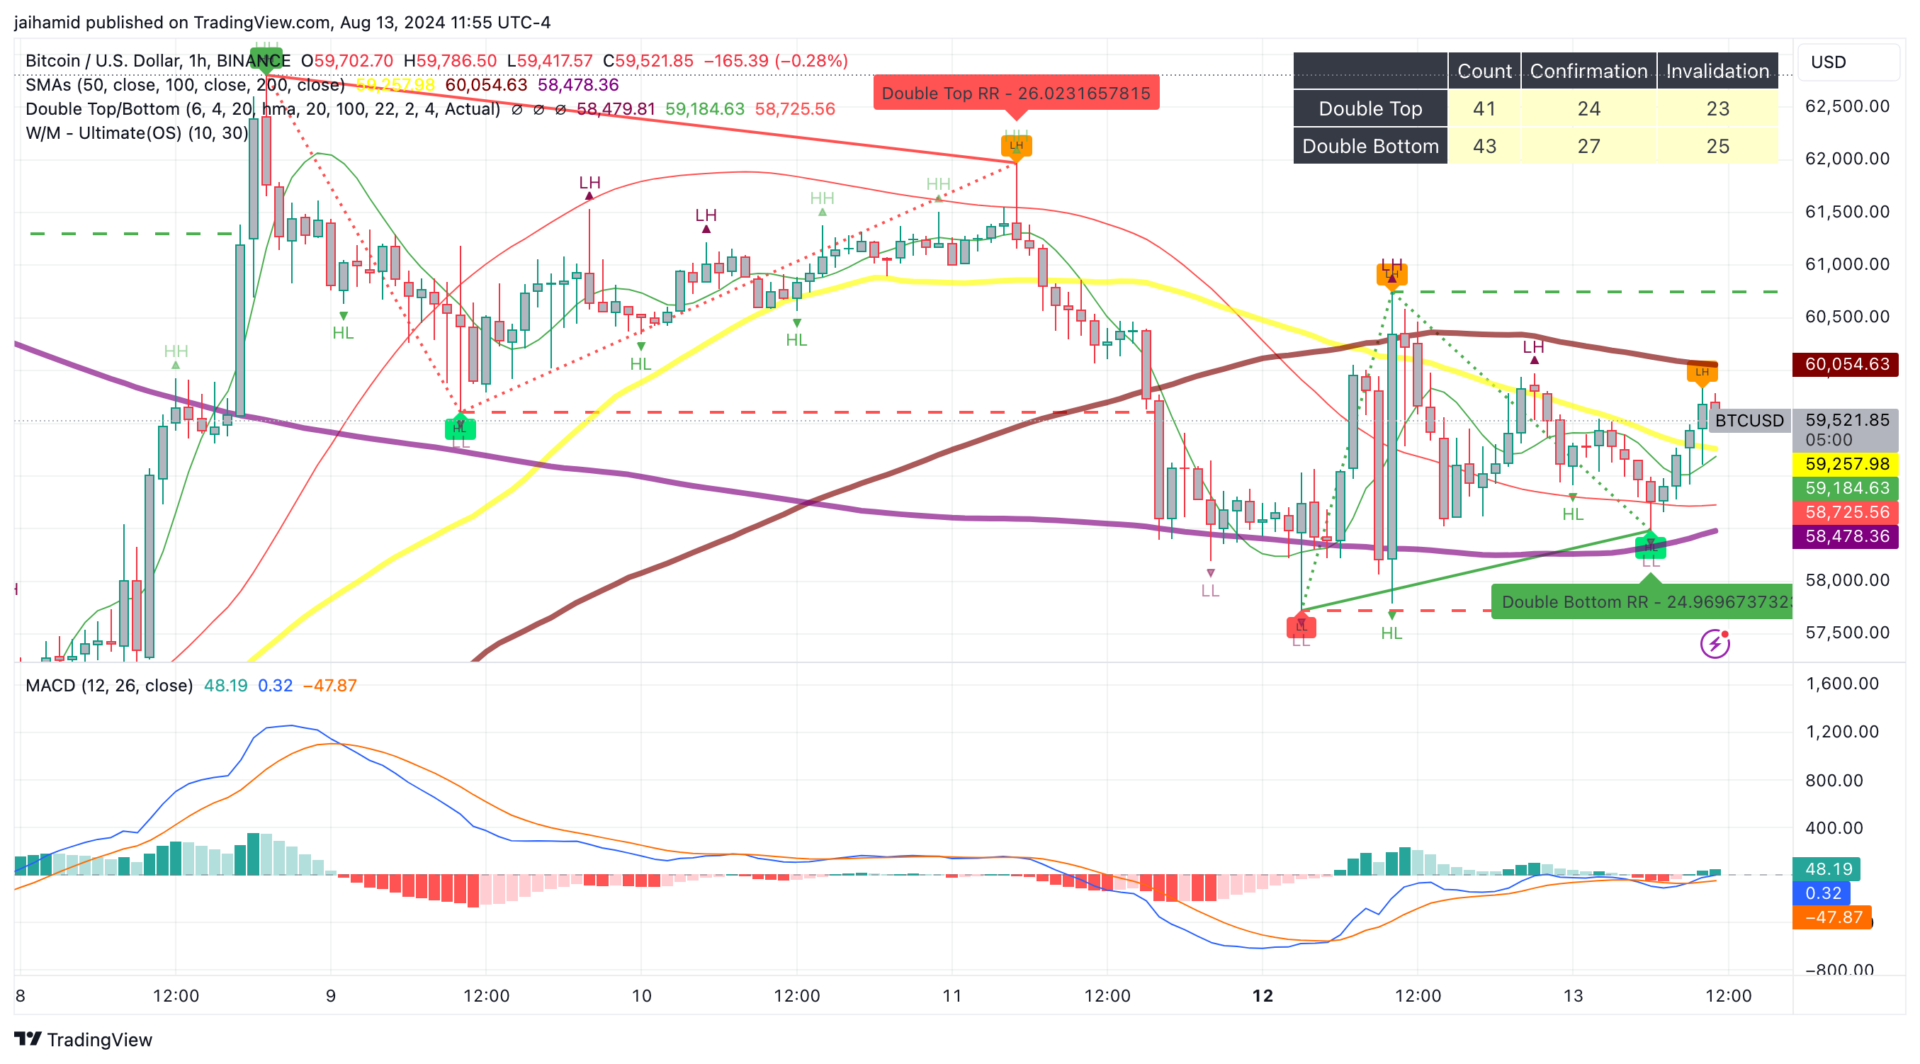
But that’s not all. The price also formed a Double Bottom pattern with an RR of 24.9696737323. Now, this could suggest a potential for recovery if, and it’s a big if, the bulls can get their act together and push through the resistance.
But the presence of both these patterns at such close intervals makes the situation even more complex and unpredictable.
Then there’s the MACD, with its line currently at 47.95, just above the signal line at 0.02, with a histogram value of -47.93.
So while the line being above the signal line suggests there’s some bullish momentum, the negative histogram value is a red flag.
It tells us that this bullish momentum isn’t strong, and the market is far from convinced that this rebound is the real deal.